Statistik Asas
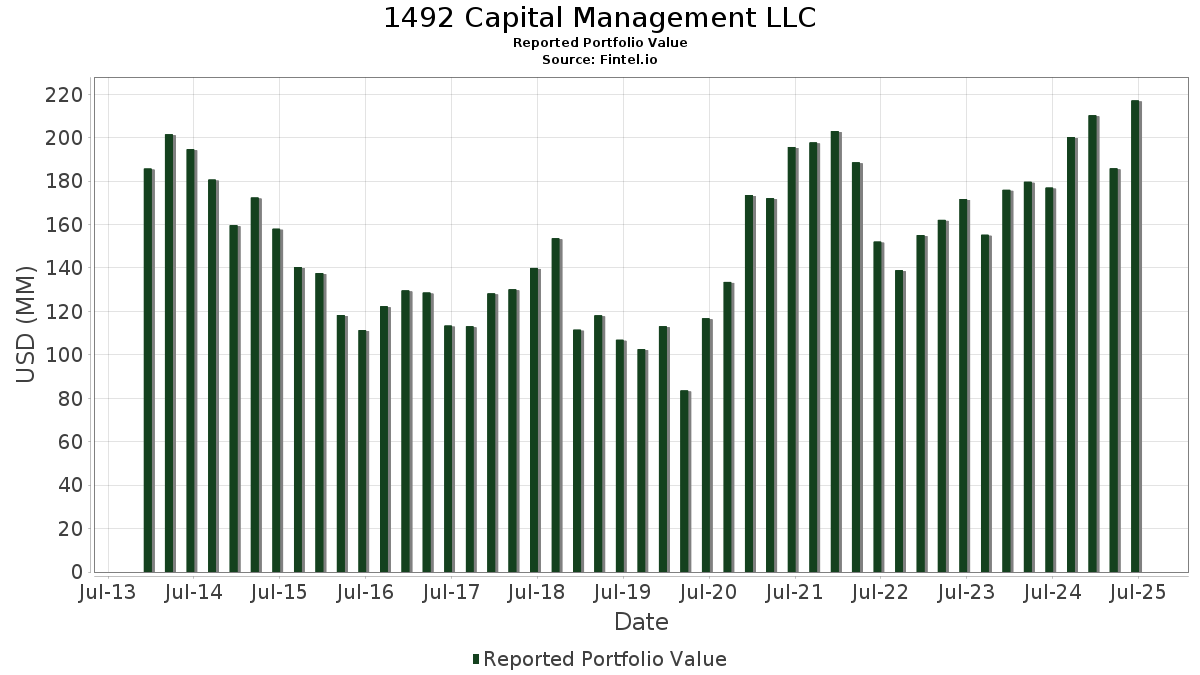
| Nilai Portfolio | $ 217,083,979 |
| Kedudukan Semasa | 113 |
Pegangan Terkini, Prestasi, AUM (dari 13F, 13D)
1492 Capital Management LLC telah mendedahkan 113 jumlah pegangan dalam pemfailan SEC terkini mereka. Nilai portfolio terkini dikira sebagai $ 217,083,979 USD. Aset Sebenar Di Bawah Pengurusan (AUM) ialah nilai ini ditambah dengan tunai (yang tidak didedahkan). Pegangan teratas 1492 Capital Management LLC ialah Verona Pharma plc - Depositary Receipt (Common Stock) (US:VRNA) , Magnite, Inc. (US:MGNI) , Carpenter Technology Corporation (US:CRS) , WNS (Holdings) Limited (US:WNS) , and Copa Holdings, S.A. (US:CPA) . Kedudukan baharu 1492 Capital Management LLC termasuk AeroVironment, Inc. (US:AVAV) , DHT Holdings, Inc. (US:DHT) , DeFi Technologies Inc. (US:DEFT) , Douglas Dynamics, Inc. (US:PLOW) , and PureCycle Technologies, Inc. - Equity Warrant (US:PCTTW) .
Kenaikan Teratas Suku Tahun Ini
Kami menggunakan perubahan dalam peruntukan portfolio kerana ini adalah metrik yang paling bermakna. Perubahan boleh disebabkan oleh perdagangan atau perubahan dalam harga saham.
| Sekuriti | Saham (MM) |
Nilai (MM$) |
Portfolio % | ΔPortfolio % |
|---|---|---|---|---|
| 0.32 | 7.76 | 3.5768 | 1.5764 | |
| 0.19 | 3.52 | 1.6207 | 1.3893 | |
| 0.01 | 2.01 | 0.9246 | 0.9246 | |
| 0.02 | 1.93 | 0.8901 | 0.8901 | |
| 0.10 | 9.27 | 4.2722 | 0.8785 | |
| 0.04 | 2.99 | 1.3786 | 0.8642 | |
| 0.09 | 4.79 | 2.2082 | 0.7893 | |
| 0.11 | 2.26 | 1.0421 | 0.7794 | |
| 0.16 | 1.75 | 0.8043 | 0.7029 | |
| 0.06 | 1.78 | 0.8200 | 0.6892 |
Penurunan Teratas Suku Tahun Ini
Kami menggunakan perubahan dalam peruntukan portfolio kerana ini adalah metrik yang paling bermakna. Perubahan boleh disebabkan oleh perdagangan atau perubahan dalam harga saham.
| Sekuriti | Saham (MM) |
Nilai (MM$) |
Portfolio % | ΔPortfolio % |
|---|---|---|---|---|
| 0.01 | 0.32 | 0.1473 | -2.1731 | |
| 0.01 | 2.77 | 1.2762 | -1.1211 | |
| 0.03 | 1.95 | 0.8988 | -1.0055 | |
| 0.06 | 5.10 | 2.3490 | -0.8753 | |
| 0.25 | 2.91 | 1.3425 | -0.8104 | |
| 0.02 | 1.71 | 0.7857 | -0.6432 | |
| 0.09 | 1.21 | 0.5553 | -0.5337 | |
| 0.46 | 1.73 | 0.7952 | -0.4967 | |
| 0.01 | 1.86 | 0.8575 | -0.4506 | |
| 0.42 | 2.45 | 1.1268 | -0.3995 |
13F dan Pemfailan Dana
Borang ini telah difailkan pada 2025-08-13 untuk tempoh pelaporan 2025-06-30. Klik ikon pautan untuk melihat sejarah transaksi penuh.
Tingkatkan untuk membuka data premium dan eksport ke Excel ![]() .
.
| Sekuriti | Jenis | Purata Harga Saham | Saham (MM) |
ΔSaham (%) |
ΔSaham (%) |
Nilai ($MM) |
Portfolio (%) |
ΔPortfolio (%) |
|
|---|---|---|---|---|---|---|---|---|---|
| VRNA / Verona Pharma plc - Depositary Receipt (Common Stock) | 0.10 | -1.28 | 9.27 | 47.07 | 4.2722 | 0.8785 | |||
| MGNI / Magnite, Inc. | 0.32 | -1.19 | 7.76 | 108.88 | 3.5768 | 1.5764 | |||
| CRS / Carpenter Technology Corporation | 0.03 | -9.52 | 7.57 | 38.02 | 3.4850 | 0.5352 | |||
| WNS / WNS (Holdings) Limited | 0.11 | 1.44 | 7.14 | 4.32 | 3.2899 | -0.3941 | |||
| CPA / Copa Holdings, S.A. | 0.06 | -1.71 | 6.19 | 16.91 | 2.8503 | 0.0020 | |||
| ZETA / Zeta Global Holdings Corp. | 0.39 | -1.48 | 6.01 | 12.57 | 2.7690 | -0.1051 | |||
| IMAX / IMAX Corporation | 0.21 | -1.31 | 5.79 | 4.72 | 2.6690 | -0.3085 | |||
| FOUR / Shift4 Payments, Inc. | 0.06 | -1.53 | 5.77 | 19.45 | 2.6596 | 0.0583 | |||
| HQY / HealthEquity, Inc. | 0.05 | -1.52 | 5.46 | 16.73 | 2.5132 | -0.0017 | |||
| GENI / Genius Sports Limited | 0.51 | -1.17 | 5.33 | 2.68 | 2.4541 | -0.3379 | |||
| SF / Stifel Financial Corp. | 0.05 | -1.81 | 5.12 | 8.10 | 2.3600 | -0.1903 | |||
| LNTH / Lantheus Holdings, Inc. | 0.06 | 1.47 | 5.10 | -14.89 | 2.3490 | -0.8753 | |||
| PEGA / Pegasystems Inc. | 0.09 | 97.47 | 5.04 | 53.74 | 2.3197 | 0.5572 | |||
| JEF / Jefferies Financial Group Inc. | 0.09 | 78.08 | 4.79 | 81.83 | 2.2082 | 0.7893 | |||
| ADTN / ADTRAN Holdings, Inc. | 0.47 | -1.51 | 4.24 | 1.31 | 1.9544 | -0.2992 | |||
| CAKE / The Cheesecake Factory Incorporated | 0.07 | -1.48 | 4.22 | 26.88 | 1.9440 | 0.1538 | |||
| SRAD / Sportradar Group AG | 0.13 | 2.70 | 3.56 | 33.38 | 1.6421 | 0.2039 | |||
| TNDM / Tandem Diabetes Care, Inc. | 0.19 | 740.92 | 3.52 | 718.14 | 1.6207 | 1.3893 | |||
| INR / Infinity Natural Resources, Inc. | 0.18 | 33.87 | 3.32 | 30.76 | 1.5313 | 0.1629 | |||
| ACEL / Accel Entertainment, Inc. | 0.27 | -1.34 | 3.22 | 17.07 | 1.4822 | 0.0030 | |||
| DKNG / DraftKings Inc. | 0.07 | 40.28 | 3.11 | 81.15 | 1.4347 | 0.5096 | |||
| MTH / Meritage Homes Corporation | 0.04 | 231.38 | 2.99 | 213.30 | 1.3786 | 0.8642 | |||
| SN / SharkNinja, Inc. | 0.03 | 60.68 | 2.97 | 90.70 | 1.3695 | 0.5305 | |||
| GTLS / Chart Industries, Inc. | 0.02 | 53.50 | 2.95 | 75.06 | 1.3582 | 0.4519 | |||
| GDYN / Grid Dynamics Holdings, Inc. | 0.25 | -1.29 | 2.91 | -27.15 | 1.3425 | -0.8104 | |||
| MXL / MaxLinear, Inc. | 0.20 | -1.18 | 2.80 | 29.30 | 1.2891 | 0.1245 | |||
| STRL / Sterling Infrastructure, Inc. | 0.01 | -69.49 | 2.77 | -37.81 | 1.2762 | -1.1211 | |||
| SIMO / Silicon Motion Technology Corporation - Depositary Receipt (Common Stock) | 0.04 | 15.35 | 2.72 | 71.46 | 1.2539 | 0.3998 | |||
| GVA / Granite Construction Incorporated | 0.03 | -2.90 | 2.52 | 20.44 | 1.1593 | 0.0346 | |||
| KURA / Kura Oncology, Inc. | 0.42 | -1.35 | 2.45 | -13.75 | 1.1268 | -0.3995 | |||
| PRIM / Primoris Services Corporation | 0.03 | -26.14 | 2.41 | 0.29 | 1.1098 | -0.1831 | |||
| PR / Permian Resources Corporation | 0.17 | 5.53 | 2.37 | 3.95 | 1.0924 | -0.1355 | |||
| AMKR / Amkor Technology, Inc. | 0.11 | 298.79 | 2.26 | 363.52 | 1.0421 | 0.7794 | |||
| MTRX / Matrix Service Company | 0.16 | -14.86 | 2.11 | -7.48 | 0.9742 | -0.2556 | |||
| NVGS / Navigator Holdings Ltd. | 0.15 | 32.34 | 2.10 | 40.64 | 0.9696 | 0.1645 | |||
| ARQ / Arq, Inc. | 0.38 | -1.30 | 2.03 | 27.07 | 0.9347 | 0.0756 | |||
| AVAV / AeroVironment, Inc. | 0.01 | 2.01 | 0.9246 | 0.9246 | |||||
| AIOT / PowerFleet, Inc. | 0.46 | 16.06 | 1.99 | -8.86 | 0.9150 | -0.2581 | |||
| PNFP / Pinnacle Financial Partners, Inc. | 0.02 | 0.00 | 1.96 | 4.09 | 0.9028 | -0.1101 | |||
| WSBC / WesBanco, Inc. | 0.06 | -2.87 | 1.96 | -0.76 | 0.9017 | -0.1598 | |||
| STC / Stewart Information Services Corporation | 0.03 | -39.57 | 1.95 | -44.86 | 0.8988 | -1.0055 | |||
| LITE / Lumentum Holdings Inc. | 0.02 | 1.93 | 0.8901 | 0.8901 | |||||
| BKSY / BlackSky Technology Inc. | 0.09 | 0.00 | 1.93 | 166.21 | 0.8893 | 0.4991 | |||
| TCBX / Third Coast Bancshares, Inc. | 0.06 | 0.00 | 1.91 | -2.11 | 0.8779 | -0.1696 | |||
| OLED / Universal Display Corporation | 0.01 | -30.85 | 1.86 | -23.42 | 0.8575 | -0.4506 | |||
| PAYO / Payoneer Global Inc. | 0.27 | 76.03 | 1.85 | 65.03 | 0.8525 | 0.2487 | |||
| AUB / Atlantic Union Bankshares Corporation | 0.06 | 628.76 | 1.78 | 632.51 | 0.8200 | 0.6892 | |||
| MHO / M/I Homes, Inc. | 0.02 | 103.50 | 1.75 | 99.77 | 0.8047 | 0.3343 | |||
| HBM / Hudbay Minerals Inc. | 0.16 | 563.28 | 1.75 | 828.19 | 0.8043 | 0.7029 | |||
| ADMA / ADMA Biologics, Inc. | 0.10 | 95.17 | 1.74 | 79.24 | 0.8036 | 0.2796 | |||
| MNKD / MannKind Corporation | 0.46 | -3.29 | 1.73 | -28.08 | 0.7952 | -0.4967 | |||
| INDI / indie Semiconductor, Inc. | 0.48 | 108.81 | 1.72 | 265.39 | 0.7932 | 0.5395 | |||
| ATI / ATI Inc. | 0.02 | -61.29 | 1.71 | -35.78 | 0.7857 | -0.6432 | |||
| DT / Dynatrace, Inc. | 0.03 | 427.70 | 1.63 | 518.56 | 0.7525 | 0.6102 | |||
| SM / SM Energy Company | 0.06 | 0.19 | 1.59 | -17.35 | 0.7332 | -0.3031 | |||
| GXO / GXO Logistics, Inc. | 0.03 | 0.00 | 1.46 | 24.64 | 0.6714 | 0.0420 | |||
| DHT / DHT Holdings, Inc. | 0.13 | 1.42 | 0.6530 | 0.6530 | |||||
| PBPB / Potbelly Corporation | 0.11 | 1.40 | 0.6450 | 0.6450 | |||||
| DEFT / DeFi Technologies Inc. | 0.47 | 1.38 | 0.6364 | 0.6364 | |||||
| GTLB / GitLab Inc. | 0.03 | 68.54 | 1.36 | 61.67 | 0.6260 | 0.1739 | |||
| VEU / Vanguard International Equity Index Funds - Vanguard FTSE All-World ex-US ETF | 0.02 | -1.07 | 1.29 | 9.69 | 0.5949 | -0.0390 | |||
| NPKI / NPK International Inc. | 0.15 | -44.70 | 1.29 | -19.03 | 0.5922 | -0.2619 | |||
| AXSM / Axsome Therapeutics, Inc. | 0.01 | 1.24 | 0.5695 | 0.5695 | |||||
| ALHC / Alignment Healthcare, Inc. | 0.09 | -20.78 | 1.21 | -40.43 | 0.5553 | -0.5337 | |||
| GSM / Ferroglobe PLC | 0.32 | 0.00 | 1.19 | -1.08 | 0.5476 | -0.0991 | |||
| LYFT / Lyft, Inc. | 0.07 | 1.10 | 0.5063 | 0.5063 | |||||
| VKTX / Viking Therapeutics, Inc. | 0.04 | -0.12 | 1.09 | 9.59 | 0.5006 | -0.0330 | |||
| RNG / RingCentral, Inc. | 0.04 | 0.00 | 1.01 | 14.53 | 0.4652 | -0.0094 | |||
| QUIK / QuickLogic Corporation | 0.15 | 0.39 | 0.95 | 21.05 | 0.4372 | 0.0152 | |||
| WING / Wingstop Inc. | 0.00 | 0.00 | 0.88 | 49.16 | 0.4072 | 0.0885 | |||
| BOOT / Boot Barn Holdings, Inc. | 0.01 | 0.00 | 0.83 | 41.50 | 0.3834 | 0.0668 | |||
| PLOW / Douglas Dynamics, Inc. | 0.02 | 0.70 | 0.3234 | 0.3234 | |||||
| BTDR / Bitdeer Technologies Group | 0.06 | 0.00 | 0.66 | 29.92 | 0.3043 | 0.0309 | |||
| PCTTW / PureCycle Technologies, Inc. - Equity Warrant | 0.64 | 173.39 | 0.2938 | 0.1680 | |||||
| DDI / DoubleDown Interactive Co., Ltd. - Depositary Receipt (Common Stock) | 0.06 | 0.59 | 0.2731 | 0.2731 | |||||
| EEM / iShares, Inc. - iShares MSCI Emerging Markets ETF | 0.01 | -1.35 | 0.57 | 9.02 | 0.2617 | -0.0190 | |||
| ANIP / ANI Pharmaceuticals, Inc. | 0.01 | -2.54 | 0.50 | -4.93 | 0.2309 | -0.0531 | |||
| IGSB / iShares Trust - iShares 1-5 Year Investment Grade Corporate Bond ETF | 0.01 | -2.16 | 0.48 | -1.43 | 0.2223 | -0.0412 | |||
| GENK / GEN Restaurant Group, Inc. | 0.11 | 0.00 | 0.44 | -29.41 | 0.2050 | -0.1340 | |||
| MSFT / Microsoft Corporation | 0.00 | -1.34 | 0.40 | 30.62 | 0.1851 | 0.0197 | |||
| META / Meta Platforms, Inc. | 0.00 | -1.15 | 0.38 | 26.76 | 0.1748 | 0.0135 | |||
| VCSH / Vanguard Scottsdale Funds - Vanguard Short-Term Corporate Bond ETF | 0.00 | 0.00 | 0.37 | 0.54 | 0.1726 | -0.0276 | |||
| WULF / TeraWulf Inc. | 0.09 | 0.00 | 0.37 | 60.34 | 0.1718 | 0.0467 | |||
| VBTX / Veritex Holdings, Inc. | 0.01 | -92.90 | 0.32 | -92.60 | 0.1473 | -2.1731 | |||
| DX / Dynex Capital, Inc. | 0.03 | 0.00 | 0.31 | -6.31 | 0.1441 | -0.0353 | |||
| ADEA / Adeia Inc. | 0.02 | 32.39 | 0.30 | 41.40 | 0.1404 | 0.0246 | |||
| KMPR / Kemper Corporation | 0.00 | 19.94 | 0.30 | 15.83 | 0.1382 | -0.0012 | |||
| ETN / Eaton Corporation plc | 0.00 | -1.30 | 0.30 | 29.69 | 0.1368 | 0.0135 | |||
| SPIB / SPDR Series Trust - SPDR Portfolio Intermediate Term Corporate Bond ETF | 0.01 | -7.58 | 0.29 | -6.56 | 0.1316 | -0.0329 | |||
| GMRE / Global Medical REIT Inc. | 0.04 | 16.25 | 0.28 | -7.89 | 0.1293 | -0.0348 | |||
| BA / The Boeing Company | 0.00 | 0.27 | 0.1252 | 0.1252 | |||||
| KALU / Kaiser Aluminum Corporation | 0.00 | 0.27 | 0.1251 | 0.1251 | |||||
| XHR / Xenia Hotels & Resorts, Inc. | 0.02 | 28.84 | 0.26 | 38.10 | 0.1204 | 0.0183 | |||
| AROC / Archrock, Inc. | 0.01 | 0.26 | 0.1199 | 0.1199 | |||||
| CADE / Cadence Bank | 0.01 | 0.00 | 0.26 | 5.35 | 0.1181 | -0.0131 | |||
| ARLO / Arlo Technologies, Inc. | 0.01 | -16.31 | 0.25 | 44.51 | 0.1152 | 0.0216 | |||
| PB / Prosperity Bancshares, Inc. | 0.00 | 0.00 | 0.24 | -1.66 | 0.1095 | -0.0205 | |||
| BAC / Bank of America Corporation | 0.00 | -1.27 | 0.23 | 12.14 | 0.1065 | -0.0046 | |||
| AMZN / Amazon.com, Inc. | 0.00 | -1.86 | 0.23 | 13.24 | 0.1064 | -0.0034 | |||
| GTY / Getty Realty Corp. | 0.01 | 0.00 | 0.23 | -11.24 | 0.1056 | -0.0336 | |||
| GOOGL / Alphabet Inc. | 0.00 | -11.87 | 0.23 | 0.44 | 0.1055 | -0.0172 | |||
| ANDE / The Andersons, Inc. | 0.01 | 28.44 | 0.23 | 10.14 | 0.1053 | -0.0066 | |||
| ABCB / Ameris Bancorp | 0.00 | 0.22 | 0.1005 | 0.1005 | |||||
| ADC / Agree Realty Corporation | 0.00 | 0.00 | 0.22 | -5.24 | 0.1001 | -0.0234 | |||
| OBK / Origin Bancorp, Inc. | 0.01 | 0.00 | 0.21 | 2.88 | 0.0988 | -0.0132 | |||
| STAG / STAG Industrial, Inc. | 0.01 | 0.00 | 0.21 | 0.47 | 0.0986 | -0.0161 | |||
| LGND / Ligand Pharmaceuticals Incorporated | 0.00 | 0.21 | 0.0982 | 0.0982 | |||||
| IDCC / InterDigital, Inc. | 0.00 | 0.21 | 0.0972 | 0.0972 | |||||
| SHY / iShares Trust - iShares 1-3 Year Treasury Bond ETF | 0.00 | 0.21 | 0.0962 | 0.0962 | |||||
| SHIM / Shimmick Corporation | 0.11 | -2.46 | 0.19 | -5.08 | 0.0862 | -0.0200 | |||
| RSVRW / Reservoir Media, Inc. - Equity Warrant | 0.18 | -0.54 | 0.0845 | -0.0150 | |||||
| JILL / J.Jill, Inc. | 0.01 | 0.16 | 0.0731 | 0.0731 | |||||
| POWW / Outdoor Holding Company | 0.10 | 0.00 | 0.13 | -6.94 | 0.0618 | -0.0160 | |||
| CPA / Copa Holdings, S.A. | Call | 0.00 | -100.00 | 0.00 | -100.00 | -0.1244 | |||
| DCGO / DocGo Inc. | 0.00 | -100.00 | 0.00 | 0.0000 | |||||
| GS / The Goldman Sachs Group, Inc. | 0.00 | -100.00 | 0.00 | 0.0000 | |||||
| AMGN / Amgen Inc. | 0.00 | -100.00 | 0.00 | 0.0000 | |||||
| VRTX / Vertex Pharmaceuticals Incorporated | 0.00 | -100.00 | 0.00 | 0.0000 | |||||
| SYRS / Syros Pharmaceuticals, Inc. | 0.00 | -100.00 | 0.00 | 0.0000 | |||||
| CRGY / Crescent Energy Company | 0.00 | -100.00 | 0.00 | 0.0000 | |||||
| OSCR / Oscar Health, Inc. | 0.00 | -100.00 | 0.00 | 0.0000 | |||||
| EHC / Encompass Health Corporation | 0.00 | -100.00 | 0.00 | 0.0000 | |||||
| LOVE / The Lovesac Company | 0.00 | -100.00 | 0.00 | 0.0000 | |||||
| THG / The Hanover Insurance Group, Inc. | 0.00 | -100.00 | 0.00 | 0.0000 | |||||
| FI / Fiserv, Inc. | 0.00 | -100.00 | 0.00 | 0.0000 | |||||
| EEX / Emerald Holding, Inc. | 0.00 | -100.00 | 0.00 | 0.0000 | |||||
| PIPR / Piper Sandler Companies | 0.00 | -100.00 | 0.00 | 0.0000 | |||||
| AMEH / Apollo Medical Holdings, Inc. | 0.00 | -100.00 | 0.00 | 0.0000 | |||||
| CALX / Calix, Inc. | 0.00 | -100.00 | 0.00 | 0.0000 |