Statistik Asas
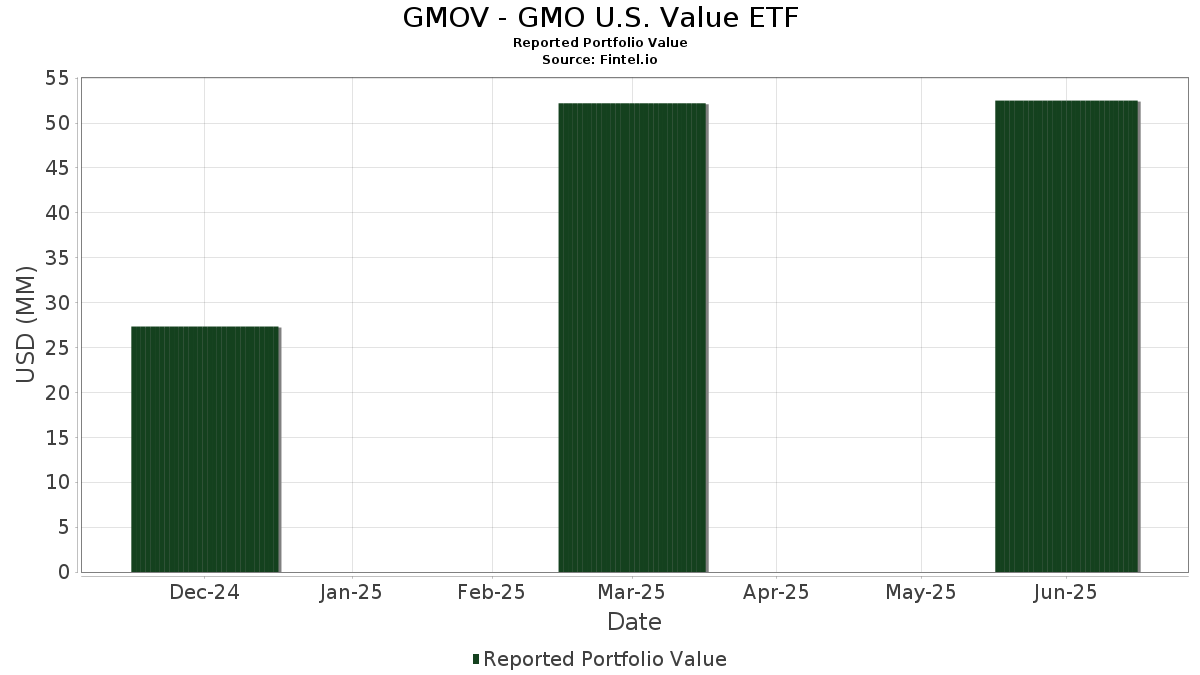
| Nilai Portfolio | $ 52,503,499 |
| Kedudukan Semasa | 164 |
Pegangan Terkini, Prestasi, AUM (dari 13F, 13D)
GMOV - GMO U.S. Value ETF telah mendedahkan 164 jumlah pegangan dalam pemfailan SEC terkini mereka. Nilai portfolio terkini dikira sebagai $ 52,503,499 USD. Aset Sebenar Di Bawah Pengurusan (AUM) ialah nilai ini ditambah dengan tunai (yang tidak didedahkan). Pegangan teratas GMOV - GMO U.S. Value ETF ialah Exxon Mobil Corporation (US:XOM) , JPMorgan Chase & Co. (US:JPM) , Meta Platforms, Inc. (US:META) , Johnson & Johnson (US:JNJ) , and Cisco Systems, Inc. (US:CSCO) . Kedudukan baharu GMOV - GMO U.S. Value ETF termasuk Wells Fargo & Company (US:WFC) , Delta Air Lines, Inc. (US:DAL) , Carrier Global Corporation (US:CARR) , Match Group, Inc. (US:MTCH) , and MetLife, Inc. (US:MET) .
Kenaikan Teratas Suku Tahun Ini
Kami menggunakan perubahan dalam peruntukan portfolio kerana ini adalah metrik yang paling bermakna. Perubahan boleh disebabkan oleh perdagangan atau perubahan dalam harga saham.
| Sekuriti | Saham (MM) |
Nilai (MM$) |
Portfolio % | ΔPortfolio % |
|---|---|---|---|---|
| 0.03 | 1.06 | 2.0159 | 1.3051 | |
| 0.00 | 1.68 | 3.1941 | 1.2211 | |
| 0.02 | 0.72 | 1.3614 | 0.8792 | |
| 0.00 | 0.60 | 1.1509 | 0.4818 | |
| 0.01 | 1.29 | 2.4510 | 0.4778 | |
| 0.00 | 0.43 | 0.8143 | 0.4737 | |
| 0.00 | 0.23 | 0.4355 | 0.4355 | |
| 0.01 | 0.56 | 1.0598 | 0.4353 | |
| 0.02 | 1.07 | 2.0329 | 0.4090 | |
| 0.65 | 0.65 | 1.2361 | 0.3981 |
Penurunan Teratas Suku Tahun Ini
Kami menggunakan perubahan dalam peruntukan portfolio kerana ini adalah metrik yang paling bermakna. Perubahan boleh disebabkan oleh perdagangan atau perubahan dalam harga saham.
| Sekuriti | Saham (MM) |
Nilai (MM$) |
Portfolio % | ΔPortfolio % |
|---|---|---|---|---|
| 0.00 | 0.09 | 0.1701 | -0.6154 | |
| 0.00 | 0.58 | 1.1133 | -0.6107 | |
| 0.02 | 1.79 | 3.4092 | -0.5497 | |
| 0.01 | 0.38 | 0.7222 | -0.5440 | |
| 0.01 | 1.39 | 2.6462 | -0.5304 | |
| 0.01 | 1.62 | 3.0918 | -0.5252 | |
| 0.00 | 0.23 | 0.4368 | -0.4933 | |
| 0.01 | 0.31 | 0.5813 | -0.4629 | |
| 0.00 | 0.78 | 1.4907 | -0.4221 | |
| 0.03 | 1.26 | 2.3930 | -0.4037 |
13F dan Pemfailan Dana
Borang ini telah difailkan pada 2025-08-26 untuk tempoh pelaporan 2025-06-30. Klik ikon pautan untuk melihat sejarah transaksi penuh.
Tingkatkan untuk membuka data premium dan eksport ke Excel ![]() .
.
| Sekuriti | Jenis | Purata Harga Saham | Saham (MM) |
ΔSaham (%) |
ΔSaham (%) |
Nilai ($MM) |
Portfolio (%) |
ΔPortfolio (%) |
|
|---|---|---|---|---|---|---|---|---|---|
| XOM / Exxon Mobil Corporation | 0.02 | -4.04 | 1.79 | -13.02 | 3.4092 | -0.5497 | |||
| JPM / JPMorgan Chase & Co. | 0.01 | -23.38 | 1.69 | -9.42 | 3.2209 | -0.3714 | |||
| META / Meta Platforms, Inc. | 0.00 | 146.64 | 1.68 | 211.32 | 3.1941 | 1.2211 | |||
| JNJ / Johnson & Johnson | 0.01 | -6.27 | 1.62 | -13.66 | 3.0918 | -0.5252 | |||
| CSCO / Cisco Systems, Inc. | 0.02 | -14.86 | 1.49 | -4.31 | 2.8294 | -0.1559 | |||
| CVX / Chevron Corporation | 0.01 | -1.70 | 1.39 | -15.86 | 2.6462 | -0.5304 | |||
| QCOM / QUALCOMM Incorporated | 0.01 | 21.01 | 1.29 | 25.44 | 2.4510 | 0.4778 | |||
| VZ / Verizon Communications Inc. | 0.03 | -9.40 | 1.26 | -13.61 | 2.3930 | -0.4037 | |||
| PFE / Pfizer Inc. | 0.05 | 1.02 | 1.20 | -3.38 | 2.2856 | -0.1033 | |||
| MRK / Merck & Co., Inc. | 0.01 | 10.23 | 1.16 | -2.76 | 2.2124 | -0.0862 | |||
| CMCSA / Comcast Corporation | 0.03 | -9.41 | 1.16 | -12.45 | 2.2094 | -0.3375 | |||
| BAC / Bank of America Corporation | 0.02 | -15.38 | 1.14 | -4.06 | 2.1615 | -0.1136 | |||
| CVS / CVS Health Corporation | 0.02 | 24.19 | 1.07 | 26.54 | 2.0329 | 0.4090 | |||
| VICI / VICI Properties Inc. | 0.03 | 186.64 | 1.06 | 186.99 | 2.0159 | 1.3051 | |||
| CI / The Cigna Group | 0.00 | -2.22 | 1.02 | -1.73 | 1.9421 | -0.0544 | |||
| C / Citigroup Inc. | 0.01 | -20.56 | 0.85 | -4.72 | 1.6144 | -0.0974 | |||
| REGN / Regeneron Pharmaceuticals, Inc. | 0.00 | -4.91 | 0.78 | -21.31 | 1.4907 | -0.4221 | |||
| EOG / EOG Resources, Inc. | 0.01 | -10.57 | 0.77 | -16.67 | 1.4668 | -0.3094 | |||
| BMY / Bristol-Myers Squibb Company | 0.02 | 275.74 | 0.72 | 186.00 | 1.3614 | 0.8792 | |||
| GS / The Goldman Sachs Group, Inc. | 0.00 | -38.07 | 0.70 | -19.79 | 1.3280 | -0.3436 | |||
| PNC / The PNC Financial Services Group, Inc. | 0.00 | 35.57 | 0.68 | 43.76 | 1.2953 | 0.3854 | |||
| USB / U.S. Bancorp | 0.01 | 23.47 | 0.67 | 32.35 | 1.2783 | 0.3027 | |||
| BWA / BorgWarner Inc. | 0.02 | 6.55 | 0.65 | 24.62 | 1.2436 | 0.2348 | |||
| TRIXX / State Street Institutional Investment Trust - State Street Institutional Treasury Fund Institutional Class | 0.65 | 48.99 | 0.65 | 49.20 | 1.2361 | 0.3981 | |||
| COF / Capital One Financial Corporation | 0.00 | 4.16 | 0.64 | 23.61 | 1.2256 | 0.2241 | |||
| AXP / American Express Company | 0.00 | 46.52 | 0.60 | 73.56 | 1.1509 | 0.4818 | |||
| ELV / Elevance Health, Inc. | 0.00 | -27.06 | 0.58 | -34.82 | 1.1133 | -0.6107 | |||
| TGT / Target Corporation | 0.01 | 50.76 | 0.58 | 42.44 | 1.1123 | 0.3240 | |||
| CMI / Cummins Inc. | 0.00 | -20.74 | 0.57 | -17.17 | 1.0932 | -0.2401 | |||
| UPS / United Parcel Service, Inc. | 0.01 | 86.76 | 0.56 | 71.60 | 1.0598 | 0.4353 | |||
| GOOGL / Alphabet Inc. | 0.00 | -25.98 | 0.54 | -15.62 | 1.0289 | -0.2031 | |||
| MTG / MGIC Investment Corporation | 0.02 | 0.43 | 0.49 | 12.70 | 0.9302 | 0.0975 | |||
| PYPL / PayPal Holdings, Inc. | 0.01 | 2.03 | 0.48 | 16.26 | 0.9120 | 0.1193 | |||
| CTSH / Cognizant Technology Solutions Corporation | 0.01 | -0.31 | 0.46 | 1.79 | 0.8688 | 0.0059 | |||
| GIS / General Mills, Inc. | 0.01 | 0.80 | 0.44 | -12.57 | 0.8341 | -0.1304 | |||
| EBAY / eBay Inc. | 0.01 | -26.43 | 0.44 | -19.14 | 0.8282 | -0.2061 | |||
| GM / General Motors Company | 0.01 | 23.03 | 0.43 | 28.78 | 0.8260 | 0.1779 | |||
| GOOG / Alphabet Inc. | 0.00 | 112.70 | 0.43 | 141.24 | 0.8143 | 0.4737 | |||
| MS / Morgan Stanley | 0.00 | 28.81 | 0.42 | 55.72 | 0.8042 | 0.2819 | |||
| STT / State Street Corporation | 0.00 | -27.07 | 0.41 | -13.40 | 0.7757 | -0.1288 | |||
| CNC / Centene Corporation | 0.01 | -35.57 | 0.38 | -42.40 | 0.7222 | -0.5440 | |||
| PEP / PepsiCo, Inc. | 0.00 | 132.48 | 0.37 | 104.97 | 0.7068 | 0.3581 | |||
| HIG / The Hartford Insurance Group, Inc. | 0.00 | -36.53 | 0.36 | -34.90 | 0.6859 | -0.3786 | |||
| KR / The Kroger Co. | 0.00 | -37.53 | 0.36 | -33.89 | 0.6775 | -0.3562 | |||
| AVT / Avnet, Inc. | 0.01 | 16.24 | 0.34 | 28.30 | 0.6478 | 0.1378 | |||
| AMAT / Applied Materials, Inc. | 0.00 | 37.19 | 0.33 | 73.02 | 0.6233 | 0.2595 | |||
| RDN / Radian Group Inc. | 0.01 | 3.49 | 0.32 | 12.50 | 0.6178 | 0.0642 | |||
| BK / The Bank of New York Mellon Corporation | 0.00 | -19.33 | 0.32 | -12.36 | 0.6084 | -0.0928 | |||
| PCAR / PACCAR Inc | 0.00 | -19.86 | 0.32 | -21.59 | 0.6015 | -0.1750 | |||
| F / Ford Motor Company | 0.03 | -16.44 | 0.31 | -9.51 | 0.5986 | -0.0702 | |||
| OSK / Oshkosh Corporation | 0.00 | 29.89 | 0.31 | 56.63 | 0.5849 | 0.2081 | |||
| HPQ / HP Inc. | 0.01 | -36.35 | 0.31 | -43.83 | 0.5813 | -0.4629 | |||
| FDX / FedEx Corporation | 0.00 | 187.96 | 0.30 | 169.37 | 0.5693 | 0.3551 | |||
| COP / ConocoPhillips | 0.00 | 25.21 | 0.30 | 6.81 | 0.5684 | 0.0318 | |||
| MTB / M&T Bank Corporation | 0.00 | -15.73 | 0.30 | -8.39 | 0.5615 | -0.0586 | |||
| HUM / Humana Inc. | 0.00 | -29.52 | 0.29 | -34.85 | 0.5444 | -0.2999 | |||
| DHI / D.R. Horton, Inc. | 0.00 | 3.48 | 0.28 | 4.81 | 0.5395 | 0.0202 | |||
| CAT / Caterpillar Inc. | 0.00 | 197.55 | 0.28 | 253.75 | 0.5386 | 0.3833 | |||
| CROX / Crocs, Inc. | 0.00 | 3.60 | 0.28 | -1.06 | 0.5320 | -0.0118 | |||
| AFL / Aflac Incorporated | 0.00 | -7.25 | 0.27 | -12.22 | 0.5210 | -0.0772 | |||
| LEN / Lennar Corporation | 0.00 | -11.56 | 0.27 | -14.60 | 0.5123 | -0.0948 | |||
| GEHC / GE HealthCare Technologies Inc. | 0.00 | 42.29 | 0.27 | 30.73 | 0.5113 | 0.1158 | |||
| ACGL / Arch Capital Group Ltd. | 0.00 | 33.05 | 0.27 | 26.07 | 0.5065 | 0.1003 | |||
| T / AT&T Inc. | 0.01 | 82.06 | 0.27 | 86.62 | 0.5059 | 0.2316 | |||
| LEA / Lear Corporation | 0.00 | 3.25 | 0.26 | 11.16 | 0.4940 | 0.0451 | |||
| ARW / Arrow Electronics, Inc. | 0.00 | -7.37 | 0.26 | 13.78 | 0.4874 | 0.0544 | |||
| NUE / Nucor Corporation | 0.00 | 3.46 | 0.25 | 11.71 | 0.4721 | 0.0439 | |||
| KHC / The Kraft Heinz Company | 0.01 | -10.37 | 0.24 | -23.87 | 0.4499 | -0.1476 | |||
| IVZ / Invesco Ltd. | 0.01 | 25.99 | 0.23 | 31.46 | 0.4454 | 0.1019 | |||
| AN / AutoNation, Inc. | 0.00 | 4.89 | 0.23 | 29.21 | 0.4378 | 0.0942 | |||
| MDT / Medtronic plc | 0.00 | -51.10 | 0.23 | -52.59 | 0.4368 | -0.4933 | |||
| WFC / Wells Fargo & Company | 0.00 | 0.23 | 0.4355 | 0.4355 | |||||
| HPE / Hewlett Packard Enterprise Company | 0.01 | -42.53 | 0.23 | -24.00 | 0.4353 | -0.1420 | |||
| FOX / Fox Corporation | 0.00 | 250.33 | 0.22 | 246.88 | 0.4227 | 0.2983 | |||
| LRCX / Lam Research Corporation | 0.00 | 142.33 | 0.21 | 228.13 | 0.4009 | 0.2761 | |||
| SLM / SLM Corporation | 0.01 | 2.02 | 0.21 | 13.59 | 0.3994 | 0.0452 | |||
| WU / The Western Union Company | 0.02 | 2.01 | 0.20 | -19.12 | 0.3882 | -0.0948 | |||
| AMG / Affiliated Managers Group, Inc. | 0.00 | 2.08 | 0.20 | 20.12 | 0.3864 | 0.0599 | |||
| GPI / Group 1 Automotive, Inc. | 0.00 | 4.06 | 0.20 | 18.93 | 0.3831 | 0.0579 | |||
| SYF / Synchrony Financial | 0.00 | -45.54 | 0.20 | -31.16 | 0.3828 | -0.1803 | |||
| NOC / Northrop Grumman Corporation | 0.00 | -38.24 | 0.20 | -39.88 | 0.3749 | -0.2530 | |||
| CB / Chubb Limited | 0.00 | 17.96 | 0.19 | 13.45 | 0.3694 | 0.0397 | |||
| TFC / Truist Financial Corporation | 0.00 | 38.64 | 0.19 | 45.04 | 0.3628 | 0.1098 | |||
| ZM / Zoom Communications Inc. | 0.00 | 2.24 | 0.19 | 8.05 | 0.3590 | 0.0235 | |||
| OGN / Organon & Co. | 0.02 | 29.21 | 0.19 | -15.91 | 0.3524 | -0.0713 | |||
| SIG / Signet Jewelers Limited | 0.00 | 5.20 | 0.19 | 44.53 | 0.3521 | 0.1054 | |||
| KBH / KB Home | 0.00 | 2.01 | 0.18 | -6.63 | 0.3483 | -0.0301 | |||
| TROW / T. Rowe Price Group, Inc. | 0.00 | -39.83 | 0.18 | -36.75 | 0.3412 | -0.2041 | |||
| BEN / Franklin Resources, Inc. | 0.01 | 5.66 | 0.16 | 30.65 | 0.3101 | 0.0708 | |||
| ALL / The Allstate Corporation | 0.00 | 36.43 | 0.16 | 32.50 | 0.3042 | 0.0725 | |||
| PHM / PulteGroup, Inc. | 0.00 | -15.40 | 0.15 | -12.99 | 0.2932 | -0.0480 | |||
| BBY / Best Buy Co., Inc. | 0.00 | -20.08 | 0.14 | -27.27 | 0.2751 | -0.1061 | |||
| ASO / Academy Sports and Outdoors, Inc. | 0.00 | 2.93 | 0.13 | 0.76 | 0.2547 | 0.0003 | |||
| ADM / Archer-Daniels-Midland Company | 0.00 | -41.90 | 0.13 | -36.04 | 0.2404 | -0.1397 | |||
| PVH / PVH Corp. | 0.00 | 2.39 | 0.13 | 8.62 | 0.2403 | 0.0169 | |||
| SEE / Sealed Air Corporation | 0.00 | 70.41 | 0.12 | 83.58 | 0.2360 | 0.1057 | |||
| JHG / Janus Henderson Group plc | 0.00 | 5.41 | 0.12 | 13.89 | 0.2346 | 0.0254 | |||
| ENVA / Enova International, Inc. | 0.00 | -1.91 | 0.12 | 13.21 | 0.2286 | 0.0248 | |||
| HBAN / Huntington Bancshares Incorporated | 0.01 | -1.89 | 0.12 | 10.19 | 0.2271 | 0.0177 | |||
| MTH / Meritage Homes Corporation | 0.00 | -1.90 | 0.12 | -7.14 | 0.2235 | -0.0201 | |||
| RF / Regions Financial Corporation | 0.00 | 4.31 | 0.12 | 13.59 | 0.2233 | 0.0235 | |||
| KMB / Kimberly-Clark Corporation | 0.00 | 53.32 | 0.11 | 39.51 | 0.2152 | 0.0588 | |||
| PPG / PPG Industries, Inc. | 0.00 | -29.90 | 0.11 | -27.33 | 0.2091 | -0.0805 | |||
| CBRE / CBRE Group, Inc. | 0.00 | 112.05 | 0.11 | 129.79 | 0.2064 | 0.1146 | |||
| PII / Polaris Inc. | 0.00 | 5.54 | 0.10 | 4.21 | 0.1900 | 0.0069 | |||
| WHR / Whirlpool Corporation | 0.00 | -59.12 | 0.10 | -53.95 | 0.1890 | -0.2260 | |||
| Aptiv PLC / EC (JE00BTDN8H13) | 0.00 | -28.59 | 0.10 | -18.33 | 0.1875 | -0.0438 | |||
| DG / Dollar General Corporation | 0.00 | -54.97 | 0.10 | -41.36 | 0.1815 | -0.1315 | |||
| EA / Electronic Arts Inc. | 0.00 | -5.60 | 0.09 | 4.44 | 0.1793 | 0.0057 | |||
| CH1300646267 / Bunge Global SA | 0.00 | -18.47 | 0.09 | -14.42 | 0.1707 | -0.0306 | |||
| HRB / H&R Block, Inc. | 0.00 | -78.12 | 0.09 | -78.19 | 0.1701 | -0.6154 | |||
| FHI / Federated Hermes, Inc. | 0.00 | -24.11 | 0.09 | -17.59 | 0.1699 | -0.0381 | |||
| FOXA / Fox Corporation | 0.00 | -21.52 | 0.09 | -21.82 | 0.1637 | -0.0491 | |||
| CMC / Commercial Metals Company | 0.00 | -37.57 | 0.08 | -33.60 | 0.1587 | -0.0828 | |||
| RJF / Raymond James Financial, Inc. | 0.00 | -6.91 | 0.08 | 2.50 | 0.1573 | 0.0027 | |||
| DAL / Delta Air Lines, Inc. | 0.00 | 0.08 | 0.1572 | 0.1572 | |||||
| OC / Owens Corning | 0.00 | -7.70 | 0.08 | -10.23 | 0.1505 | -0.0205 | |||
| CNXC / Concentrix Corporation | 0.00 | 127.83 | 0.08 | 117.14 | 0.1457 | 0.0777 | |||
| PRDO / Perdoceo Education Corporation | 0.00 | -1.91 | 0.08 | 27.12 | 0.1441 | 0.0298 | |||
| MLI / Mueller Industries, Inc. | 0.00 | -1.88 | 0.07 | 2.78 | 0.1417 | 0.0019 | |||
| CARR / Carrier Global Corporation | 0.00 | 0.07 | 0.1415 | 0.1415 | |||||
| CHRW / C.H. Robinson Worldwide, Inc. | 0.00 | -1.91 | 0.07 | -8.75 | 0.1406 | -0.0139 | |||
| LYB / LyondellBasell Industries N.V. | 0.00 | -63.03 | 0.07 | -69.83 | 0.1343 | -0.3122 | |||
| TSN / Tyson Foods, Inc. | 0.00 | 70.14 | 0.07 | 50.00 | 0.1322 | 0.0427 | |||
| TPH / Tri Pointe Homes, Inc. | 0.00 | -1.88 | 0.07 | -1.45 | 0.1304 | -0.0037 | |||
| G / Genpact Limited | 0.00 | -1.91 | 0.06 | -14.71 | 0.1118 | -0.0200 | |||
| MTCH / Match Group, Inc. | 0.00 | 0.06 | 0.1106 | 0.1106 | |||||
| UNM / Unum Group | 0.00 | -63.14 | 0.06 | -63.92 | 0.1103 | -0.1947 | |||
| TSLX / Sixth Street Specialty Lending, Inc. | 0.00 | -1.64 | 0.06 | 3.77 | 0.1063 | 0.0037 | |||
| MET / MetLife, Inc. | 0.00 | 0.06 | 0.1061 | 0.1061 | |||||
| TOL / Toll Brothers, Inc. | 0.00 | -1.83 | 0.06 | 7.84 | 0.1047 | 0.0050 | |||
| BBWI / Bath & Body Works, Inc. | 0.00 | 0.05 | 0.1005 | 0.1005 | |||||
| YETI / YETI Holdings, Inc. | 0.00 | 0.05 | 0.0966 | 0.0966 | |||||
| GILD / Gilead Sciences, Inc. | 0.00 | 0.05 | 0.0941 | 0.0941 | |||||
| UFPI / UFP Industries, Inc. | 0.00 | -1.80 | 0.05 | -9.43 | 0.0927 | -0.0100 | |||
| OVV / Ovintiv Inc. | 0.00 | -1.89 | 0.05 | -12.96 | 0.0900 | -0.0142 | |||
| LKQ / LKQ Corporation | 0.00 | -50.76 | 0.05 | -57.55 | 0.0864 | -0.1173 | |||
| OBDC / Blue Owl Capital Corporation | 0.00 | -47.07 | 0.04 | -48.84 | 0.0851 | -0.0809 | |||
| VNT / Vontier Corporation | 0.00 | 0.04 | 0.0843 | 0.0843 | |||||
| KDP / Keurig Dr Pepper Inc. | 0.00 | -45.71 | 0.04 | -47.62 | 0.0841 | -0.0778 | |||
| FMC / FMC Corporation | 0.00 | -1.87 | 0.04 | -4.44 | 0.0835 | -0.0033 | |||
| LNC / Lincoln National Corporation | 0.00 | 0.04 | 0.0832 | 0.0832 | |||||
| ORI / Old Republic International Corporation | 0.00 | 0.04 | 0.0820 | 0.0820 | |||||
| NEU / NewMarket Corporation | 0.00 | 16.98 | 0.04 | 40.00 | 0.0815 | 0.0238 | |||
| ATKR / Atkore Inc. | 0.00 | -1.94 | 0.04 | 13.51 | 0.0815 | 0.0101 | |||
| PINC / Premier, Inc. | 0.00 | 18.45 | 0.04 | 35.48 | 0.0812 | 0.0203 | |||
| TKR / The Timken Company | 0.00 | -1.94 | 0.04 | 0.00 | 0.0768 | -0.0016 | |||
| OMC / Omnicom Group Inc. | 0.00 | 0.04 | 0.0742 | 0.0742 | |||||
| M / Macy's, Inc. | 0.00 | -1.89 | 0.04 | -10.00 | 0.0702 | -0.0077 | |||
| MDLZ / Mondelez International, Inc. | 0.00 | -78.20 | 0.04 | -78.57 | 0.0696 | -0.2547 | |||
| TMHC / Taylor Morrison Home Corporation | 0.00 | 0.04 | 0.0674 | 0.0674 | |||||
| MAN / ManpowerGroup Inc. | 0.00 | -1.91 | 0.04 | -31.37 | 0.0671 | -0.0319 | |||
| KMI / Kinder Morgan, Inc. | 0.00 | 0.03 | 0.0661 | 0.0661 | |||||
| ENS / EnerSys | 0.00 | 0.03 | 0.0655 | 0.0655 | |||||
| MHK / Mohawk Industries, Inc. | 0.00 | 0.03 | 0.0640 | 0.0640 | |||||
| LZB / La-Z-Boy Incorporated | 0.00 | -1.86 | 0.03 | -5.71 | 0.0634 | -0.0052 | |||
| SHOO / Steven Madden, Ltd. | 0.00 | 0.03 | 0.0622 | 0.0622 | |||||
| BFH / Bread Financial Holdings, Inc. | 0.00 | 0.03 | 0.0612 | 0.0612 | |||||
| SNA / Snap-on Incorporated | 0.00 | -1.96 | 0.03 | -8.82 | 0.0592 | -0.0069 | |||
| UTHR / United Therapeutics Corporation | 0.00 | -1.92 | 0.03 | -9.37 | 0.0558 | -0.0058 | |||
| TE Connectivity PLC / EC (IE000IVNQZ81) | 0.00 | -56.99 | 0.03 | -50.00 | 0.0533 | -0.0516 | |||
| MHO / M/I Homes, Inc. | 0.00 | -1.99 | 0.03 | -3.57 | 0.0525 | -0.0026 | |||
| DVN / Devon Energy Corporation | 0.00 | 0.03 | 0.0516 | 0.0516 | |||||
| SWKS / Skyworks Solutions, Inc. | 0.00 | 0.03 | 0.0515 | 0.0515 | |||||
| EPC / Edgewell Personal Care Company | 0.00 | -100.00 | 0.00 | -100.00 | -0.0799 | ||||
| BXSL / Blackstone Secured Lending Fund | 0.00 | -100.00 | 0.00 | -100.00 | -0.0673 |