Statistik Asas
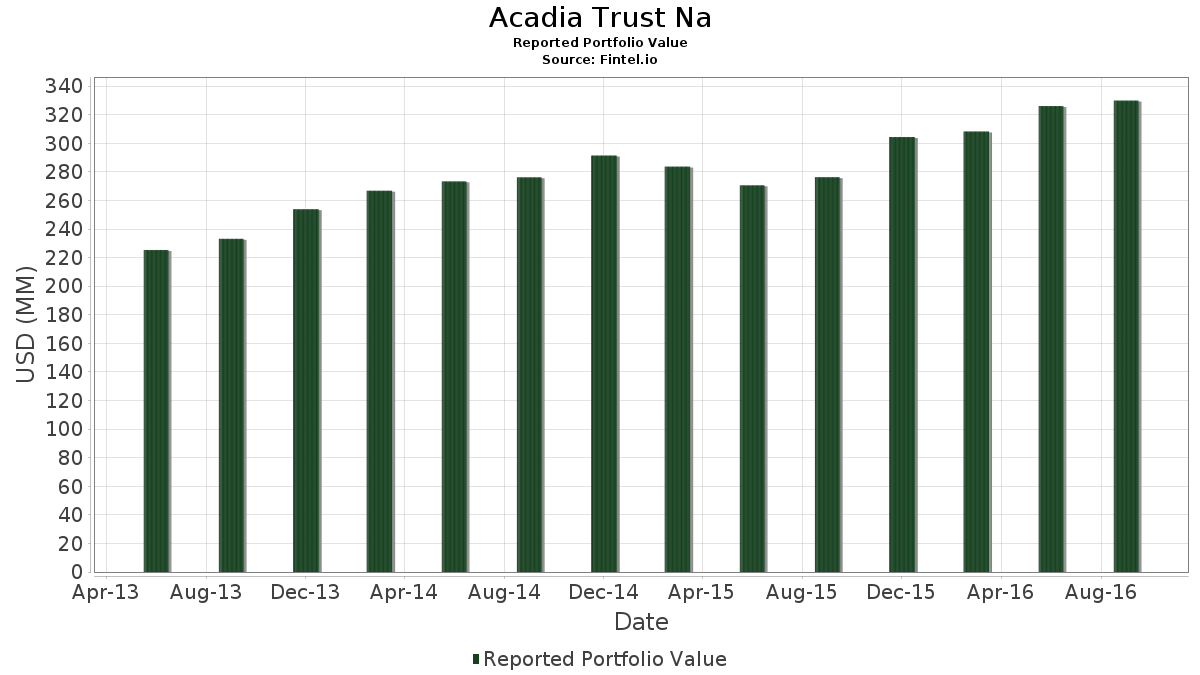
| Nilai Portfolio | $ 329,893,000 |
| Kedudukan Semasa | 74 |
Pegangan Terkini, Prestasi, AUM (dari 13F, 13D)
Acadia Trust Na telah mendedahkan 74 jumlah pegangan dalam pemfailan SEC terkini mereka. Nilai portfolio terkini dikira sebagai $ 329,893,000 USD. Aset Sebenar Di Bawah Pengurusan (AUM) ialah nilai ini ditambah dengan tunai (yang tidak didedahkan). Pegangan teratas Acadia Trust Na ialah Johnson & Johnson (US:JNJ) , Accenture plc (US:ACN) , The Procter & Gamble Company (US:PG) , Microsoft Corporation (US:MSFT) , and Ventas, Inc. (US:VTR) . Kedudukan baharu Acadia Trust Na termasuk Check Point Software Technologies Ltd. (US:CHKP) , Rockwell Collins, Inc. (US:COL) , CVS Health Corporation (US:CVS) , .
Kenaikan Teratas Suku Tahun Ini
Kami menggunakan perubahan dalam peruntukan portfolio kerana ini adalah metrik yang paling bermakna. Perubahan boleh disebabkan oleh perdagangan atau perubahan dalam harga saham.
| Sekuriti | Saham (MM) |
Nilai (MM$) |
Portfolio % | ΔPortfolio % |
|---|---|---|---|---|
| 0.06 | 7.27 | 2.2028 | 2.2028 | |
| 0.23 | 6.66 | 2.0194 | 2.0194 | |
| 0.05 | 4.13 | 1.2513 | 1.2513 | |
| 0.05 | 4.12 | 1.2501 | 1.2501 | |
| 0.09 | 4.07 | 1.2322 | 1.2322 | |
| 0.06 | 3.89 | 1.1786 | 1.1786 | |
| 0.04 | 3.48 | 1.0543 | 1.0543 | |
| 0.18 | 9.40 | 2.8491 | 0.3393 | |
| 0.18 | 6.64 | 2.0122 | 0.2774 | |
| 0.18 | 10.40 | 3.1528 | 0.2469 |
Penurunan Teratas Suku Tahun Ini
Kami menggunakan perubahan dalam peruntukan portfolio kerana ini adalah metrik yang paling bermakna. Perubahan boleh disebabkan oleh perdagangan atau perubahan dalam harga saham.
| Sekuriti | Saham (MM) |
Nilai (MM$) |
Portfolio % | ΔPortfolio % |
|---|---|---|---|---|
| 0.00 | 0.00 | -2.4055 | ||
| 0.12 | 7.83 | 2.3732 | -0.3436 | |
| 0.14 | 8.49 | 2.5730 | -0.2901 | |
| 0.04 | 9.72 | 2.9473 | -0.2877 | |
| 0.24 | 9.65 | 2.9240 | -0.2620 | |
| 0.12 | 8.79 | 2.6654 | -0.2442 | |
| 0.10 | 11.88 | 3.6018 | -0.2190 | |
| 0.09 | 7.60 | 2.3035 | -0.2158 | |
| 0.17 | 8.32 | 2.5235 | -0.1944 | |
| 0.06 | 7.20 | 2.1837 | -0.1800 |
13F dan Pemfailan Dana
Borang ini telah difailkan pada 2016-11-15 untuk tempoh pelaporan 2016-09-30. Klik ikon pautan untuk melihat sejarah transaksi penuh.
Tingkatkan untuk membuka data premium dan eksport ke Excel ![]() .
.
| Sekuriti | Jenis | Purata Harga Saham | Saham (MM) |
ΔSaham (%) |
ΔSaham (%) |
Nilai ($MM) |
Portfolio (%) |
ΔPortfolio (%) |
|
|---|---|---|---|---|---|---|---|---|---|
| JNJ / Johnson & Johnson | 0.10 | -2.07 | 11.88 | -4.63 | 3.6018 | -0.2190 | |||
| ACN / Accenture plc | 0.09 | -0.48 | 11.46 | 7.32 | 3.4729 | 0.1990 | |||
| PG / The Procter & Gamble Company | 0.12 | -0.97 | 10.80 | 4.97 | 3.2744 | 0.1185 | |||
| MSFT / Microsoft Corporation | 0.18 | -2.48 | 10.40 | 9.76 | 3.1528 | 0.2469 | |||
| VTR / Ventas, Inc. | 0.14 | -1.38 | 10.07 | -4.34 | 3.0540 | -0.1758 | |||
| BCR / C. R. Bard, Inc. - Corporate Bond/Note | 0.04 | -3.36 | 9.72 | -7.83 | 2.9473 | -0.2877 | |||
| MRK / Merck & Co., Inc. | 0.16 | -2.38 | 9.72 | 5.76 | 2.9467 | 0.1278 | |||
| T / AT&T Inc. | 0.24 | -1.19 | 9.65 | -7.15 | 2.9240 | -0.2620 | |||
| OMC / Omnicom Group Inc. | 0.11 | 0.07 | 9.45 | 4.37 | 2.8658 | 0.0880 | |||
| BDX / Becton, Dickinson and Company | 0.05 | -2.83 | 9.40 | 2.99 | 2.8503 | 0.0505 | |||
| XYL / Xylem Inc. | 0.18 | -2.23 | 9.40 | 14.85 | 2.8491 | 0.3393 | |||
| RSG / Republic Services, Inc. | 0.18 | -2.73 | 8.83 | -4.36 | 2.6766 | -0.1548 | |||
| SCU / Sculptor Capital Management Inc - Class A | 0.12 | -3.11 | 8.79 | -7.33 | 2.6654 | -0.2442 | |||
| 872307903 / TCF Financial Corporation | 0.14 | -1.95 | 8.49 | -9.08 | 2.5730 | -0.2901 | |||
| PEP / PepsiCo, Inc. | 0.08 | -1.72 | 8.41 | 0.90 | 2.5505 | -0.0068 | |||
| SYY / Sysco Corporation | 0.17 | -2.75 | 8.32 | -6.07 | 2.5235 | -0.1944 | |||
| SO / The Southern Company | 0.16 | -0.90 | 8.30 | -5.19 | 2.5148 | -0.1686 | |||
| WY / Weyerhaeuser Company | 0.26 | -1.84 | 8.25 | 5.33 | 2.4996 | 0.0987 | |||
| BCE / BCE Inc. | 0.18 | -0.71 | 8.12 | -3.08 | 2.4629 | -0.1079 | |||
| GIS / General Mills, Inc. | 0.12 | -1.34 | 7.83 | -11.63 | 2.3732 | -0.3436 | |||
| MCD / McDonald's Corporation | 0.07 | 0.39 | 7.83 | -3.76 | 2.3726 | -0.1215 | |||
| IBM / International Business Machines Corporation | 0.05 | -0.63 | 7.74 | 3.99 | 2.3453 | 0.0637 | |||
| DUK / Duke Energy Corporation | 0.09 | -0.86 | 7.60 | -7.50 | 2.3035 | -0.2158 | |||
| USB / U.S. Bancorp | 0.17 | 1.81 | 7.42 | 8.28 | 2.2507 | 0.1479 | |||
| 74005P104 / Praxair, Inc. | 0.06 | 0.25 | 7.27 | 7.79 | 2.2028 | 2.2028 | |||
| KMB / Kimberly-Clark Corporation | 0.06 | 1.86 | 7.20 | -6.54 | 2.1837 | -0.1800 | |||
| US3024451011 / FLIR Systems, Inc. | 0.23 | 2.01 | 7.08 | 3.55 | 2.1477 | 0.0495 | |||
| CAG / Conagra Brands, Inc. | 0.15 | 0.59 | 6.92 | -0.89 | 2.0964 | -0.0435 | |||
| HMC / Honda Motor Co., Ltd. - Depositary Receipt (Common Stock) | 0.23 | -0.83 | 6.66 | 13.22 | 2.0194 | 2.0194 | |||
| INTC / Intel Corporation | 0.18 | 1.95 | 6.64 | 17.34 | 2.0122 | 0.2774 | |||
| RTX / RTX Corporation | 0.06 | 2.68 | 6.22 | 1.72 | 1.8867 | 0.0102 | |||
| GE / General Electric Company | 0.21 | 3.28 | 6.21 | -2.82 | 1.8812 | -0.0772 | |||
| CB / Chubb Limited | 0.05 | 3.29 | 6.20 | -0.72 | 1.8806 | -0.0357 | |||
| FLR / Fluor Corporation | 0.11 | -0.86 | 5.46 | 3.25 | 1.6545 | 0.0334 | |||
| CHKP / Check Point Software Technologies Ltd. | 0.05 | 4.13 | 1.2513 | 1.2513 | |||||
| COL / Rockwell Collins, Inc. | 0.05 | 4.12 | 1.2501 | 1.2501 | |||||
| TRP / TC Energy Corporation | 0.09 | 0.38 | 4.07 | 5.56 | 1.2322 | 1.2322 | |||
| TGT / Target Corporation | 0.06 | 3.20 | 3.89 | 1.49 | 1.1786 | 1.1786 | |||
| XOM / Exxon Mobil Corporation | 0.04 | 0.46 | 3.68 | -6.48 | 1.1164 | -0.0912 | |||
| NVS / Novartis AG - Depositary Receipt (Common Stock) | 0.04 | 4.98 | 3.51 | 0.46 | 1.0631 | -0.0075 | |||
| CVS / CVS Health Corporation | 0.04 | 3.48 | 1.0543 | 1.0543 | |||||
| CAC / Camden National Corporation | 0.07 | -1.07 | 3.19 | 12.46 | 0.9658 | 0.0970 | |||
| HD / The Home Depot, Inc. | 0.01 | -0.81 | 1.18 | 0.00 | 0.3565 | -0.0042 | |||
| SLB / Schlumberger Limited | 0.01 | -0.81 | 0.82 | -1.33 | 0.2480 | -0.0063 | |||
| MMM / 3M Company | 0.00 | -5.68 | 0.79 | -5.04 | 0.2398 | -0.0157 | |||
| CAT / Caterpillar Inc. | 0.01 | 0.00 | 0.74 | 17.01 | 0.2231 | 0.0302 | |||
| WMT / Walmart Inc. | 0.01 | 1.01 | 0.72 | -0.14 | 0.2186 | -0.0029 | |||
| HON / Honeywell International Inc. | 0.01 | -0.48 | 0.70 | -0.43 | 0.2128 | -0.0034 | |||
| CVX / Chevron Corporation | 0.01 | -0.74 | 0.69 | -2.55 | 0.2089 | -0.0080 | |||
| DHR / Danaher Corporation | 0.01 | 0.00 | 0.57 | -22.37 | 0.1725 | -0.0523 | |||
| CL / Colgate-Palmolive Company | 0.01 | -1.12 | 0.56 | 0.18 | 0.1685 | -0.0017 | |||
| ABBV / AbbVie Inc. | 0.01 | -2.55 | 0.54 | -0.73 | 0.1640 | -0.0031 | |||
| BRK.B / Berkshire Hathaway Inc. | 0.00 | -4.09 | 0.53 | -4.50 | 0.1610 | -0.0095 | |||
| CSCO / Cisco Systems, Inc. | 0.02 | 0.00 | 0.48 | 10.50 | 0.1467 | 0.0124 | |||
| ADP / Automatic Data Processing, Inc. | 0.01 | -0.26 | 0.48 | -4.00 | 0.1455 | -0.0078 | |||
| DIS / The Walt Disney Company | 0.01 | -0.96 | 0.48 | -5.92 | 0.1446 | -0.0109 | |||
| PFE / Pfizer Inc. | 0.01 | -0.36 | 0.47 | -4.05 | 0.1437 | -0.0078 | |||
| CMCSA / Comcast Corporation | 0.01 | -0.64 | 0.47 | 1.07 | 0.1434 | -0.0001 | |||
| ABT / Abbott Laboratories | 0.01 | -7.60 | 0.46 | -0.65 | 0.1400 | -0.0026 | |||
| KO / The Coca-Cola Company | 0.01 | -2.87 | 0.46 | -9.31 | 0.1388 | -0.0160 | |||
| AAPL / Apple Inc. | 0.00 | -8.53 | 0.45 | 8.43 | 0.1364 | 0.0091 | |||
| UGI / UGI Corporation | 0.01 | -4.76 | 0.45 | -4.68 | 0.1358 | -0.0083 | |||
| NEE / NextEra Energy, Inc. | 0.00 | -0.80 | 0.44 | -6.99 | 0.1331 | -0.0117 | |||
| TRV / The Travelers Companies, Inc. | 0.00 | 4.28 | 0.42 | 0.24 | 0.1270 | -0.0012 | |||
| GPC / Genuine Parts Company | 0.00 | 0.00 | 0.39 | -0.76 | 0.1185 | -0.0023 | |||
| PNY / Piedmont Natural Gas Co., Inc. | 0.01 | 0.00 | 0.38 | -0.26 | 0.1152 | -0.0017 | |||
| JWN / Nordstrom, Inc. | 0.01 | 0.00 | 0.37 | 36.30 | 0.1116 | 0.0288 | |||
| LLY / Eli Lilly and Company | 0.00 | -0.88 | 0.36 | 1.12 | 0.1094 | -0.0001 | |||
| VZ / Verizon Communications Inc. | 0.01 | -0.50 | 0.34 | -7.32 | 0.1037 | -0.0095 | |||
| HUBB / Hubbell Incorporated | 0.00 | 0.00 | 0.34 | 2.11 | 0.1028 | 0.0009 | |||
| D / Dominion Energy, Inc. | 0.00 | -1.47 | 0.29 | -6.17 | 0.0876 | -0.0068 | |||
| UNH / UnitedHealth Group Incorporated | 0.00 | -1.32 | 0.26 | -2.25 | 0.0791 | -0.0028 | |||
| CPB / The Campbell's Company | 0.00 | 0.00 | 0.23 | -17.82 | 0.0685 | -0.0158 | |||
| WFC / Wells Fargo & Company | 0.01 | 16.22 | 0.22 | 8.82 | 0.0673 | 0.0047 | |||
| ESRX / Express Scripts Holding Co. | 0.00 | -100.00 | 0.00 | -100.00 | -0.0767 | ||||
| HSY / The Hershey Company | 0.00 | -100.00 | 0.00 | -100.00 | 0.0000 | ||||
| EMC / Global X Funds - Global X Emerging Markets Great Consumer ETF | 0.00 | -100.00 | 0.00 | -100.00 | -2.4055 |