Statistik Asas
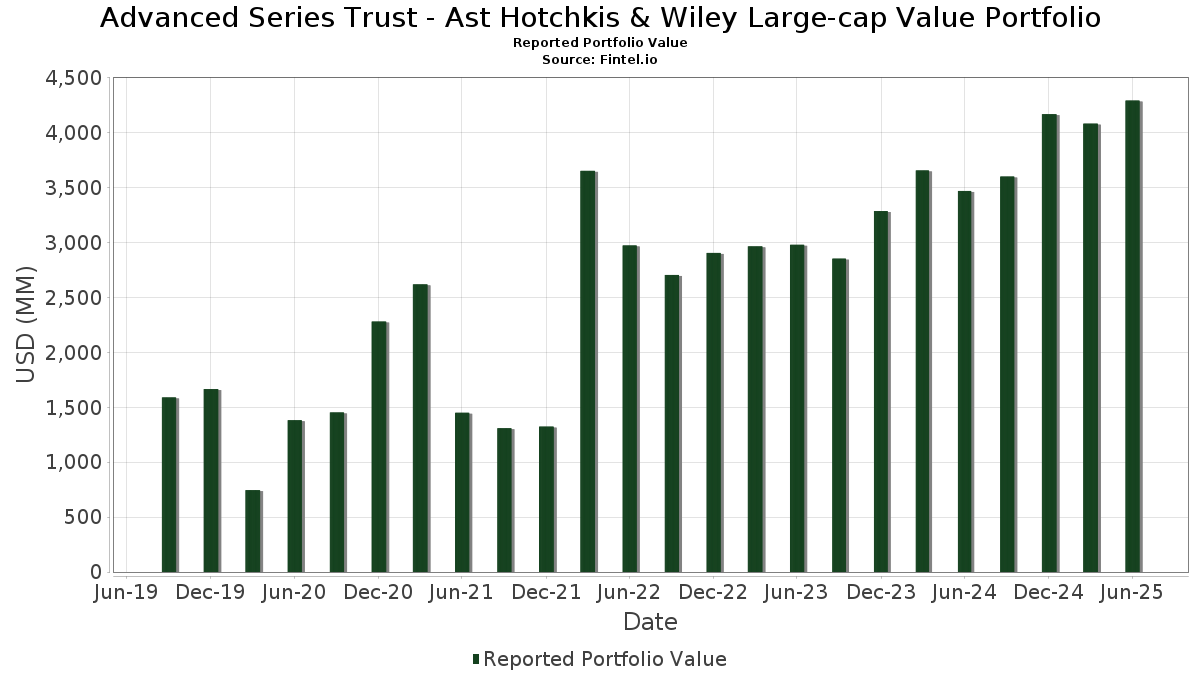
| Nilai Portfolio | $ 4,292,208,616 |
| Kedudukan Semasa | 387 |
Pegangan Terkini, Prestasi, AUM (dari 13F, 13D)
Advanced Series Trust - Ast Hotchkis & Wiley Large-cap Value Portfolio telah mendedahkan 387 jumlah pegangan dalam pemfailan SEC terkini mereka. Nilai portfolio terkini dikira sebagai $ 4,292,208,616 USD. Aset Sebenar Di Bawah Pengurusan (AUM) ialah nilai ini ditambah dengan tunai (yang tidak didedahkan). Pegangan teratas Advanced Series Trust - Ast Hotchkis & Wiley Large-cap Value Portfolio ialah JPMorgan Chase & Co. (US:JPM) , iShares Trust - iShares Russell 1000 Value ETF (US:IWD) , Bank of America Corporation (US:BAC) , Exxon Mobil Corporation (US:XOM) , and UnitedHealth Group Incorporated (US:UNH) . Kedudukan baharu Advanced Series Trust - Ast Hotchkis & Wiley Large-cap Value Portfolio termasuk Taiwan Semiconductor Manufacturing Company Limited - Depositary Receipt (Common Stock) (US:TSM) , Expand Energy Corporation (US:EXE) , Saia, Inc. (US:SAIA) , MGIC Investment Corporation (US:MTG) , and Jabil Inc. (US:JBL) .
Kenaikan Teratas Suku Tahun Ini
Kami menggunakan perubahan dalam peruntukan portfolio kerana ini adalah metrik yang paling bermakna. Perubahan boleh disebabkan oleh perdagangan atau perubahan dalam harga saham.
| Sekuriti | Saham (MM) |
Nilai (MM$) |
Portfolio % | ΔPortfolio % |
|---|---|---|---|---|
| 440.81 | 440.50 | 11.5180 | 11.5180 | |
| 65.12 | 65.12 | 1.7027 | 1.7027 | |
| 0.20 | 42.84 | 1.1200 | 1.0932 | |
| 0.27 | 47.30 | 1.2368 | 0.8631 | |
| 0.57 | 39.23 | 1.0259 | 0.5633 | |
| 0.02 | 16.44 | 0.4300 | 0.3681 | |
| 0.37 | 107.34 | 2.8068 | 0.3060 | |
| 0.19 | 27.43 | 0.7173 | 0.2936 | |
| 0.07 | 13.89 | 0.3633 | 0.2692 | |
| 0.41 | 28.12 | 0.7354 | 0.2617 |
Penurunan Teratas Suku Tahun Ini
Kami menggunakan perubahan dalam peruntukan portfolio kerana ini adalah metrik yang paling bermakna. Perubahan boleh disebabkan oleh perdagangan atau perubahan dalam harga saham.
| Sekuriti | Saham (MM) |
Nilai (MM$) |
Portfolio % | ΔPortfolio % |
|---|---|---|---|---|
| 0.02 | 2.55 | 0.0668 | -4.4400 | |
| 0.12 | 22.65 | 0.5923 | -0.6943 | |
| 0.19 | 59.00 | 1.5428 | -0.6112 | |
| 0.08 | 10.03 | 0.2623 | -0.5201 | |
| 0.04 | 4.19 | 0.1094 | -0.3534 | |
| 0.04 | 19.48 | 0.5094 | -0.3520 | |
| 0.08 | 41.01 | 1.0723 | -0.3356 | |
| 0.64 | 19.85 | 0.5191 | -0.2977 | |
| 0.41 | 37.24 | 0.9737 | -0.2846 | |
| 0.14 | 11.38 | 0.2974 | -0.2841 |
13F dan Pemfailan Dana
Borang ini telah difailkan pada 2025-08-27 untuk tempoh pelaporan 2025-06-30. Klik ikon pautan untuk melihat sejarah transaksi penuh.
Tingkatkan untuk membuka data premium dan eksport ke Excel ![]() .
.
| Sekuriti | Jenis | Purata Harga Saham | Saham (MM) |
ΔSaham (%) |
ΔSaham (%) |
Nilai ($MM) |
Portfolio (%) |
ΔPortfolio (%) |
|
|---|---|---|---|---|---|---|---|---|---|
| PGIM Institutional Money Market Fund - D / STIV (000000000) | 440.81 | 440.50 | 11.5180 | 11.5180 | |||||
| JPM / JPMorgan Chase & Co. | 0.37 | -4.04 | 107.34 | 13.41 | 2.8068 | 0.3060 | |||
| IWD / iShares Trust - iShares Russell 1000 Value ETF | 0.42 | -2.49 | 82.14 | 0.65 | 2.1479 | -0.0085 | |||
| BAC / Bank of America Corporation | 1.67 | -10.10 | 79.13 | 1.95 | 2.0689 | 0.0182 | |||
| XOM / Exxon Mobil Corporation | 0.63 | 3.40 | 67.45 | -6.28 | 1.7635 | -0.1379 | |||
| (PIPA070) PGIM Core Government Money Market Fund / STIV (000000000) | 65.12 | 65.12 | 1.7027 | 1.7027 | |||||
| UNH / UnitedHealth Group Incorporated | 0.19 | 21.51 | 59.00 | -27.62 | 1.5428 | -0.6112 | |||
| RTX / RTX Corporation | 0.38 | -6.43 | 55.59 | 3.15 | 1.4535 | 0.0296 | |||
| C / Citigroup Inc. | 0.65 | -7.35 | 55.24 | 11.09 | 1.4443 | 0.1305 | |||
| MCK / McKesson Corporation | 0.08 | -8.31 | 54.98 | -0.17 | 1.4375 | -0.0175 | |||
| COF / Capital One Financial Corporation | 0.25 | -10.22 | 53.33 | 6.54 | 1.3945 | 0.0718 | |||
| PM / Philip Morris International Inc. | 0.29 | -12.17 | 51.99 | 0.77 | 1.3594 | -0.0037 | |||
| SCHW / The Charles Schwab Corporation | 0.57 | -2.37 | 51.78 | 13.79 | 1.3540 | 0.1516 | |||
| GOOGL / Alphabet Inc. | 0.27 | 193.52 | 47.30 | 234.50 | 1.2368 | 0.8631 | |||
| CMCSA / Comcast Corporation | 1.32 | 3.89 | 46.94 | 0.49 | 1.2274 | -0.0069 | |||
| MSFT / Microsoft Corporation | 0.09 | -4.04 | 46.12 | 27.16 | 1.2060 | 0.2476 | |||
| AMZN / Amazon.com, Inc. | 0.20 | 3,559.76 | 42.84 | 4,120.20 | 1.1200 | 1.0932 | |||
| TMO / Thermo Fisher Scientific Inc. | 0.10 | 0.70 | 42.57 | -17.95 | 1.1131 | -0.2577 | |||
| BRK.B / Berkshire Hathaway Inc. | 0.08 | -15.62 | 41.01 | -23.03 | 1.0723 | -0.3356 | |||
| JNJ / Johnson & Johnson | 0.26 | 20.54 | 40.14 | 11.02 | 1.0496 | 0.0943 | |||
| SRE / Sempra | 0.52 | 0.00 | 39.52 | 6.18 | 1.0332 | 0.0499 | |||
| CSCO / Cisco Systems, Inc. | 0.57 | 99.31 | 39.23 | 124.08 | 1.0259 | 0.5633 | |||
| COP / ConocoPhillips | 0.41 | -8.49 | 37.24 | -21.80 | 0.9737 | -0.2846 | |||
| GM / General Motors Company | 0.75 | -0.65 | 37.15 | 3.96 | 0.9713 | 0.0271 | |||
| SPYV / SPDR Series Trust - SPDR Portfolio S&P 500 Value ETF | 0.68 | 0.00 | 35.77 | 2.49 | 0.9353 | 0.0131 | |||
| APD / Air Products and Chemicals, Inc. | 0.13 | 0.91 | 35.66 | -3.49 | 0.9324 | -0.0439 | |||
| WFC / Wells Fargo & Company | 0.43 | -8.83 | 34.09 | 1.76 | 0.8913 | 0.0061 | |||
| PG / The Procter & Gamble Company | 0.21 | 32.73 | 32.93 | 24.09 | 0.8609 | 0.1598 | |||
| MCHP / Microchip Technology Incorporated | 0.46 | 0.00 | 32.55 | 45.36 | 0.8510 | 0.2594 | |||
| KO / The Coca-Cola Company | 0.43 | -5.38 | 30.74 | -6.53 | 0.8038 | -0.0652 | |||
| CI / The Cigna Group | 0.09 | -17.02 | 30.32 | -16.62 | 0.7928 | -0.1680 | |||
| NOC / Northrop Grumman Corporation | 0.06 | -21.59 | 29.76 | -23.43 | 0.7782 | -0.2488 | |||
| DE / Deere & Company | 0.06 | 9.43 | 29.63 | 18.56 | 0.7748 | 0.1144 | |||
| WMT / Walmart Inc. | 0.30 | -32.60 | 28.91 | -24.93 | 0.7560 | -0.2616 | |||
| CVX / Chevron Corporation | 0.20 | -12.87 | 28.60 | -25.42 | 0.7478 | -0.2654 | |||
| AMT / American Tower Corporation | 0.13 | -1.08 | 28.46 | 0.48 | 0.7441 | -0.0042 | |||
| TRV / The Travelers Companies, Inc. | 0.11 | -12.88 | 28.26 | -11.87 | 0.7389 | -0.1083 | |||
| CVS / CVS Health Corporation | 0.41 | -11.81 | 28.18 | -10.21 | 0.7368 | -0.0924 | |||
| NEE / NextEra Energy, Inc. | 0.41 | 60.19 | 28.12 | 56.87 | 0.7354 | 0.2617 | |||
| AIG / American International Group, Inc. | 0.32 | -6.16 | 27.71 | -7.62 | 0.7245 | -0.0680 | |||
| AXP / American Express Company | 0.09 | 9.15 | 27.46 | 29.40 | 0.7181 | 0.1573 | |||
| STX / Seagate Technology Holdings plc | 0.19 | 0.69 | 27.43 | 71.08 | 0.7173 | 0.2936 | |||
| TMUS / T-Mobile US, Inc. | 0.11 | -4.04 | 27.17 | -14.28 | 0.7105 | -0.1270 | |||
| FDX / FedEx Corporation | 0.12 | -2.02 | 26.42 | -8.64 | 0.6907 | -0.0732 | |||
| INTC / Intel Corporation | 1.16 | 0.00 | 26.03 | -1.36 | 0.6807 | -0.0167 | |||
| LUV / Southwest Airlines Co. | 0.80 | 1.72 | 26.01 | -1.73 | 0.6801 | -0.0193 | |||
| PHM / PulteGroup, Inc. | 0.24 | -4.86 | 25.58 | -2.40 | 0.6689 | -0.0237 | |||
| FCX / Freeport-McMoRan Inc. | 0.59 | 20.52 | 25.45 | 38.00 | 0.6654 | 0.1782 | |||
| GS / The Goldman Sachs Group, Inc. | 0.03 | -0.29 | 24.71 | 29.19 | 0.6460 | 0.1407 | |||
| AZN / AstraZeneca PLC - Depositary Receipt (Common Stock) | 0.35 | 56.08 | 24.45 | 48.40 | 0.6394 | 0.2040 | |||
| BDX / Becton, Dickinson and Company | 0.14 | 3.21 | 24.35 | -22.38 | 0.6366 | -0.1922 | |||
| AVGO / Broadcom Inc. | 0.09 | 0.00 | 23.78 | 64.64 | 0.6218 | 0.2401 | |||
| CTVA / Corteva, Inc. | 0.32 | -4.97 | 23.65 | 12.54 | 0.6184 | 0.0632 | |||
| OTIS / Otis Worldwide Corporation | 0.24 | -2.54 | 23.51 | -6.49 | 0.6149 | -0.0496 | |||
| V / Visa Inc. | 0.07 | 0.00 | 23.45 | 1.31 | 0.6132 | 0.0016 | |||
| TYIA / Johnson Controls International plc | 0.22 | -6.56 | 23.21 | 23.20 | 0.6069 | 0.1091 | |||
| MLM / Martin Marietta Materials, Inc. | 0.04 | 0.00 | 22.99 | 14.81 | 0.6012 | 0.0721 | |||
| ABBV / AbbVie Inc. | 0.12 | -47.49 | 22.65 | -53.48 | 0.5923 | -0.6943 | |||
| ALL / The Allstate Corporation | 0.11 | -4.50 | 21.80 | -7.15 | 0.5701 | -0.0504 | |||
| USB / U.S. Bancorp | 0.47 | 0.00 | 21.30 | 7.18 | 0.5569 | 0.0318 | |||
| META / Meta Platforms, Inc. | 0.03 | 29.51 | 20.97 | 65.86 | 0.5482 | 0.2142 | |||
| XPO / XPO, Inc. | 0.16 | 0.00 | 20.79 | 17.39 | 0.5435 | 0.0757 | |||
| DIS / The Walt Disney Company | 0.17 | 17.53 | 20.54 | 47.67 | 0.5370 | 0.1695 | |||
| PH / Parker-Hannifin Corporation | 0.03 | 3.51 | 20.24 | 18.94 | 0.5293 | 0.0796 | |||
| EPD / Enterprise Products Partners L.P. - Limited Partnership | 0.64 | -29.30 | 19.85 | -35.78 | 0.5191 | -0.2977 | |||
| REGN / Regeneron Pharmaceuticals, Inc. | 0.04 | -27.81 | 19.48 | -40.24 | 0.5094 | -0.3520 | |||
| PNC / The PNC Financial Services Group, Inc. | 0.10 | -4.97 | 19.27 | 0.80 | 0.5037 | -0.0013 | |||
| VZ / Verizon Communications Inc. | 0.44 | -3.90 | 19.06 | -8.32 | 0.4983 | -0.0510 | |||
| SHW / The Sherwin-Williams Company | 0.06 | 0.00 | 19.00 | -1.67 | 0.4967 | -0.0137 | |||
| CRH / CRH plc | 0.21 | -5.04 | 18.93 | -0.91 | 0.4949 | -0.0098 | |||
| MSI / Motorola Solutions, Inc. | 0.04 | 0.00 | 18.87 | -3.96 | 0.4934 | -0.0258 | |||
| NRG / NRG Energy, Inc. | 0.12 | -41.50 | 18.81 | -1.60 | 0.4918 | -0.0132 | |||
| CME / CME Group Inc. | 0.07 | -10.59 | 18.38 | -7.11 | 0.4805 | -0.0422 | |||
| CSA / Accenture plc | 0.06 | -5.49 | 18.02 | -9.47 | 0.4713 | -0.0548 | |||
| MMC / Marsh & McLennan Companies, Inc. | 0.08 | 0.00 | 17.94 | -10.41 | 0.4691 | -0.0600 | |||
| PGR / The Progressive Corporation | 0.07 | 0.00 | 17.87 | -5.71 | 0.4672 | -0.0335 | |||
| WEC / WEC Energy Group, Inc. | 0.17 | 0.00 | 17.76 | -4.39 | 0.4644 | -0.0264 | |||
| HD / The Home Depot, Inc. | 0.05 | 0.00 | 17.31 | 0.04 | 0.4525 | -0.0046 | |||
| HON / Honeywell International Inc. | 0.07 | -5.38 | 17.21 | 4.06 | 0.4500 | 0.0130 | |||
| PPL / PPL Corporation | 0.50 | -10.08 | 17.11 | -15.61 | 0.4474 | -0.0883 | |||
| HLN / Haleon plc - Depositary Receipt (Common Stock) | 1.61 | 0.00 | 16.73 | 0.78 | 0.4375 | -0.0012 | |||
| BLK / BlackRock, Inc. | 0.02 | 533.98 | 16.44 | 602.99 | 0.4300 | 0.3681 | |||
| SAN / Santander UK plc - Preferred Stock | 0.17 | -5.38 | 16.40 | -17.27 | 0.4288 | -0.0949 | |||
| FFIV / F5, Inc. | 0.06 | -6.07 | 16.22 | 3.83 | 0.4240 | 0.0113 | |||
| IR / Ingersoll Rand Inc. | 0.19 | -4.64 | 16.07 | -0.88 | 0.4201 | -0.0082 | |||
| APO / Apollo Global Management, Inc. | 0.11 | -5.30 | 15.72 | -1.89 | 0.4110 | -0.0123 | |||
| VLO / Valero Energy Corporation | 0.12 | -6.16 | 15.67 | -4.49 | 0.4097 | -0.0238 | |||
| WDC / Western Digital Corporation | 0.24 | 23.42 | 15.67 | 95.35 | 0.4096 | 0.1977 | |||
| ORLY / O'Reilly Automotive, Inc. | 0.17 | 1,400.00 | 15.24 | -5.63 | 0.3985 | -0.0282 | |||
| HLT / Hilton Worldwide Holdings Inc. | 0.06 | -5.31 | 15.21 | 10.84 | 0.3977 | 0.0351 | |||
| ELV / Elevance Health, Inc. | 0.04 | -4.22 | 15.17 | -14.35 | 0.3967 | -0.0713 | |||
| MDT / Medtronic plc | 0.17 | 8.74 | 14.98 | 5.48 | 0.3918 | 0.0165 | |||
| STT / State Street Corporation | 0.14 | -5.88 | 14.80 | 11.79 | 0.3870 | 0.0372 | |||
| URI / United Rentals, Inc. | 0.02 | -2.79 | 14.69 | 16.87 | 0.3841 | 0.0520 | |||
| HUM / Humana Inc. | 0.06 | 11.32 | 14.67 | 2.85 | 0.3835 | 0.0067 | |||
| SHEL / Shell plc | 0.42 | 506.95 | 14.60 | 202.74 | 0.3816 | 0.2556 | |||
| EMR / Emerson Electric Co. | 0.11 | 55.08 | 14.57 | 88.59 | 0.3811 | 0.1769 | |||
| QCOM / QUALCOMM Incorporated | 0.09 | -28.13 | 14.38 | -25.49 | 0.3759 | -0.1339 | |||
| D / Dominion Energy, Inc. | 0.25 | 41.92 | 14.27 | 43.07 | 0.3732 | 0.1096 | |||
| BA / The Boeing Company | 0.07 | 217.57 | 13.89 | 290.25 | 0.3633 | 0.2692 | |||
| BALL / Ball Corporation | 0.24 | 2.00 | 13.71 | 9.87 | 0.3586 | 0.0288 | |||
| PPG / PPG Industries, Inc. | 0.12 | 25.11 | 13.49 | 30.14 | 0.3527 | 0.0788 | |||
| EIX / Edison International | 0.25 | -34.55 | 12.75 | -42.68 | 0.3333 | -0.2543 | |||
| CHTR / Charter Communications, Inc. | 0.03 | -0.33 | 12.63 | 10.57 | 0.3303 | 0.0284 | |||
| VLTO / Veralto Corporation | 0.12 | 0.00 | 12.42 | 3.60 | 0.3247 | 0.0080 | |||
| CRM / Salesforce, Inc. | 0.04 | 179.17 | 11.88 | 183.68 | 0.3105 | 0.1999 | |||
| FCNCA / First Citizens BancShares, Inc. | 0.01 | 5.29 | 11.84 | 11.10 | 0.3097 | 0.0280 | |||
| TGT / Target Corporation | 0.12 | -3.58 | 11.68 | -8.87 | 0.3054 | -0.0332 | |||
| BJ / BJ's Wholesale Club Holdings, Inc. | 0.11 | -14.47 | 11.43 | -19.17 | 0.2988 | -0.0747 | |||
| MRK / Merck & Co., Inc. | 0.14 | -41.39 | 11.38 | -48.31 | 0.2974 | -0.2841 | |||
| PLD / Prologis, Inc. | 0.11 | 573.11 | 11.21 | 569.75 | 0.2930 | 0.2515 | |||
| LIN / Linde plc | 0.02 | -19.01 | 10.91 | -18.39 | 0.2854 | -0.0680 | |||
| ORCL / Oracle Corporation | 0.05 | -44.03 | 10.74 | -12.48 | 0.2809 | -0.0434 | |||
| T / AT&T Inc. | 0.37 | -32.89 | 10.64 | -31.33 | 0.2781 | -0.1311 | |||
| ITW / Illinois Tool Works Inc. | 0.04 | 0.00 | 10.23 | -0.30 | 0.2676 | -0.0036 | |||
| DD / DuPont de Nemours, Inc. | 0.15 | -4.88 | 10.04 | -12.63 | 0.2624 | -0.0411 | |||
| PEP / PepsiCo, Inc. | 0.08 | -61.53 | 10.03 | -66.12 | 0.2623 | -0.5201 | |||
| OMC / Omnicom Group Inc. | 0.14 | 578.65 | 9.79 | 489.10 | 0.2559 | 0.2120 | |||
| CMI / Cummins Inc. | 0.03 | 6.44 | 9.74 | 11.21 | 0.2547 | 0.0233 | |||
| EQIX / Equinix, Inc. | 0.01 | 69.62 | 9.62 | 43.10 | 0.2515 | 0.0849 | |||
| CFG / Citizens Financial Group, Inc. | 0.21 | 78.67 | 9.51 | 95.18 | 0.2487 | 0.1199 | |||
| GEHC / GE HealthCare Technologies Inc. | 0.13 | 11.12 | 9.40 | 1.98 | 0.2457 | 0.0022 | |||
| TE Connectivity PLC / EC (IE000IVNQZ81) | 0.06 | -1.55 | 9.37 | 17.51 | 0.2451 | 0.0343 | |||
| SO / The Southern Company | 0.10 | 239.03 | 9.28 | 238.63 | 0.2425 | 0.1702 | |||
| VNO / Vornado Realty Trust | 0.24 | -5.38 | 9.15 | -2.18 | 0.2394 | -0.0079 | |||
| FIS / Fidelity National Information Services, Inc. | 0.11 | -36.99 | 9.14 | -31.31 | 0.2389 | -0.1126 | |||
| NVO / Novo Nordisk A/S - Depositary Receipt (Common Stock) | 0.13 | 0.00 | 9.09 | -0.61 | 0.2376 | -0.0040 | |||
| PCAR / PACCAR Inc | 0.09 | 13.58 | 8.82 | 10.88 | 0.2307 | 0.0205 | |||
| ERIC / Telefonaktiebolaget LM Ericsson (publ) - Depositary Receipt (Common Stock) | 1.03 | -13.25 | 8.74 | -5.21 | 0.2286 | -0.0151 | |||
| R1D / AerCap Holdings N.V. | 0.07 | 0.00 | 8.61 | 14.50 | 0.2250 | 0.0265 | |||
| CARR / Carrier Global Corporation | 0.11 | -18.10 | 8.37 | -5.45 | 0.2189 | -0.0150 | |||
| VNX / NXP Semiconductors N.V. | 0.04 | -39.79 | 8.35 | -36.71 | 0.2184 | -0.1088 | |||
| GLW / Corning Incorporated | 0.16 | 35.02 | 8.34 | 55.09 | 0.2182 | 0.0760 | |||
| EQT / EQT Corporation | 0.14 | 104.57 | 8.04 | 158.78 | 0.2101 | 0.1331 | |||
| HIG / The Hartford Insurance Group, Inc. | 0.06 | -1.10 | 7.99 | 1.41 | 0.2089 | 0.0007 | |||
| APA / APA Corporation | 0.43 | 0.00 | 7.82 | -12.98 | 0.2044 | -0.0330 | |||
| BKR / Baker Hughes Company | 0.20 | 20.28 | 7.57 | 4.93 | 0.1980 | 0.0073 | |||
| SBUX / Starbucks Corporation | 0.08 | 0.00 | 7.25 | -6.60 | 0.1896 | -0.0155 | |||
| AGCO / AGCO Corporation | 0.07 | 183.60 | 7.17 | 216.04 | 0.1875 | 0.1276 | |||
| FMC / FMC Corporation | 0.17 | 229.63 | 7.11 | 226.24 | 0.1860 | 0.1284 | |||
| NSC / Norfolk Southern Corporation | 0.03 | 0.00 | 6.93 | 8.06 | 0.1812 | 0.0118 | |||
| TSM / Taiwan Semiconductor Manufacturing Company Limited - Depositary Receipt (Common Stock) | 0.03 | 6.82 | 0.1784 | 0.1784 | |||||
| DGX / Quest Diagnostics Incorporated | 0.04 | 216.16 | 6.77 | 235.70 | 0.1771 | 0.1237 | |||
| CTSH / Cognizant Technology Solutions Corporation | 0.08 | 65.99 | 6.62 | 69.30 | 0.1732 | 0.0698 | |||
| HES / Hess Corporation | 0.05 | -8.21 | 6.48 | -20.38 | 0.1694 | -0.0456 | |||
| BMY / Bristol-Myers Squibb Company | 0.14 | -14.93 | 6.46 | -35.43 | 0.1690 | -0.0955 | |||
| MGA / Magna International Inc. | 0.16 | 0.00 | 6.25 | 13.59 | 0.1635 | 0.0181 | |||
| EOG / EOG Resources, Inc. | 0.05 | 79.52 | 6.21 | 67.43 | 0.1623 | 0.0643 | |||
| PFGC / Performance Food Group Company | 0.07 | -42.70 | 6.11 | -36.25 | 0.1597 | -0.0935 | |||
| KHC / The Kraft Heinz Company | 0.23 | 0.00 | 5.97 | -15.15 | 0.1560 | -0.0298 | |||
| AMP / Ameriprise Financial, Inc. | 0.01 | 73.17 | 5.90 | 90.93 | 0.1542 | 0.0726 | |||
| MS / Morgan Stanley | 0.04 | 0.00 | 5.87 | 20.72 | 0.1536 | 0.0250 | |||
| LH / Labcorp Holdings Inc. | 0.02 | 27.87 | 5.83 | 44.22 | 0.1524 | 0.0456 | |||
| SLB / Schlumberger Limited | 0.17 | 49.64 | 5.65 | 20.99 | 0.1479 | 0.0244 | |||
| RSK / Arch Capital Group Ltd. | 0.06 | -17.21 | 5.58 | -21.63 | 0.1459 | -0.0422 | |||
| CPAY / Corpay, Inc. | 0.02 | -43.21 | 5.57 | -45.97 | 0.1457 | -0.1268 | |||
| NOV / NOV Inc. | 0.45 | 0.00 | 5.54 | -18.32 | 0.1448 | -0.0344 | |||
| 1JL / Gates Industrial Corporation plc | 0.23 | -11.17 | 5.39 | 11.13 | 0.1409 | 0.0128 | |||
| EMN / Eastman Chemical Company | 0.07 | -5.38 | 5.38 | -19.83 | 0.1408 | -0.0366 | |||
| US21871X1090 / Corebridge Financial, Inc. | 0.15 | 0.00 | 5.31 | 12.45 | 0.1389 | 0.0141 | |||
| EXE / Expand Energy Corporation | 0.04 | 5.17 | 0.1352 | 0.1352 | |||||
| GD / General Dynamics Corporation | 0.02 | 0.00 | 5.11 | 7.00 | 0.1335 | 0.0074 | |||
| ABT / Abbott Laboratories | 0.04 | -29.13 | 5.02 | -27.34 | 0.1312 | -0.0513 | |||
| PFE / Pfizer Inc. | 0.21 | 0.00 | 4.98 | -4.34 | 0.1301 | -0.0073 | |||
| 37C / CNH Industrial N.V. | 0.38 | 0.00 | 4.95 | 5.54 | 0.1295 | 0.0055 | |||
| KTB / Kontoor Brands, Inc. | 0.07 | 160.56 | 4.87 | 168.06 | 0.1273 | 0.0793 | |||
| SHEL / Shell plc | 0.07 | -24.40 | 4.82 | -27.36 | 0.1261 | -0.0493 | |||
| MU / Micron Technology, Inc. | 0.04 | 0.00 | 4.73 | 41.85 | 0.1238 | 0.0356 | |||
| KR / The Kroger Co. | 0.07 | -14.50 | 4.73 | -9.39 | 0.1237 | -0.0143 | |||
| SNX / TD SYNNEX Corporation | 0.03 | 11.96 | 4.54 | 46.13 | 0.1186 | 0.0366 | |||
| MDLZ / Mondelez International, Inc. | 0.07 | -46.92 | 4.50 | -47.24 | 0.1178 | -0.1078 | |||
| STZ / Constellation Brands, Inc. | 0.03 | 1.32 | 4.45 | -10.19 | 0.1164 | -0.0146 | |||
| NEM / Newmont Corporation | 0.08 | 0.00 | 4.44 | 20.67 | 0.1162 | 0.0189 | |||
| F / Ford Motor Company | 0.41 | 0.00 | 4.41 | 8.16 | 0.1154 | 0.0076 | |||
| HCA / HCA Healthcare, Inc. | 0.01 | 0.00 | 4.41 | 10.87 | 0.1153 | 0.0102 | |||
| ELS / Equity LifeStyle Properties, Inc. | 0.07 | 0.00 | 4.37 | -7.54 | 0.1141 | -0.0106 | |||
| MET / MetLife, Inc. | 0.05 | 0.00 | 4.34 | 0.16 | 0.1135 | -0.0010 | |||
| FHN / First Horizon Corporation | 0.20 | 28.86 | 4.22 | 40.67 | 0.1104 | 0.0311 | |||
| GIS / General Mills, Inc. | 0.08 | 0.00 | 4.19 | -13.34 | 0.1096 | -0.0182 | |||
| UPS / United Parcel Service, Inc. | 0.04 | -64.36 | 4.19 | -73.62 | 0.1094 | -0.3534 | |||
| MHK / Mohawk Industries, Inc. | 0.04 | -25.72 | 4.18 | -31.79 | 0.1093 | -0.0526 | |||
| TXT / Textron Inc. | 0.05 | 0.00 | 4.17 | 11.13 | 0.1091 | 0.0099 | |||
| KVUE / Kenvue Inc. | 0.20 | 0.00 | 4.14 | -12.73 | 0.1082 | -0.0171 | |||
| WPP / WPP plc - Depositary Receipt (Common Stock) | 0.12 | 50.78 | 4.14 | 39.06 | 0.1082 | 0.0296 | |||
| TFC / Truist Financial Corporation | 0.10 | -46.05 | 4.09 | -43.64 | 0.1070 | -0.0848 | |||
| DHI / D.R. Horton, Inc. | 0.03 | -40.35 | 4.00 | -39.52 | 0.1046 | -0.0702 | |||
| LULU / lululemon athletica inc. | 0.02 | -3.45 | 3.99 | -18.96 | 0.1044 | -0.0258 | |||
| MMM / 3M Company | 0.03 | 47.56 | 3.97 | 52.95 | 0.1038 | 0.0352 | |||
| AMD / Advanced Micro Devices, Inc. | 0.03 | 0.00 | 3.97 | 38.09 | 0.1037 | 0.0278 | |||
| SWK / Stanley Black & Decker, Inc. | 0.06 | 17.68 | 3.83 | 3.71 | 0.1002 | 0.0026 | |||
| SAIA / Saia, Inc. | 0.01 | 3.83 | 0.1001 | 0.1001 | |||||
| ON / ON Semiconductor Corporation | 0.07 | 178.96 | 3.80 | 259.60 | 0.0994 | 0.0714 | |||
| CB / Chubb Limited | 0.01 | -57.05 | 3.79 | -58.80 | 0.0992 | -0.1441 | |||
| CCL / Carnival Corporation & plc | 0.13 | 60.15 | 3.74 | 130.66 | 0.0978 | 0.0549 | |||
| OVV / Ovintiv Inc. | 0.10 | 0.00 | 3.71 | -11.11 | 0.0969 | -0.0132 | |||
| WBD / Warner Bros. Discovery, Inc. | 0.32 | 0.00 | 3.70 | 6.81 | 0.0969 | 0.0052 | |||
| HII / Huntington Ingalls Industries, Inc. | 0.01 | 0.00 | 3.57 | 18.36 | 0.0934 | 0.0136 | |||
| OSCR / Oscar Health, Inc. | 0.17 | -49.80 | 3.55 | -17.91 | 0.0929 | -0.0215 | |||
| BK / The Bank of New York Mellon Corporation | 0.04 | -55.80 | 3.47 | -51.98 | 0.0908 | -0.1003 | |||
| Aptiv PLC / EC (JE00BTDN8H13) | 0.05 | 0.00 | 3.46 | 14.67 | 0.0906 | 0.0107 | |||
| MTG / MGIC Investment Corporation | 0.12 | 3.42 | 0.0894 | 0.0894 | |||||
| DAL / Delta Air Lines, Inc. | 0.07 | -48.14 | 3.40 | -41.50 | 0.0890 | -0.0647 | |||
| OLN / Olin Corporation | 0.16 | 0.00 | 3.31 | -17.13 | 0.0866 | -0.0190 | |||
| SNDK / Sandisk Corporation | 0.07 | 762.23 | 3.31 | 721.34 | 0.0866 | 0.0759 | |||
| CSX / CSX Corporation | 0.10 | 0.00 | 3.23 | 10.87 | 0.0846 | 0.0075 | |||
| ALGN / Align Technology, Inc. | 0.02 | 554.04 | 3.22 | 679.42 | 0.0842 | 0.0733 | |||
| WCC / WESCO International, Inc. | 0.02 | 78.72 | 3.18 | 113.14 | 0.0832 | 0.0437 | |||
| RJF / Raymond James Financial, Inc. | 0.02 | 0.00 | 3.13 | 10.41 | 0.0818 | 0.0069 | |||
| GSK / GSK plc - Depositary Receipt (Common Stock) | 0.08 | 0.00 | 3.12 | -0.89 | 0.0817 | -0.0016 | |||
| AOS / Amdocs Limited | 0.03 | 0.00 | 3.04 | -0.30 | 0.0795 | -0.0011 | |||
| MPC / Marathon Petroleum Corporation | 0.02 | 0.00 | 3.04 | 13.99 | 0.0795 | 0.0090 | |||
| CBRE / CBRE Group, Inc. | 0.02 | -10.78 | 3.03 | -4.38 | 0.0793 | -0.0045 | |||
| EEFT / Euronet Worldwide, Inc. | 0.03 | -16.25 | 3.03 | -20.54 | 0.0792 | -0.0215 | |||
| ZBH / Zimmer Biomet Holdings, Inc. | 0.03 | -57.70 | 3.02 | -65.91 | 0.0789 | -0.1549 | |||
| IQV / IQVIA Holdings Inc. | 0.02 | 92.18 | 2.97 | 71.86 | 0.0776 | 0.0320 | |||
| EBAY / eBay Inc. | 0.04 | 0.00 | 2.96 | 9.91 | 0.0774 | 0.0063 | |||
| JBL / Jabil Inc. | 0.01 | 2.90 | 0.0757 | 0.0757 | |||||
| UL / Unilever PLC - Depositary Receipt (Common Stock) | 0.05 | -26.89 | 2.88 | -24.90 | 0.0752 | -0.0260 | |||
| VMC / Vulcan Materials Company | 0.01 | -5.76 | 2.88 | 5.35 | 0.0752 | 0.0031 | |||
| AME / AMETEK, Inc. | 0.02 | 0.00 | 2.83 | 5.12 | 0.0741 | 0.0029 | |||
| SLGN / Silgan Holdings Inc. | 0.05 | -28.49 | 2.82 | -24.22 | 0.0737 | -0.0246 | |||
| FANG / Diamondback Energy, Inc. | 0.02 | 0.00 | 2.82 | -14.07 | 0.0736 | -0.0129 | |||
| UAL / United Airlines Holdings, Inc. | 0.04 | 0.00 | 2.80 | 15.35 | 0.0731 | 0.0090 | |||
| WEX / WEX Inc. | 0.02 | 2.78 | 0.0728 | 0.0728 | |||||
| AA / Alcoa Corporation | 0.09 | -6.43 | 2.67 | -9.45 | 0.0699 | -0.0081 | |||
| CMA / Comerica Incorporated | 0.04 | 0.00 | 2.65 | 0.99 | 0.0693 | -0.0000 | |||
| OKE / ONEOK, Inc. | 0.03 | 0.00 | 2.63 | -17.72 | 0.0687 | -0.0157 | |||
| WMB / The Williams Companies, Inc. | 0.04 | 0.00 | 2.61 | 5.11 | 0.0683 | 0.0026 | |||
| SYF / Synchrony Financial | 0.04 | 0.00 | 2.59 | 26.07 | 0.0677 | 0.0134 | |||
| KDP / Keurig Dr Pepper Inc. | 0.08 | -14.99 | 2.58 | -17.87 | 0.0674 | -0.0155 | |||
| AXTA / Axalta Coating Systems Ltd. | 0.09 | -19.29 | 2.56 | -27.75 | 0.0669 | -0.0267 | |||
| HSY / The Hershey Company | 0.02 | -99.65 | 2.55 | -95.69 | 0.0668 | -4.4400 | |||
| ALLY / Ally Financial Inc. | 0.06 | 2.52 | 0.0658 | 0.0658 | |||||
| AMH / American Homes 4 Rent | 0.07 | -46.34 | 2.50 | -48.81 | 0.0654 | -0.0637 | |||
| NTRS / Northern Trust Corporation | 0.02 | 0.00 | 2.49 | 28.55 | 0.0651 | 0.0139 | |||
| DOW / Dow Inc. | 0.09 | 138.64 | 2.49 | 81.02 | 0.0651 | 0.0287 | |||
| AMRZ / Amrize AG | 0.05 | 2.46 | 0.0643 | 0.0643 | |||||
| EW / Edwards Lifesciences Corporation | 0.03 | -20.24 | 2.44 | -13.94 | 0.0638 | -0.0111 | |||
| WAB / Westinghouse Air Brake Technologies Corporation | 0.01 | 0.00 | 2.44 | 15.44 | 0.0638 | 0.0079 | |||
| LRCX / Lam Research Corporation | 0.02 | 2.36 | 0.0617 | 0.0617 | |||||
| DHR / Danaher Corporation | 0.01 | 0.00 | 2.32 | -3.66 | 0.0606 | -0.0029 | |||
| FITB / Fifth Third Bancorp | 0.06 | -8.46 | 2.28 | -3.96 | 0.0596 | -0.0031 | |||
| HWM / Howmet Aerospace Inc. | 0.01 | 2.23 | 0.0584 | 0.0584 | |||||
| LDOS / Leidos Holdings, Inc. | 0.01 | 0.00 | 2.22 | 16.90 | 0.0581 | 0.0079 | |||
| KMI / Kinder Morgan, Inc. | 0.08 | 0.00 | 2.22 | 3.07 | 0.0580 | 0.0011 | |||
| RRC / Range Resources Corporation | 0.05 | 2.22 | 0.0579 | 0.0579 | |||||
| OXY / Occidental Petroleum Corporation | 0.05 | 0.00 | 2.21 | -14.91 | 0.0578 | -0.0108 | |||
| IP / International Paper Company | 0.05 | 84.15 | 2.20 | 61.69 | 0.0575 | 0.0216 | |||
| ADI / Analog Devices, Inc. | 0.01 | 0.00 | 2.19 | 18.01 | 0.0573 | 0.0082 | |||
| FI / Fiserv, Inc. | 0.01 | 3.49 | 2.17 | -19.20 | 0.0567 | -0.0142 | |||
| STLD / Steel Dynamics, Inc. | 0.02 | -60.91 | 2.11 | -59.99 | 0.0553 | -0.0844 | |||
| MIDD / The Middleby Corporation | 0.01 | 2.11 | 0.0551 | 0.0551 | |||||
| Z / Zillow Group, Inc. | 0.03 | -16.01 | 2.02 | -14.19 | 0.0528 | -0.0094 | |||
| AFL / Aflac Incorporated | 0.02 | 0.00 | 1.94 | -5.14 | 0.0507 | -0.0033 | |||
| CASY / Casey's General Stores, Inc. | 0.00 | 0.00 | 1.94 | 17.56 | 0.0506 | 0.0071 | |||
| KEYS / Keysight Technologies, Inc. | 0.01 | 0.00 | 1.92 | 9.40 | 0.0503 | 0.0038 | |||
| WRB / W. R. Berkley Corporation | 0.03 | 0.00 | 1.92 | 3.23 | 0.0501 | 0.0011 | |||
| PSX / Phillips 66 | 0.02 | 0.00 | 1.86 | -3.37 | 0.0487 | -0.0022 | |||
| LEN / Lennar Corporation | 0.02 | -5.12 | 1.85 | -8.57 | 0.0483 | -0.0051 | |||
| HPE / Hewlett Packard Enterprise Company | 0.09 | -70.94 | 1.84 | -61.49 | 0.0480 | -0.0780 | |||
| USFD / US Foods Holding Corp. | 0.02 | 0.00 | 1.84 | 17.69 | 0.0480 | 0.0068 | |||
| FSLR / First Solar, Inc. | 0.01 | 0.00 | 1.82 | 31.01 | 0.0476 | 0.0109 | |||
| DOV / Dover Corporation | 0.01 | 0.00 | 1.81 | 4.27 | 0.0473 | 0.0015 | |||
| MKL / Markel Group Inc. | 0.00 | 0.00 | 1.78 | 6.86 | 0.0465 | 0.0025 | |||
| SSNC / SS&C Technologies Holdings, Inc. | 0.02 | 0.00 | 1.77 | -0.90 | 0.0462 | -0.0009 | |||
| SNA / Snap-on Incorporated | 0.01 | 0.00 | 1.76 | -7.64 | 0.0461 | -0.0044 | |||
| NUE / Nucor Corporation | 0.01 | 0.00 | 1.74 | 7.63 | 0.0454 | 0.0028 | |||
| LHX / L3Harris Technologies, Inc. | 0.01 | 0.00 | 1.73 | 19.81 | 0.0453 | 0.0071 | |||
| PKG / Packaging Corporation of America | 0.01 | 0.00 | 1.72 | -4.81 | 0.0450 | -0.0028 | |||
| CC / The Chemours Company | 0.15 | -50.54 | 1.69 | -58.14 | 0.0442 | -0.0625 | |||
| FXI / Flex Ltd. | 0.03 | 0.00 | 1.68 | 51.03 | 0.0440 | 0.0145 | |||
| TRU / TransUnion | 0.02 | -42.23 | 1.68 | -38.75 | 0.0439 | -0.0285 | |||
| STE / STERIS plc | 0.01 | 0.00 | 1.61 | 6.01 | 0.0420 | 0.0020 | |||
| PARA / Paramount Global | 0.12 | 0.00 | 1.60 | 7.87 | 0.0420 | 0.0026 | |||
| ROST / Ross Stores, Inc. | 0.01 | 1.58 | 0.0413 | 0.0413 | |||||
| Smurfit WestRock PLC / EC (IE00028FXN24) | 0.04 | -6.20 | 1.54 | -10.14 | 0.0403 | -0.0050 | |||
| FTI / TechnipFMC plc | 0.04 | 0.00 | 1.54 | 8.70 | 0.0402 | 0.0028 | |||
| AMCR / Amcor plc | 0.16 | 0.00 | 1.46 | -5.27 | 0.0381 | -0.0025 | |||
| CF / CF Industries Holdings, Inc. | 0.02 | 0.00 | 1.45 | 17.65 | 0.0380 | 0.0054 | |||
| TPR / Tapestry, Inc. | 0.02 | 0.00 | 1.43 | 24.74 | 0.0375 | 0.0071 | |||
| BLDR / Builders FirstSource, Inc. | 0.01 | 0.00 | 1.42 | -6.58 | 0.0371 | -0.0030 | |||
| RS / Reliance, Inc. | 0.00 | 0.00 | 1.42 | 8.73 | 0.0371 | 0.0026 | |||
| GEY / Garmin Ltd. | 0.01 | 0.00 | 1.42 | -3.86 | 0.0371 | -0.0019 | |||
| CAG / Conagra Brands, Inc. | 0.07 | 0.00 | 1.38 | -23.23 | 0.0360 | -0.0114 | |||
| DG / Dollar General Corporation | 0.01 | 0.00 | 1.34 | 30.16 | 0.0350 | 0.0078 | |||
| FOXA / Fox Corporation | 0.02 | 0.00 | 1.33 | -1.04 | 0.0348 | -0.0007 | |||
| MUR / Murphy Oil Corporation | 0.06 | 0.00 | 1.31 | -20.76 | 0.0343 | -0.0095 | |||
| XYL / Xylem Inc. | 0.01 | -12.53 | 1.31 | -5.35 | 0.0342 | -0.0023 | |||
| MKC / McCormick & Company, Incorporated | 0.02 | 0.00 | 1.30 | -7.93 | 0.0340 | -0.0033 | |||
| OC / Owens Corning | 0.01 | 0.00 | 1.28 | -3.77 | 0.0334 | -0.0017 | |||
| TTWO / Take-Two Interactive Software, Inc. | 0.01 | -14.67 | 1.28 | -0.08 | 0.0334 | -0.0004 | |||
| FOX / Fox Corporation | 0.02 | 0.00 | 1.26 | -2.10 | 0.0329 | -0.0010 | |||
| ICE / Intercontinental Exchange, Inc. | 0.01 | -29.58 | 1.23 | -25.14 | 0.0323 | -0.0113 | |||
| PNR / Pentair plc | 0.01 | 0.00 | 1.23 | 17.35 | 0.0322 | 0.0045 | |||
| ROP / Roper Technologies, Inc. | 0.00 | -12.00 | 1.23 | -15.41 | 0.0322 | -0.0063 | |||
| XYZ / Block, Inc. | 0.02 | -38.85 | 1.22 | -23.58 | 0.0320 | -0.0103 | |||
| SNY / Sanofi - Depositary Receipt (Common Stock) | 0.03 | 0.00 | 1.22 | -12.90 | 0.0318 | -0.0051 | |||
| DLTR / Dollar Tree, Inc. | 0.01 | 0.00 | 1.14 | 31.87 | 0.0298 | 0.0070 | |||
| MTB / M&T Bank Corporation | 0.01 | 0.00 | 1.13 | 8.59 | 0.0294 | 0.0020 | |||
| HOLX / Hologic, Inc. | 0.02 | 0.00 | 1.10 | 5.56 | 0.0288 | 0.0012 | |||
| LYB / LyondellBasell Industries N.V. | 0.02 | 0.00 | 1.08 | -17.80 | 0.0281 | -0.0065 | |||
| L / Loews Corporation | 0.01 | -17.81 | 1.05 | -18.03 | 0.0274 | -0.0064 | |||
| CLH / Clean Harbors, Inc. | 0.00 | 0.00 | 1.05 | 17.28 | 0.0273 | 0.0038 | |||
| United States Treasury Bill / DBT (US912797QP55) | 1.03 | 0.0270 | 0.0270 | ||||||
| CTRA / Coterra Energy Inc. | 0.04 | 0.00 | 1.03 | -12.24 | 0.0270 | -0.0041 | |||
| FNF / Fidelity National Financial, Inc. | 0.02 | 0.00 | 1.03 | -13.87 | 0.0268 | -0.0046 | |||
| HAL / Halliburton Company | 0.05 | 0.00 | 1.00 | -19.71 | 0.0262 | -0.0068 | |||
| GOOG / Alphabet Inc. | 0.01 | -51.45 | 0.98 | -17.20 | 0.0257 | -0.0170 | |||
| UNM / Unum Group | 0.01 | 0.00 | 0.96 | -0.93 | 0.0251 | -0.0005 | |||
| CW / Curtiss-Wright Corporation | 0.00 | 0.00 | 0.96 | 54.09 | 0.0251 | 0.0086 | |||
| GPC / Genuine Parts Company | 0.01 | 0.00 | 0.93 | 1.85 | 0.0244 | 0.0002 | |||
| RRJ / RenaissanceRe Holdings Ltd. | 0.00 | 0.00 | 0.92 | 1.21 | 0.0241 | 0.0000 | |||
| IEX / IDEX Corporation | 0.01 | 0.00 | 0.91 | -2.99 | 0.0237 | -0.0010 | |||
| MOH / Molina Healthcare, Inc. | 0.00 | 0.00 | 0.89 | -9.62 | 0.0234 | -0.0027 | |||
| PYPL / PayPal Holdings, Inc. | 0.01 | 0.00 | 0.87 | 13.95 | 0.0229 | 0.0026 | |||
| TOL / Toll Brothers, Inc. | 0.01 | -55.29 | 0.87 | -51.70 | 0.0227 | -0.0248 | |||
| UTHR / United Therapeutics Corporation | 0.00 | 0.00 | 0.87 | -6.77 | 0.0227 | -0.0019 | |||
| THC / Tenet Healthcare Corporation | 0.00 | 0.00 | 0.85 | 30.92 | 0.0223 | 0.0051 | |||
| HBAN / Huntington Bancshares Incorporated | 0.05 | 0.00 | 0.84 | 11.66 | 0.0220 | 0.0021 | |||
| ENTG / Entegris, Inc. | 0.01 | 0.00 | 0.82 | -7.75 | 0.0215 | -0.0021 | |||
| TDY / Teledyne Technologies Incorporated | 0.00 | 0.00 | 0.82 | 3.02 | 0.0214 | 0.0004 | |||
| JBHT / J.B. Hunt Transport Services, Inc. | 0.01 | 0.00 | 0.80 | -2.90 | 0.0210 | -0.0009 | |||
| FWONK / Formula One Group | 0.01 | 0.00 | 0.78 | 15.99 | 0.0203 | 0.0026 | |||
| CINF / Cincinnati Financial Corporation | 0.01 | 0.00 | 0.78 | 0.91 | 0.0203 | -0.0000 | |||
| RF / Regions Financial Corporation | 0.03 | 0.00 | 0.74 | 8.21 | 0.0193 | 0.0013 | |||
| CPB / The Campbell's Company | 0.02 | 0.00 | 0.73 | -23.22 | 0.0192 | -0.0061 | |||
| GPN / Global Payments Inc. | 0.01 | 0.00 | 0.71 | -18.25 | 0.0186 | -0.0044 | |||
| HRL / Hormel Foods Corporation | 0.02 | -37.89 | 0.70 | -39.32 | 0.0183 | -0.0122 | |||
| ZM / Zoom Communications Inc. | 0.01 | 0.00 | 0.69 | 5.80 | 0.0181 | 0.0008 | |||
| BIIB / Biogen Inc. | 0.01 | 0.00 | 0.68 | -8.13 | 0.0177 | -0.0018 | |||
| SOFI / SoFi Technologies, Inc. | 0.04 | 0.00 | 0.66 | 56.64 | 0.0173 | 0.0061 | |||
| TWLO / Twilio Inc. | 0.01 | 0.00 | 0.66 | 27.22 | 0.0172 | 0.0035 | |||
| AKAM / Akamai Technologies, Inc. | 0.01 | 0.00 | 0.65 | -0.92 | 0.0169 | -0.0003 | |||
| IFF / International Flavors & Fragrances Inc. | 0.01 | 0.00 | 0.64 | -5.31 | 0.0168 | -0.0011 | |||
| FTV / Fortive Corporation | 0.01 | 0.00 | 0.63 | -28.83 | 0.0166 | -0.0069 | |||
| PFG / Principal Financial Group, Inc. | 0.01 | 0.00 | 0.63 | -5.86 | 0.0164 | -0.0012 | |||
| TRMB / Trimble Inc. | 0.01 | 0.00 | 0.62 | 15.77 | 0.0163 | 0.0021 | |||
| KEY / KeyCorp | 0.03 | 0.00 | 0.60 | 8.86 | 0.0158 | 0.0011 | |||
| CSGP / CoStar Group, Inc. | 0.01 | 0.00 | 0.59 | 1.37 | 0.0156 | 0.0001 | |||
| J / Jacobs Solutions Inc. | 0.00 | 0.00 | 0.59 | 8.64 | 0.0155 | 0.0011 | |||
| TSN / Tyson Foods, Inc. | 0.01 | 0.00 | 0.58 | -12.37 | 0.0152 | -0.0023 | |||
| NDSN / Nordson Corporation | 0.00 | 0.00 | 0.58 | 6.24 | 0.0152 | 0.0007 | |||
| NWSA / News Corporation | 0.02 | -25.71 | 0.55 | -18.89 | 0.0145 | -0.0036 | |||
| OKTA / Okta, Inc. | 0.01 | 0.00 | 0.55 | -5.02 | 0.0144 | -0.0009 | |||
| EA / Electronic Arts Inc. | 0.00 | 105.56 | 0.54 | 127.20 | 0.0142 | 0.0079 | |||
| RPRX / Royalty Pharma plc | 0.01 | 0.00 | 0.54 | 15.77 | 0.0140 | 0.0018 | |||
| BAX / Baxter International Inc. | 0.02 | 0.00 | 0.53 | -11.58 | 0.0138 | -0.0020 | |||
| CNC / Centene Corporation | 0.01 | 0.00 | 0.50 | -10.57 | 0.0131 | -0.0017 | |||
| ADM / Archer-Daniels-Midland Company | 0.01 | 0.00 | 0.48 | 10.09 | 0.0126 | 0.0010 | |||
| COO / The Cooper Companies, Inc. | 0.01 | 0.00 | 0.48 | -15.55 | 0.0125 | -0.0025 | |||
| ERE / Everest Group, Ltd. | 0.00 | 0.00 | 0.48 | -6.50 | 0.0124 | -0.0010 | |||
| COHR / Coherent Corp. | 0.01 | 0.00 | 0.46 | 37.39 | 0.0121 | 0.0032 | |||
| MRVL / Marvell Technology, Inc. | 0.01 | 0.46 | 0.0121 | 0.0121 | |||||
| SWKS / Skyworks Solutions, Inc. | 0.01 | 0.00 | 0.44 | 15.22 | 0.0115 | 0.0014 | |||
| EWBC / East West Bancorp, Inc. | 0.00 | 0.00 | 0.43 | 12.70 | 0.0111 | 0.0011 | |||
| FLUT / Flutter Entertainment plc | 0.00 | 0.40 | 0.0104 | 0.0104 | |||||
| RVTY / Revvity, Inc. | 0.00 | 0.00 | 0.40 | -8.56 | 0.0103 | -0.0011 | |||
| JEF / Jefferies Financial Group Inc. | 0.01 | -81.64 | 0.39 | -81.27 | 0.0102 | -0.0446 | |||
| EL / The Estée Lauder Companies Inc. | 0.00 | 0.00 | 0.34 | 22.58 | 0.0089 | 0.0016 | |||
| AVTR / Avantor, Inc. | 0.02 | 0.00 | 0.33 | -16.83 | 0.0087 | -0.0019 | |||
| INCY / Incyte Corporation | 0.00 | 0.00 | 0.31 | 12.50 | 0.0080 | 0.0008 | |||
| PWR / Quanta Services, Inc. | 0.00 | 0.00 | 0.30 | 48.77 | 0.0079 | 0.0025 | |||
| NWS / News Corporation | 0.01 | 0.00 | 0.30 | 13.11 | 0.0079 | 0.0008 | |||
| RGA / Reinsurance Group of America, Incorporated | 0.00 | 0.00 | 0.29 | 0.69 | 0.0076 | -0.0000 | |||
| VTRS / Viatris Inc. | 0.03 | 0.00 | 0.28 | 2.58 | 0.0073 | 0.0001 | |||
| United States Treasury Bill / DBT (US912797MS31) | 0.25 | 0.0065 | 0.0065 | ||||||
| WLK / Westlake Corporation | 0.00 | 0.00 | 0.24 | -24.37 | 0.0064 | -0.0021 | |||
| GFS / GLOBALFOUNDRIES Inc. | 0.01 | 0.00 | 0.23 | 3.56 | 0.0061 | 0.0001 | |||
| MRNA / Moderna, Inc. | 0.01 | 0.00 | 0.20 | -2.39 | 0.0053 | -0.0002 | |||
| IJF / ICON Public Limited Company | 0.00 | 0.00 | 0.20 | -16.80 | 0.0053 | -0.0011 | |||
| RAL / Ralliant Corporation | 0.00 | 0.20 | 0.0051 | 0.0051 | |||||
| H / Hyatt Hotels Corporation | 0.00 | 0.00 | 0.16 | 13.87 | 0.0041 | 0.0005 | |||
| EPAM / EPAM Systems, Inc. | 0.00 | 0.00 | 0.14 | 4.55 | 0.0036 | 0.0001 | |||
| ZG / Zillow Group, Inc. | 0.00 | 0.00 | 0.14 | 2.26 | 0.0036 | 0.0000 | |||
| A / Agilent Technologies, Inc. | 0.00 | 0.11 | 0.0029 | 0.0029 | |||||
| LENB / Lennar Corp. - Class B | 0.00 | 0.00 | 0.11 | -3.67 | 0.0028 | -0.0001 | |||
| MKC.V / McCormick & Company, Incorporated | 0.00 | 0.00 | 0.09 | -8.16 | 0.0024 | -0.0002 | |||
| NVR / NVR, Inc. | 0.00 | 0.08 | 0.0021 | 0.0021 | |||||
| MRP / Millrose Properties, Inc. | 0.00 | 0.00 | 0.08 | 6.76 | 0.0021 | 0.0001 | |||
| FWONA / Formula One Group | 0.00 | 0.00 | 0.08 | 15.38 | 0.0020 | 0.0003 | |||
| MBLY / Mobileye Global Inc. | 0.00 | 0.00 | 0.07 | 24.53 | 0.0017 | 0.0003 | |||
| United States Treasury Bill / DBT (US912797QS94) | 0.02 | 0.0005 | 0.0005 | ||||||
| USD/EUR FORWARD / DFE (000000000) | 0.02 | 0.0004 | 0.0004 | ||||||
| AMTM / Amentum Holdings, Inc. | 0.00 | 0.01 | 0.0002 | 0.0002 | |||||
| USD/GBP FORWARD / DFE (000000000) | -0.03 | -0.0008 | -0.0008 | ||||||
| USD/GBP FORWARD / DFE (000000000) | -0.44 | -0.0115 | -0.0115 | ||||||
| EUR/USD FORWARD / DFE (000000000) | -0.51 | -0.0132 | -0.0132 |