Statistik Asas
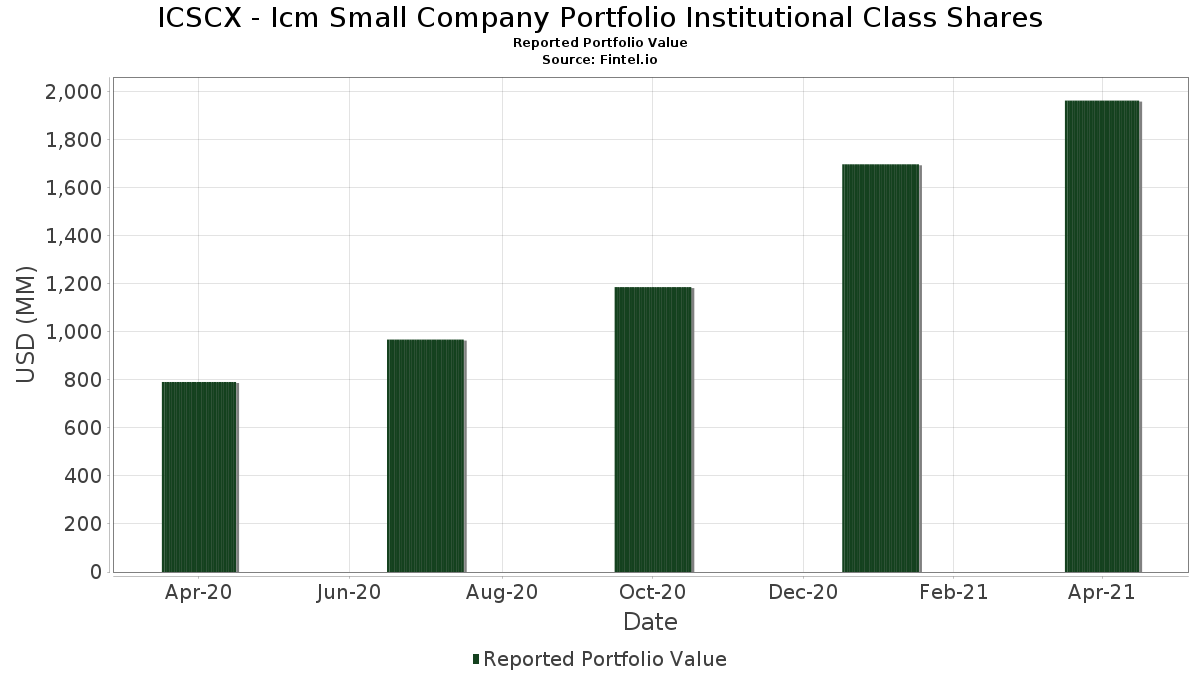
| Nilai Portfolio | $ 1,963,326,310 |
| Kedudukan Semasa | 108 |
Pegangan Terkini, Prestasi, AUM (dari 13F, 13D)
ICSCX - Icm Small Company Portfolio Institutional Class Shares telah mendedahkan 108 jumlah pegangan dalam pemfailan SEC terkini mereka. Nilai portfolio terkini dikira sebagai $ 1,963,326,310 USD. Aset Sebenar Di Bawah Pengurusan (AUM) ialah nilai ini ditambah dengan tunai (yang tidak didedahkan). Pegangan teratas ICSCX - Icm Small Company Portfolio Institutional Class Shares ialah Dreyfus Treasury Securities Cash Management - Dreyfus Treasury Securities Cash Management Institutional Shares (US:DIRXX) , Designer Brands Inc. (US:DBI) , Tri Pointe Homes, Inc. (US:TPH) , Lantheus Holdings, Inc. (US:LNTH) , and Regal-Beloit Corp. (US:US7587501039) . Kedudukan baharu ICSCX - Icm Small Company Portfolio Institutional Class Shares termasuk Dreyfus Treasury Securities Cash Management - Dreyfus Treasury Securities Cash Management Institutional Shares (US:DIRXX) , Cal-Maine Foods, Inc. (US:CALM) , Great Lakes Dredge & Dock Corporation (US:GLDD) , Cognyte Software Ltd. (US:CGNT) , and Hanger Inc (US:HNGR) .
Kenaikan Teratas Suku Tahun Ini
Kami menggunakan perubahan dalam peruntukan portfolio kerana ini adalah metrik yang paling bermakna. Perubahan boleh disebabkan oleh perdagangan atau perubahan dalam harga saham.
| Sekuriti | Saham (MM) |
Nilai (MM$) |
Portfolio % | ΔPortfolio % |
|---|---|---|---|---|
| 0.51 | 19.19 | 0.9778 | 0.9778 | |
| 1.17 | 18.31 | 0.9327 | 0.9327 | |
| 0.07 | 12.33 | 0.6280 | 0.6126 | |
| 0.44 | 11.60 | 0.5909 | 0.5909 | |
| 1.03 | 27.07 | 1.3790 | 0.4402 | |
| 0.33 | 8.16 | 0.4159 | 0.4159 | |
| 0.51 | 28.81 | 1.4677 | 0.3881 | |
| 1.99 | 35.30 | 1.7988 | 0.3394 | |
| 1.00 | 24.02 | 1.2236 | 0.3258 | |
| 0.20 | 6.12 | 0.3118 | 0.3118 |
Penurunan Teratas Suku Tahun Ini
Kami menggunakan perubahan dalam peruntukan portfolio kerana ini adalah metrik yang paling bermakna. Perubahan boleh disebabkan oleh perdagangan atau perubahan dalam harga saham.
| Sekuriti | Saham (MM) |
Nilai (MM$) |
Portfolio % | ΔPortfolio % |
|---|---|---|---|---|
| 0.44 | 21.56 | 1.0984 | -0.8587 | |
| 0.00 | 0.00 | -0.7269 | ||
| 0.13 | 6.21 | 0.3163 | -0.6043 | |
| 0.21 | 17.95 | 0.9146 | -0.4785 | |
| 0.28 | 16.37 | 0.8342 | -0.3684 | |
| 0.13 | 17.83 | 0.9085 | -0.2976 | |
| 0.78 | 13.24 | 0.6747 | -0.2755 | |
| 0.26 | 11.94 | 0.6085 | -0.1634 | |
| 0.52 | 22.30 | 1.1362 | -0.1619 | |
| 0.63 | 17.72 | 0.9030 | -0.1432 |
13F dan Pemfailan Dana
Borang ini telah difailkan pada 2021-06-28 untuk tempoh pelaporan 2021-04-30. Klik ikon pautan untuk melihat sejarah transaksi penuh.
Tingkatkan untuk membuka data premium dan eksport ke Excel ![]() .
.
| Sekuriti | Jenis | Purata Harga Saham | Saham (MM) |
ΔSaham (%) |
ΔSaham (%) |
Nilai ($MM) |
Portfolio (%) |
ΔPortfolio (%) |
|
|---|---|---|---|---|---|---|---|---|---|
| DIRXX / Dreyfus Treasury Securities Cash Management - Dreyfus Treasury Securities Cash Management Institutional Shares | 36.94 | 19.42 | 1.8821 | 0.0610 | |||||
| DBI / Designer Brands Inc. | 1.99 | -1.43 | 35.30 | 42.42 | 1.7988 | 0.3394 | |||
| TPH / Tri Pointe Homes, Inc. | 1.38 | -1.43 | 32.81 | 16.24 | 1.6718 | 0.0099 | |||
| LNTH / Lantheus Holdings, Inc. | 1.27 | -1.43 | 30.07 | 43.58 | 1.5321 | 0.2992 | |||
| US7587501039 / Regal-Beloit Corp. | 0.20 | -1.45 | 29.40 | 13.43 | 1.4981 | -0.0280 | |||
| KLIC / Kulicke and Soffa Industries, Inc. | 0.51 | -1.44 | 28.81 | 57.09 | 1.4677 | 0.3881 | |||
| GPI / Group 1 Automotive, Inc. | 0.17 | -1.41 | 28.72 | 17.60 | 1.4630 | 0.0256 | |||
| STL / Sterling Bancorp. | 1.13 | -1.43 | 28.51 | 34.18 | 1.4525 | 0.2017 | |||
| OXM / Oxford Industries, Inc. | 0.31 | -1.42 | 28.50 | 37.85 | 1.4521 | 0.2349 | |||
| MTDR / Matador Resources Company | 1.03 | -1.43 | 27.07 | 69.73 | 1.3790 | 0.4402 | |||
| TCBI / Texas Capital Bancshares, Inc. | 0.38 | 12.03 | 26.33 | 27.67 | 1.3413 | 0.1274 | |||
| PNFP / Pinnacle Financial Partners, Inc. | 0.30 | -1.42 | 26.15 | 26.07 | 1.3322 | 0.1112 | |||
| JW.A / John Wiley & Sons Inc. - Class A | 0.45 | -1.44 | 25.35 | 23.04 | 1.2914 | 0.0787 | |||
| KRG / Kite Realty Group Trust | 1.20 | -1.43 | 24.95 | 28.69 | 1.2712 | 0.1298 | |||
| CNOB / ConnectOne Bancorp, Inc. | 0.89 | -1.44 | 24.23 | 25.93 | 1.2346 | 0.1018 | |||
| US4989042001 / Knoll Inc | 1.00 | -1.43 | 24.02 | 57.47 | 1.2236 | 0.3258 | |||
| QTS / Qts Realty Trust Inc - Class A | 0.35 | 45.26 | 23.23 | 48.37 | 1.1836 | 0.2618 | |||
| MEI / Methode Electronics, Inc. | 0.52 | -1.43 | 23.17 | 17.31 | 1.1804 | 0.0178 | |||
| ARGO / Argo Group International Holdings, Inc. | 0.44 | -1.43 | 23.07 | 27.47 | 1.1756 | 0.1100 | |||
| CBZ / CBIZ, Inc. | 0.69 | -1.44 | 23.01 | 27.78 | 1.1725 | 0.1122 | |||
| DLX / Deluxe Corporation | 0.52 | -1.42 | 22.85 | 28.04 | 1.1643 | 0.1136 | |||
| PPBI / Pacific Premier Bancorp, Inc. | 0.52 | -1.43 | 22.76 | 30.53 | 1.1598 | 0.1331 | |||
| PRAA / PRA Group, Inc. | 0.60 | -1.43 | 22.56 | 12.65 | 1.1496 | -0.0296 | |||
| GEF.B / Greif, Inc. | 0.37 | -1.44 | 22.44 | 32.07 | 1.1433 | 0.1430 | |||
| BDC / Belden Inc. | 0.52 | 10.39 | 22.30 | 1.13 | 1.1362 | -0.1619 | |||
| CNDT / Conduent Incorporated | 3.27 | 12.42 | 22.21 | 58.60 | 1.1316 | 0.3072 | |||
| URBN / Urban Outfitters, Inc. | 0.61 | -1.44 | 21.93 | 29.00 | 1.1171 | 0.1165 | |||
| ABCB / Ameris Bancorp | 0.40 | -1.44 | 21.86 | 36.31 | 1.1136 | 0.1696 | |||
| OEC / Orion S.A. | 1.10 | 1.66 | 21.80 | 32.57 | 1.1108 | 0.1426 | |||
| THS / TreeHouse Foods, Inc. | 0.45 | -1.43 | 21.64 | 11.10 | 1.1027 | -0.0441 | |||
| MTX / Minerals Technologies Inc. | 0.28 | -1.42 | 21.64 | 24.98 | 1.1025 | 0.0832 | |||
| SMP / Standard Motor Products, Inc. | 0.50 | 37.37 | 21.60 | 49.97 | 1.1005 | 0.2526 | |||
| VRNT / Verint Systems Inc. | 0.44 | -1.42 | 21.56 | -35.15 | 1.0984 | -0.8587 | |||
| WGO / Winnebago Industries, Inc. | 0.27 | -1.43 | 21.55 | 14.12 | 1.0981 | -0.0138 | |||
| PRGS / Progress Software Corporation | 0.49 | -1.42 | 21.47 | 7.11 | 1.0937 | -0.0861 | |||
| MTG / MGIC Investment Corporation | 1.40 | -1.43 | 21.39 | 28.17 | 1.0898 | 0.1073 | |||
| SFNC / Simmons First National Corporation | 0.74 | -1.43 | 21.08 | 13.74 | 1.0739 | -0.0171 | |||
| SBCF / Seacoast Banking Corporation of Florida | 0.58 | -1.43 | 21.05 | 17.67 | 1.0727 | 0.0193 | |||
| VBTX / Veritex Holdings, Inc. | 0.61 | -1.43 | 20.73 | 30.27 | 1.0562 | 0.1194 | |||
| ICFI / ICF International, Inc. | 0.22 | -1.43 | 20.09 | 16.37 | 1.0233 | 0.0073 | |||
| KAMN / Kaman Corporation | 0.37 | 46.19 | 19.95 | 54.87 | 1.0166 | 0.2581 | |||
| NTGR / NETGEAR, Inc. | 0.54 | 28.41 | 19.92 | 15.44 | 1.0150 | -0.0009 | |||
| BANC / Banc of California, Inc. | 1.11 | -1.43 | 19.81 | 4.71 | 1.0095 | -0.1045 | |||
| HUBG / Hub Group, Inc. | 0.30 | -1.45 | 19.70 | 23.06 | 1.0037 | 0.0613 | |||
| MTRN / Materion Corporation | 0.27 | 39.49 | 19.39 | 44.84 | 0.9881 | 0.1999 | |||
| KN / Knowles Corporation | 0.93 | -1.44 | 19.36 | 6.79 | 0.9865 | -0.0809 | |||
| WERN / Werner Enterprises, Inc. | 0.42 | -1.44 | 19.30 | 16.12 | 0.9832 | 0.0048 | |||
| UMH / UMH Properties, Inc. | 0.89 | -1.43 | 19.23 | 44.37 | 0.9797 | 0.1955 | |||
| CALM / Cal-Maine Foods, Inc. | 0.51 | 19.19 | 0.9778 | 0.9778 | |||||
| KAR / OPENLANE, Inc. | 1.27 | 37.20 | 19.09 | 11.41 | 0.9729 | -0.0362 | |||
| CENTA / Central Garden & Pet Company | 0.38 | -1.43 | 18.74 | 24.54 | 0.9550 | 0.0689 | |||
| AIN / Albany International Corp. | 0.21 | 17.01 | 18.54 | 50.19 | 0.9448 | 0.2180 | |||
| UEIC / Universal Electronics Inc. | 0.33 | -1.43 | 18.48 | 3.32 | 0.9416 | -0.1115 | |||
| EPC / Edgewell Personal Care Company | 0.48 | -1.43 | 18.43 | 12.74 | 0.9390 | -0.0234 | |||
| CODI / Compass Diversified | 0.72 | -1.43 | 18.42 | 21.73 | 0.9384 | 0.0477 | |||
| CSGS / CSG Systems International, Inc. | 0.40 | 19.19 | 18.40 | 27.21 | 0.9376 | 0.0860 | |||
| ABM / ABM Industries Incorporated | 0.36 | -1.44 | 18.34 | 37.92 | 0.9345 | 0.1516 | |||
| GLDD / Great Lakes Dredge & Dock Corporation | 1.17 | 18.31 | 0.9327 | 0.9327 | |||||
| EAF / GrafTech International Ltd. | 1.43 | -1.43 | 18.15 | 29.26 | 0.9247 | 0.0981 | |||
| ENSG / The Ensign Group, Inc. | 0.21 | -30.83 | 17.95 | -24.14 | 0.9146 | -0.4785 | |||
| MODV / ModivCare Inc. | 0.13 | -1.47 | 17.83 | -12.96 | 0.9085 | -0.2976 | |||
| NTCT / NetScout Systems, Inc. | 0.68 | 54.60 | 17.81 | 38.52 | 0.9073 | 0.1505 | |||
| GVA / Granite Construction Incorporated | 0.47 | -1.44 | 17.79 | 26.82 | 0.9065 | 0.0806 | |||
| TSEM / Tower Semiconductor Ltd. | 0.63 | -1.43 | 17.72 | -0.27 | 0.9030 | -0.1432 | |||
| NUVA / Nuvasive Inc | 0.25 | -1.43 | 17.72 | 31.06 | 0.9029 | 0.1068 | |||
| FBMS / The First Bancshares, Inc. | 0.45 | -1.42 | 17.63 | 28.80 | 0.8982 | 0.0924 | |||
| NWE / NorthWestern Energy Group, Inc. | 0.26 | -1.45 | 17.61 | 23.09 | 0.8970 | 0.0549 | |||
| SASR / Sandy Spring Bancorp, Inc. | 0.38 | -1.42 | 17.28 | 34.56 | 0.8803 | 0.1244 | |||
| SR / Spire Inc. | 0.23 | -1.42 | 17.21 | 21.38 | 0.8768 | 0.0421 | |||
| EFSC / Enterprise Financial Services Corp | 0.35 | -1.42 | 17.00 | 37.15 | 0.8660 | 0.1364 | |||
| FBNC / First Bancorp | 0.40 | -1.44 | 16.85 | 22.70 | 0.8583 | 0.0500 | |||
| FRME / First Merchants Corporation | 0.36 | -1.43 | 16.56 | 20.92 | 0.8439 | 0.0375 | |||
| SXI / Standex International Corporation | 0.17 | -1.43 | 16.39 | 14.12 | 0.8352 | -0.0105 | |||
| MDC / M.D.C. Holdings, Inc. | 0.28 | -28.92 | 16.37 | -19.85 | 0.8342 | -0.3684 | |||
| HSC / Enviri Corp | 0.90 | 24.09 | 16.21 | 33.79 | 0.8260 | 0.1126 | |||
| SP / SP Plus Corporation | 0.47 | 10.95 | 16.18 | 31.34 | 0.8242 | 0.0991 | |||
| AUB / Atlantic Union Bankshares Corporation | 0.41 | -1.42 | 15.81 | 16.07 | 0.8054 | 0.0037 | |||
| DOC / Healthpeak Properties, Inc. | 0.83 | -1.43 | 15.61 | 4.72 | 0.7955 | -0.0823 | |||
| BHE / Benchmark Electronics, Inc. | 0.50 | -1.43 | 14.87 | 16.81 | 0.7579 | 0.0082 | |||
| CTT / CatchMark Timber Trust Inc - Class A | 1.23 | -1.43 | 14.35 | 25.70 | 0.7312 | 0.0590 | |||
| ESRT / Empire State Realty Trust, Inc. | 1.24 | -1.43 | 14.13 | 13.86 | 0.7198 | -0.0106 | |||
| EPAC / Enerpac Tool Group Corp. | 0.52 | -1.43 | 13.93 | 29.35 | 0.7096 | 0.0757 | |||
| DY / Dycom Industries, Inc. | 0.14 | -1.43 | 13.59 | 13.96 | 0.6924 | -0.0096 | |||
| BDN / Brandywine Realty Trust | 0.99 | -1.43 | 13.33 | 21.24 | 0.6791 | 0.0319 | |||
| LOCO / El Pollo Loco Holdings, Inc. | 0.78 | -1.44 | 13.24 | -17.95 | 0.6747 | -0.2755 | |||
| ASTE / Astec Industries, Inc. | 0.17 | -1.41 | 13.07 | 24.35 | 0.6657 | 0.0471 | |||
| FCPT / Four Corners Property Trust, Inc. | 0.45 | -1.44 | 13.04 | 7.95 | 0.6643 | -0.0468 | |||
| MWA / Mueller Water Products, Inc. | 0.86 | -1.43 | 12.35 | 18.05 | 0.6293 | 0.0133 | |||
| CBRL / Cracker Barrel Old Country Store, Inc. | 0.07 | 3,711.44 | 12.33 | 4,622.22 | 0.6280 | 0.6126 | |||
| TCBK / TriCo Bancshares | 0.26 | -26.59 | 11.94 | -8.92 | 0.6085 | -0.1634 | |||
| CGNT / Cognyte Software Ltd. | 0.44 | 11.60 | 0.5909 | 0.5909 | |||||
| PEB / Pebblebrook Hotel Trust | 0.47 | -1.43 | 11.19 | 28.06 | 0.5699 | 0.0557 | |||
| DRQ / Dril-Quip, Inc. | 0.36 | -1.42 | 11.07 | 0.32 | 0.5639 | -0.0856 | |||
| SHO / Sunstone Hotel Investors, Inc. | 0.79 | -1.43 | 10.42 | 21.23 | 0.5309 | 0.0249 | |||
| XPRO / Expro Group Holdings N.V. | 3.18 | -1.43 | 10.33 | 15.24 | 0.5264 | -0.0014 | |||
| IDA / IDACORP, Inc. | 0.10 | -1.43 | 9.89 | 14.40 | 0.5037 | -0.0051 | |||
| ITGR / Integer Holdings Corporation | 0.10 | -1.48 | 9.39 | 25.34 | 0.4786 | 0.0374 | |||
| HNGR / Hanger Inc | 0.33 | 8.16 | 0.4159 | 0.4159 | |||||
| ROIC / Retail Opportunity Investments Corp. | 0.41 | -1.44 | 7.25 | 23.11 | 0.3692 | 0.0227 | |||
| KALU / Kaiser Aluminum Corporation | 0.06 | -1.41 | 6.76 | 37.00 | 0.3443 | 0.0539 | |||
| LNDC / Landec Corp. | 0.57 | -1.44 | 6.44 | 4.66 | 0.3281 | -0.0341 | |||
| RUSHA / Rush Enterprises, Inc. | 0.13 | -66.23 | 6.21 | -60.30 | 0.3163 | -0.6043 | |||
| AUDC / AudioCodes Ltd. | 0.20 | 6.12 | 0.3118 | 0.3118 | |||||
| ANIP / ANI Pharmaceuticals, Inc. | 0.18 | -1.46 | 5.84 | 14.90 | 0.2978 | -0.0017 | |||
| ESTE / Earthstone Energy Inc - Class A | 0.82 | -1.44 | 5.73 | 34.61 | 0.2921 | 0.0414 | |||
| MYE / Myers Industries, Inc. | 0.15 | 3.44 | 0.1754 | 0.1754 | |||||
| DCOM / Dime Community Bancshares, Inc. | 0.08 | 2.55 | 0.1299 | 0.1299 | |||||
| FUL / H.B. Fuller Company | 0.03 | 2,412.89 | 2.32 | 3,211.43 | 0.1181 | 0.1140 | |||
| US7153471005 / Perspecta Inc | 0.00 | -100.00 | 0.00 | -100.00 | -0.7269 |