Statistik Asas
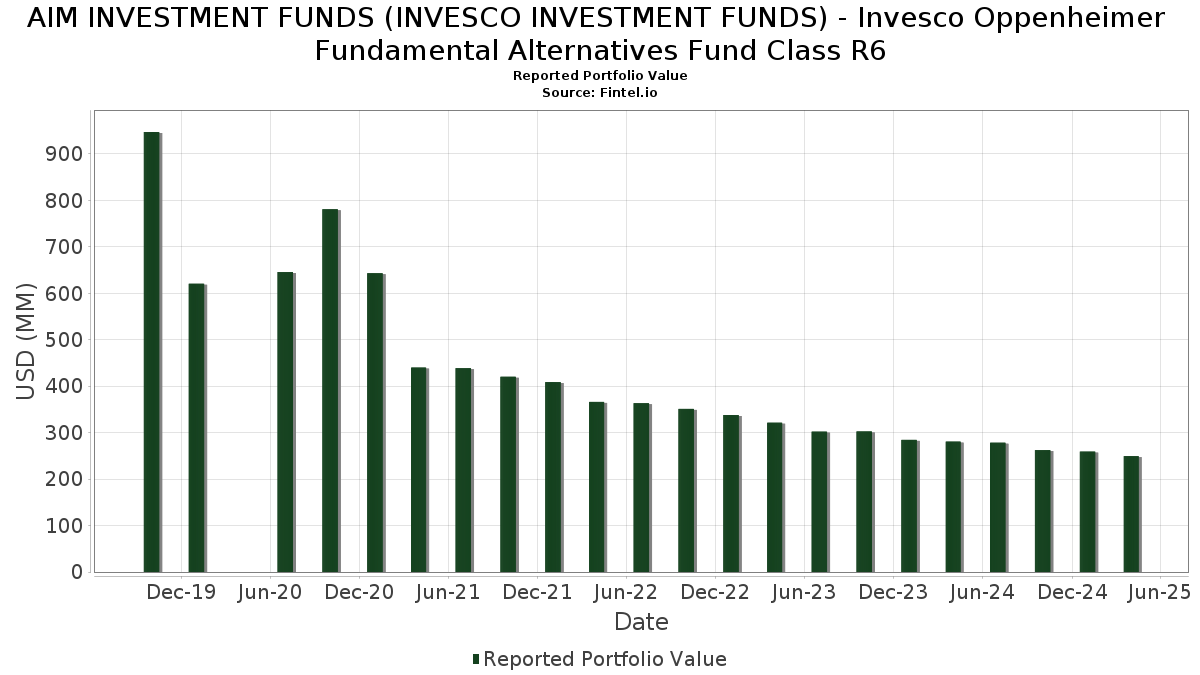
| Nilai Portfolio | $ 249,503,035 |
| Kedudukan Semasa | 233 |
Pegangan Terkini, Prestasi, AUM (dari 13F, 13D)
AIM INVESTMENT FUNDS (INVESCO INVESTMENT FUNDS) - Invesco Oppenheimer Fundamental Alternatives Fund Class R6 telah mendedahkan 233 jumlah pegangan dalam pemfailan SEC terkini mereka. Nilai portfolio terkini dikira sebagai $ 249,503,035 USD. Aset Sebenar Di Bawah Pengurusan (AUM) ialah nilai ini ditambah dengan tunai (yang tidak didedahkan). Pegangan teratas AIM INVESTMENT FUNDS (INVESCO INVESTMENT FUNDS) - Invesco Oppenheimer Fundamental Alternatives Fund Class R6 ialah Invesco Actively Managed Exchange-Traded Fund Trust - Invesco Managed Futures Strategy ETF (US:IMF) , Invesco Treasury Portfolio, Institutional Class (US:US8252524066) , Apple Inc. (US:AAPL) , NVIDIA Corporation (US:NVDA) , and Microsoft Corporation (US:MSFT) . Kedudukan baharu AIM INVESTMENT FUNDS (INVESCO INVESTMENT FUNDS) - Invesco Oppenheimer Fundamental Alternatives Fund Class R6 termasuk Invesco Actively Managed Exchange-Traded Fund Trust - Invesco Managed Futures Strategy ETF (US:IMF) , Labcorp Holdings Inc. (US:LH) , Ralph Lauren Corporation (US:RL) , Ingredion Incorporated (US:INGR) , and Evergy, Inc. (US:EVRG) .
Kenaikan Teratas Suku Tahun Ini
Kami menggunakan perubahan dalam peruntukan portfolio kerana ini adalah metrik yang paling bermakna. Perubahan boleh disebabkan oleh perdagangan atau perubahan dalam harga saham.
| Sekuriti | Saham (MM) |
Nilai (MM$) |
Portfolio % | ΔPortfolio % |
|---|---|---|---|---|
| 2.98 | 129.57 | 44.4365 | 44.4365 | |
| 1.59 | 1.59 | 0.5442 | 0.5442 | |
| 1.49 | 0.5108 | 0.5108 | ||
| 0.01 | 0.99 | 0.3384 | 0.2856 | |
| 0.00 | 1.26 | 0.4314 | 0.2643 | |
| 0.60 | 0.60 | 0.2071 | 0.2071 | |
| 0.60 | 0.60 | 0.2071 | 0.2071 | |
| 0.59 | 0.2026 | 0.2026 | ||
| 0.53 | 0.1816 | 0.1816 | ||
| 0.00 | 0.47 | 0.1617 | 0.1617 |
Penurunan Teratas Suku Tahun Ini
Kami menggunakan perubahan dalam peruntukan portfolio kerana ini adalah metrik yang paling bermakna. Perubahan boleh disebabkan oleh perdagangan atau perubahan dalam harga saham.
| Sekuriti | Saham (MM) |
Nilai (MM$) |
Portfolio % | ΔPortfolio % |
|---|---|---|---|---|
| 17.37 | 17.37 | 5.9584 | -19.3343 | |
| 0.00 | 0.38 | 0.1294 | -0.4233 | |
| 0.00 | 0.36 | 0.1231 | -0.2688 | |
| -0.72 | -0.2475 | -0.2475 | ||
| 0.00 | 0.13 | 0.0443 | -0.2243 | |
| 0.00 | 1.01 | 0.3478 | -0.2014 | |
| 0.01 | 1.29 | 0.4435 | -0.2013 | |
| -0.53 | -0.1825 | -0.1825 | ||
| 0.00 | 0.94 | 0.3224 | -0.1731 | |
| -0.44 | -0.1521 | -0.1521 |
13F dan Pemfailan Dana
Borang ini telah difailkan pada 2025-06-30 untuk tempoh pelaporan 2025-04-30. Klik ikon pautan untuk melihat sejarah transaksi penuh.
Tingkatkan untuk membuka data premium dan eksport ke Excel ![]() .
.
| Sekuriti | Jenis | Purata Harga Saham | Saham (MM) |
ΔSaham (%) |
ΔSaham (%) |
Nilai ($MM) |
Portfolio (%) |
ΔPortfolio (%) |
|
|---|---|---|---|---|---|---|---|---|---|
| IMF / Invesco Actively Managed Exchange-Traded Fund Trust - Invesco Managed Futures Strategy ETF | 2.98 | 129.57 | 44.4365 | 44.4365 | |||||
| US8252524066 / Invesco Treasury Portfolio, Institutional Class | 17.37 | -76.83 | 17.37 | -76.83 | 5.9584 | -19.3343 | |||
| AAPL / Apple Inc. | 0.02 | 2.71 | 3.44 | -7.50 | 1.1801 | -0.0750 | |||
| NVDA / NVIDIA Corporation | 0.02 | -2.87 | 2.46 | -11.88 | 0.8447 | -0.0983 | |||
| MSFT / Microsoft Corporation | 0.01 | -9.08 | 2.37 | -13.43 | 0.8113 | -0.1104 | |||
| WMT / Walmart Inc. | 0.02 | -19.19 | 1.68 | -19.92 | 0.5762 | -0.1317 | |||
| DUK / Duke Energy Corporation | 0.01 | -2.93 | 1.68 | 5.79 | 0.5762 | 0.0403 | |||
| BRK.B / Berkshire Hathaway Inc. | 0.00 | -13.56 | 1.66 | -1.66 | 0.5699 | -0.0001 | |||
| Invesco Private Prime Fund / STIV (N/A) | 1.59 | 1.59 | 0.5442 | 0.5442 | |||||
| GILD / Gilead Sciences, Inc. | 0.01 | -9.74 | 1.56 | -1.08 | 0.5349 | 0.0031 | |||
| E-Mini S&P 500 Index Future / DE (N/A) | 1.49 | 0.5108 | 0.5108 | ||||||
| GOOGL / Alphabet Inc. | 0.01 | 5.81 | 1.44 | -17.64 | 0.4950 | -0.0962 | |||
| JNJ / Johnson & Johnson | 0.01 | -18.76 | 1.38 | -16.58 | 0.4732 | -0.0845 | |||
| MO / Altria Group, Inc. | 0.02 | -7.01 | 1.37 | 5.29 | 0.4714 | 0.0311 | |||
| AMZN / Amazon.com, Inc. | 0.01 | -12.81 | 1.29 | -32.34 | 0.4435 | -0.2013 | |||
| VRSN / VeriSign, Inc. | 0.00 | 93.53 | 1.26 | 153.94 | 0.4314 | 0.2643 | |||
| BKNG / Booking Holdings Inc. | 0.00 | -0.43 | 1.19 | 7.22 | 0.4075 | 0.0335 | |||
| TJX / The TJX Companies, Inc. | 0.01 | 5.45 | 1.18 | 8.75 | 0.4053 | 0.0387 | |||
| AVGO / Broadcom Inc. | 0.01 | 18.80 | 1.17 | 3.37 | 0.4000 | 0.0193 | |||
| KMB / Kimberly-Clark Corporation | 0.01 | 13.02 | 1.17 | 14.55 | 0.3999 | 0.0566 | |||
| GS / The Goldman Sachs Group, Inc. | 0.00 | 38.57 | 1.15 | 18.47 | 0.3940 | 0.0669 | |||
| CL / Colgate-Palmolive Company | 0.01 | -9.06 | 1.14 | -3.31 | 0.3910 | -0.0067 | |||
| BMY / Bristol-Myers Squibb Company | 0.02 | 6.23 | 1.10 | -9.53 | 0.3778 | -0.0330 | |||
| RSG / Republic Services, Inc. | 0.00 | -15.33 | 1.07 | -2.11 | 0.3668 | -0.0017 | |||
| META / Meta Platforms, Inc. | 0.00 | -21.80 | 1.01 | -37.68 | 0.3478 | -0.2014 | |||
| RTX / RTX Corporation | 0.01 | -27.20 | 1.01 | -28.83 | 0.3473 | -0.1324 | |||
| ABBV / AbbVie Inc. | 0.01 | -18.45 | 1.00 | -13.53 | 0.3442 | -0.0471 | |||
| GDDY / GoDaddy Inc. | 0.01 | -8.32 | 0.99 | -18.79 | 0.3411 | -0.0721 | |||
| IBM / International Business Machines Corporation | 0.00 | -22.72 | 0.99 | -26.90 | 0.3394 | -0.1174 | |||
| BSX / Boston Scientific Corporation | 0.01 | 528.09 | 0.99 | 532.05 | 0.3384 | 0.2856 | |||
| BK / The Bank of New York Mellon Corporation | 0.01 | -10.56 | 0.98 | -16.37 | 0.3350 | -0.0587 | |||
| PM / Philip Morris International Inc. | 0.01 | 0.00 | 0.96 | 31.72 | 0.3276 | 0.0828 | |||
| QCOM / QUALCOMM Incorporated | 0.01 | 7.87 | 0.95 | -7.38 | 0.3273 | -0.0203 | |||
| T / AT&T Inc. | 0.03 | -19.50 | 0.94 | -5.98 | 0.3235 | -0.0151 | |||
| COR / Cencora, Inc. | 0.00 | -44.41 | 0.94 | -35.97 | 0.3224 | -0.1731 | |||
| EOG / EOG Resources, Inc. | 0.01 | 18.78 | 0.92 | 4.18 | 0.3166 | 0.0177 | |||
| KMI / Kinder Morgan, Inc. | 0.03 | 20.65 | 0.92 | 15.45 | 0.3155 | 0.0468 | |||
| FOXA / Fox Corporation | 0.02 | 55.83 | 0.84 | 51.72 | 0.2869 | 0.1007 | |||
| MS / Morgan Stanley | 0.01 | 183.14 | 0.77 | 136.11 | 0.2626 | 0.1532 | |||
| JPM / JPMorgan Chase & Co. | 0.00 | 10.87 | 0.75 | 1.49 | 0.2566 | 0.0079 | |||
| STT / State Street Corporation | 0.01 | 56.85 | 0.74 | 36.21 | 0.2542 | 0.0703 | |||
| PGR / The Progressive Corporation | 0.00 | -40.54 | 0.73 | -32.04 | 0.2520 | -0.1126 | |||
| NRG / NRG Energy, Inc. | 0.01 | -30.13 | 0.72 | -25.31 | 0.2471 | -0.0781 | |||
| UNP / Union Pacific Corporation | 0.00 | 14.60 | 0.72 | -0.28 | 0.2467 | 0.0034 | |||
| EXPE / Expedia Group, Inc. | 0.00 | 48.93 | 0.72 | 36.83 | 0.2461 | 0.0690 | |||
| EXPD / Expeditors International of Washington, Inc. | 0.01 | -11.91 | 0.71 | -14.73 | 0.2442 | -0.0376 | |||
| AEP / American Electric Power Company, Inc. | 0.01 | -7.35 | 0.71 | 2.01 | 0.2441 | 0.0088 | |||
| SYF / Synchrony Financial | 0.01 | 0.34 | 0.70 | -24.41 | 0.2412 | -0.0728 | |||
| V / Visa Inc. | 0.00 | -29.05 | 0.69 | -10.22 | 0.2350 | -0.0005 | |||
| TSN / Tyson Foods, Inc. | 0.01 | 53.29 | 0.68 | 66.34 | 0.2341 | 0.0955 | |||
| CSCO / Cisco Systems, Inc. | 0.01 | -29.21 | 0.68 | -13.06 | 0.2330 | -0.0100 | |||
| FFIV / F5, Inc. | 0.00 | 0.00 | 0.67 | -10.95 | 0.2290 | -0.0239 | |||
| UHS / Universal Health Services, Inc. | 0.00 | 8.40 | 0.67 | 1.84 | 0.2281 | 0.0077 | |||
| ADP / Automatic Data Processing, Inc. | 0.00 | 107.35 | 0.65 | 105.99 | 0.2240 | 0.1169 | |||
| STLD / Steel Dynamics, Inc. | 0.00 | -16.00 | 0.64 | -14.97 | 0.2202 | -0.0346 | |||
| FI / Fiserv, Inc. | 0.00 | -4.44 | 0.64 | -18.41 | 0.2191 | -0.0449 | |||
| Invesco Private Government Fund / STIV (N/A) | 0.60 | 0.60 | 0.2071 | 0.2071 | |||||
| Invesco Private Government Fund / STIV (N/A) | 0.60 | 0.60 | 0.2071 | 0.2071 | |||||
| LCH CLEARNET (US) LLC / DIR (N/A) | 0.59 | 0.2026 | 0.2026 | ||||||
| DTE / DTE Energy Company | 0.00 | 9.99 | 0.59 | 25.91 | 0.2017 | 0.0439 | |||
| ABT / Abbott Laboratories | 0.00 | 88.67 | 0.58 | 92.64 | 0.1979 | 0.0969 | |||
| EME / EMCOR Group, Inc. | 0.00 | 0.00 | 0.58 | -10.56 | 0.1976 | -0.0197 | |||
| WAB / Westinghouse Air Brake Technologies Corporation | 0.00 | 0.00 | 0.56 | -11.06 | 0.1932 | -0.0207 | |||
| CRM / Salesforce, Inc. | 0.00 | -10.10 | 0.56 | -29.31 | 0.1928 | -0.0754 | |||
| UTHR / United Therapeutics Corporation | 0.00 | -25.02 | 0.54 | -35.29 | 0.1850 | -0.0962 | |||
| MCK / McKesson Corporation | 0.00 | -53.59 | 0.53 | -44.42 | 0.1831 | -0.1407 | |||
| EBAY / eBay Inc. | 0.01 | -18.39 | 0.53 | -17.55 | 0.1821 | -0.0352 | |||
| LCH CLEARNET (US) LLC / DIR (N/A) | 0.53 | 0.1816 | 0.1816 | ||||||
| AIZ / Assurant, Inc. | 0.00 | -10.97 | 0.53 | -20.27 | 0.1808 | -0.0422 | |||
| CAH / Cardinal Health, Inc. | 0.00 | -46.61 | 0.51 | -39.07 | 0.1762 | -0.1079 | |||
| UNM / Unum Group | 0.01 | 186.47 | 0.51 | 192.00 | 0.1753 | 0.1162 | |||
| OVV / Ovintiv Inc. | 0.02 | 14.81 | 0.51 | -8.80 | 0.1745 | -0.0135 | |||
| USFD / US Foods Holding Corp. | 0.01 | 24.31 | 0.49 | 14.99 | 0.1686 | 0.0245 | |||
| DOCU / DocuSign, Inc. | 0.01 | -33.94 | 0.49 | -44.20 | 0.1669 | -0.1271 | |||
| CF / CF Industries Holdings, Inc. | 0.01 | 23.04 | 0.48 | 4.55 | 0.1659 | 0.0099 | |||
| GEN / Gen Digital Inc. | 0.02 | 88.58 | 0.48 | 81.51 | 0.1650 | 0.0755 | |||
| GIS / General Mills, Inc. | 0.01 | -35.52 | 0.48 | -39.16 | 0.1647 | -0.1016 | |||
| TAP / Molson Coors Beverage Company | 0.01 | 9.19 | 0.48 | 14.90 | 0.1639 | 0.0234 | |||
| LH / Labcorp Holdings Inc. | 0.00 | 0.47 | 0.1617 | 0.1617 | |||||
| SSNC / SS&C Technologies Holdings, Inc. | 0.01 | 58.33 | 0.47 | 47.95 | 0.1609 | 0.0539 | |||
| DVA / DaVita Inc. | 0.00 | -25.69 | 0.46 | -40.28 | 0.1583 | -0.1025 | |||
| UAL / United Airlines Holdings, Inc. | 0.01 | 120.80 | 0.46 | 43.75 | 0.1579 | 0.0497 | |||
| SO / The Southern Company | 0.00 | 0.00 | 0.45 | 9.66 | 0.1557 | 0.0158 | |||
| FLEX / Flex Ltd. | 0.01 | 71.47 | 0.45 | 41.51 | 0.1545 | 0.0470 | |||
| LDOS / Leidos Holdings, Inc. | 0.00 | -45.73 | 0.45 | -43.76 | 0.1531 | -0.1147 | |||
| UNH / UnitedHealth Group Incorporated | 0.00 | 50.07 | 0.44 | 13.92 | 0.1518 | 0.0206 | |||
| BDX / Becton, Dickinson and Company | 0.00 | 85.50 | 0.44 | 55.09 | 0.1518 | 0.0556 | |||
| VST / Vistra Corp. | 0.00 | -36.36 | 0.44 | -50.90 | 0.1504 | -0.1509 | |||
| COST / Costco Wholesale Corporation | 0.00 | 37.42 | 0.43 | 39.55 | 0.1490 | 0.0439 | |||
| ZM / Zoom Communications Inc. | 0.01 | -18.83 | 0.43 | -27.58 | 0.1469 | -0.0527 | |||
| XOM / Exxon Mobil Corporation | 0.00 | 13.14 | 0.43 | 11.81 | 0.1462 | 0.0177 | |||
| APP / AppLovin Corporation | 0.00 | -26.76 | 0.43 | -46.62 | 0.1461 | -0.1232 | |||
| XEL / Xcel Energy Inc. | 0.01 | 0.00 | 0.43 | 5.20 | 0.1458 | 0.0095 | |||
| CVX / Chevron Corporation | 0.00 | 67.20 | 0.42 | 52.71 | 0.1454 | 0.0516 | |||
| CHRW / C.H. Robinson Worldwide, Inc. | 0.00 | 28.19 | 0.42 | 14.71 | 0.1447 | 0.0209 | |||
| FDX / FedEx Corporation | 0.00 | 54.43 | 0.42 | 22.65 | 0.1433 | 0.0284 | |||
| FTNT / Fortinet, Inc. | 0.00 | 81.97 | 0.42 | 87.39 | 0.1429 | 0.0678 | |||
| LCH CLEARNET (US) LLC / DIR (N/A) | 0.40 | 0.1368 | 0.1368 | ||||||
| THC / Tenet Healthcare Corporation | 0.00 | -29.45 | 0.39 | -28.49 | 0.1336 | -0.0500 | |||
| Forward Foreign Currency Contract / DFE (N/A) | 0.39 | 0.1333 | 0.1333 | ||||||
| BKR / Baker Hughes Company | 0.01 | -5.09 | 0.39 | -27.31 | 0.1327 | -0.0467 | |||
| CMCSA / Comcast Corporation | 0.01 | 0.00 | 0.39 | 1.58 | 0.1325 | 0.0042 | |||
| C / Citigroup Inc. | 0.01 | 2.23 | 0.38 | -14.13 | 0.1314 | -0.0192 | |||
| ACN / Accenture plc | 0.00 | 17.56 | 0.38 | 11.05 | 0.1312 | 0.0309 | |||
| BG / Bunge Global SA | 0.00 | -26.39 | 0.38 | -23.95 | 0.1308 | -0.0382 | |||
| MSI / Motorola Solutions, Inc. | 0.00 | -75.46 | 0.38 | -76.98 | 0.1294 | -0.4233 | |||
| HIG / The Hartford Insurance Group, Inc. | 0.00 | -41.93 | 0.38 | -36.05 | 0.1290 | -0.0697 | |||
| ORCL / Oracle Corporation | 0.00 | -35.30 | 0.37 | -46.49 | 0.1284 | -0.1075 | |||
| BAC / Bank of America Corporation | 0.01 | 46.61 | 0.37 | 26.53 | 0.1276 | 0.0282 | |||
| TWLO / Twilio Inc. | 0.00 | -31.81 | 0.37 | -55.03 | 0.1274 | -0.1511 | |||
| NTAP / NetApp, Inc. | 0.00 | -57.97 | 0.36 | -69.08 | 0.1231 | -0.2688 | |||
| MDT / Medtronic plc | 0.00 | 0.00 | 0.35 | -6.61 | 0.1211 | -0.0065 | |||
| DIS / The Walt Disney Company | 0.00 | 313.74 | 0.35 | 292.05 | 0.1183 | 0.0893 | |||
| DVN / Devon Energy Corporation | 0.01 | -43.23 | 0.34 | -49.34 | 0.1180 | -0.1113 | |||
| LLY / Eli Lilly and Company | 0.00 | 259.43 | 0.34 | 302.35 | 0.1175 | 0.0885 | |||
| RL / Ralph Lauren Corporation | 0.00 | 0.34 | 0.1163 | 0.1163 | |||||
| INGR / Ingredion Incorporated | 0.00 | 0.33 | 0.1145 | 0.1145 | |||||
| GM / General Motors Company | 0.01 | -36.52 | 0.33 | -42.02 | 0.1125 | -0.0780 | |||
| ECL / Ecolab Inc. | 0.00 | -13.72 | 0.33 | -13.26 | 0.1123 | -0.0151 | |||
| HAS / Hasbro, Inc. | 0.01 | 2.00 | 0.32 | 9.09 | 0.1113 | 0.0110 | |||
| TT / Trane Technologies plc | 0.00 | 20.63 | 0.32 | 27.49 | 0.1099 | 0.0251 | |||
| COP / ConocoPhillips | 0.00 | -27.35 | 0.31 | -34.52 | 0.1075 | -0.0539 | |||
| KO / The Coca-Cola Company | 0.00 | -58.82 | 0.31 | -54.23 | 0.1057 | -0.1161 | |||
| CCL / Carnival Corporation & plc | 0.02 | 52.89 | 0.31 | 1.32 | 0.1050 | 0.0031 | |||
| CMS / CMS Energy Corporation | 0.00 | 28.22 | 0.30 | 42.72 | 0.1045 | 0.0327 | |||
| LNG / Cheniere Energy, Inc. | 0.00 | -40.55 | 0.30 | -12.89 | 0.1045 | -0.0044 | |||
| HCA / HCA Healthcare, Inc. | 0.00 | -46.87 | 0.30 | -44.42 | 0.1044 | -0.0804 | |||
| EVRG / Evergy, Inc. | 0.00 | 0.30 | 0.1033 | 0.1033 | |||||
| Forward Foreign Currency Contract / DFE (N/A) | 0.30 | 0.1022 | 0.1022 | ||||||
| Macquarie Bank Limited / DCO (N/A) | 0.30 | 0.1013 | 0.1013 | ||||||
| PKG / Packaging Corporation of America | 0.00 | -17.94 | 0.29 | -28.47 | 0.0993 | -0.0371 | |||
| RMD / ResMed Inc. | 0.00 | -14.95 | 0.29 | -14.75 | 0.0992 | -0.0153 | |||
| CRH / CRH plc | 0.00 | 0.29 | 0.0988 | 0.0988 | |||||
| EXC / Exelon Corporation | 0.01 | 23.32 | 0.29 | 44.44 | 0.0982 | 0.0314 | |||
| ALL / The Allstate Corporation | 0.00 | -45.66 | 0.28 | -43.99 | 0.0946 | -0.0714 | |||
| PPL / PPL Corporation | 0.01 | 0.00 | 0.27 | 8.43 | 0.0929 | 0.0088 | |||
| DGX / Quest Diagnostics Incorporated | 0.00 | 26.66 | 0.27 | 38.66 | 0.0924 | 0.0267 | |||
| APH / Amphenol Corporation | 0.00 | -18.24 | 0.26 | -11.19 | 0.0901 | -0.0096 | |||
| RCL / Royal Caribbean Cruises Ltd. | 0.00 | 132.88 | 0.26 | 88.41 | 0.0893 | 0.0425 | |||
| NOW / ServiceNow, Inc. | 0.00 | -50.09 | 0.26 | -53.33 | 0.0891 | -0.0981 | |||
| LCH CLEARNET (US) LLC / DIR (N/A) | 0.26 | 0.0875 | 0.0875 | ||||||
| GLW / Corning Incorporated | 0.01 | 96.30 | 0.25 | 68.03 | 0.0849 | 0.0350 | |||
| MMM / 3M Company | 0.00 | 85.41 | 0.25 | 68.97 | 0.0842 | 0.0353 | |||
| INCY / Incyte Corporation | 0.00 | 26.98 | 0.24 | 7.05 | 0.0836 | 0.0070 | |||
| LCH CLEARNET (US) LLC / DIR (N/A) | 0.24 | 0.0822 | 0.0822 | ||||||
| MRK / Merck & Co., Inc. | 0.00 | 105.49 | 0.24 | 76.69 | 0.0809 | 0.0360 | |||
| PNC / The PNC Financial Services Group, Inc. | 0.00 | 21.91 | 0.23 | -2.50 | 0.0803 | -0.0007 | |||
| TSLA / Tesla, Inc. | 0.00 | -22.02 | 0.23 | -45.75 | 0.0792 | -0.0640 | |||
| BR / Broadridge Financial Solutions, Inc. | 0.00 | -31.76 | 0.22 | -22.76 | 0.0770 | -0.0147 | |||
| ADM / Archer-Daniels-Midland Company | 0.00 | -49.61 | 0.22 | -53.04 | 0.0770 | -0.0842 | |||
| DOX / Amdocs Limited | 0.00 | 0.00 | 0.22 | 0.45 | 0.0767 | 0.0016 | |||
| CLX / The Clorox Company | 0.00 | 90.73 | 0.22 | 70.77 | 0.0763 | 0.0324 | |||
| FTI / TechnipFMC plc | 0.01 | -55.98 | 0.22 | 53.10 | 0.0763 | 0.0416 | |||
| ADI / Analog Devices, Inc. | 0.00 | -13.65 | 0.22 | -15.77 | 0.0753 | -0.0005 | |||
| WFC / Wells Fargo & Company | 0.00 | -15.69 | 0.22 | -23.96 | 0.0751 | -0.0221 | |||
| TMUS / T-Mobile US, Inc. | 0.00 | 0.00 | 0.22 | 5.85 | 0.0745 | 0.0054 | |||
| NI / NiSource Inc. | 0.01 | 0.21 | 0.0736 | 0.0736 | |||||
| FIX / Comfort Systems USA, Inc. | 0.00 | 0.21 | 0.0735 | 0.0735 | |||||
| NTRS / Northern Trust Corporation | 0.00 | 76.11 | 0.21 | 47.92 | 0.0732 | 0.0243 | |||
| WSM / Williams-Sonoma, Inc. | 0.00 | 29.82 | 0.21 | -4.91 | 0.0731 | -0.0027 | |||
| Barclays Bank PLC / DCO (N/A) | 0.21 | 0.0705 | 0.0705 | ||||||
| ADBE / Adobe Inc. | 0.00 | 64.44 | 0.20 | 32.89 | 0.0696 | 0.0222 | |||
| PRU / Prudential Financial, Inc. | 0.00 | -18.81 | 0.20 | -31.14 | 0.0686 | -0.0291 | |||
| ILMN / Illumina, Inc. | 0.00 | 0.20 | 0.0684 | 0.0684 | |||||
| GRMN / Garmin Ltd. | 0.00 | 27.49 | 0.20 | 10.61 | 0.0681 | 0.0074 | |||
| PFE / Pfizer Inc. | 0.01 | 0.00 | 0.20 | -7.55 | 0.0672 | -0.0046 | |||
| KDP / Keurig Dr Pepper Inc. | 0.01 | 0.00 | 0.19 | 7.82 | 0.0665 | 0.0058 | |||
| AMGN / Amgen Inc. | 0.00 | 182.55 | 0.19 | 157.33 | 0.0662 | 0.0415 | |||
| KR / The Kroger Co. | 0.00 | 0.00 | 0.19 | 17.07 | 0.0660 | 0.0106 | |||
| ACM / AECOM | 0.00 | 0.19 | 0.0653 | 0.0653 | |||||
| ATO / Atmos Energy Corporation | 0.00 | -46.39 | 0.19 | -39.81 | 0.0651 | -0.0409 | |||
| CTSH / Cognizant Technology Solutions Corporation | 0.00 | -47.42 | 0.19 | -49.04 | 0.0640 | -0.0513 | |||
| GL / Globe Life Inc. | 0.00 | 0.19 | 0.0640 | 0.0640 | |||||
| TEL / TE Connectivity plc | 0.00 | 0.18 | 0.0625 | 0.0625 | |||||
| L / Loews Corporation | 0.00 | 0.00 | 0.18 | 1.69 | 0.0618 | 0.0020 | |||
| BAH / Booz Allen Hamilton Holding Corporation | 0.00 | -45.64 | 0.18 | -49.58 | 0.0613 | -0.0579 | |||
| TYL / Tyler Technologies, Inc. | 0.00 | 0.00 | 0.18 | -9.79 | 0.0602 | -0.0054 | |||
| ED / Consolidated Edison, Inc. | 0.00 | -50.06 | 0.17 | -40.00 | 0.0598 | -0.0381 | |||
| ATR / AptarGroup, Inc. | 0.00 | 0.00 | 0.17 | -4.40 | 0.0597 | -0.0018 | |||
| ZBRA / Zebra Technologies Corporation | 0.00 | 33.87 | 0.17 | -14.36 | 0.0573 | -0.0086 | |||
| VTRS / Viatris Inc. | 0.02 | -40.47 | 0.16 | -55.62 | 0.0544 | -0.0660 | |||
| CTAS / Cintas Corporation | 0.00 | -52.40 | 0.15 | -49.67 | 0.0525 | -0.0503 | |||
| VRSK / Verisk Analytics, Inc. | 0.00 | 5.97 | 0.15 | 9.35 | 0.0524 | 0.0052 | |||
| EHC / Encompass Health Corporation | 0.00 | 0.15 | 0.0518 | 0.0518 | |||||
| CVNA / Carvana Co. | 0.00 | 0.15 | 0.0516 | 0.0516 | |||||
| LRCX / Lam Research Corporation | 0.00 | -61.99 | 0.15 | -66.37 | 0.0515 | -0.0991 | |||
| CCK / Crown Holdings, Inc. | 0.00 | 0.15 | 0.0504 | 0.0504 | |||||
| CAG / Conagra Brands, Inc. | 0.01 | 0.00 | 0.14 | -4.67 | 0.0494 | -0.0015 | |||
| JBL / Jabil Inc. | 0.00 | 47.31 | 0.14 | 84.21 | 0.0482 | 0.0244 | |||
| EIX / Edison International | 0.00 | 32.63 | 0.14 | 5.38 | 0.0471 | 0.0068 | |||
| SWKS / Skyworks Solutions, Inc. | 0.00 | 40.57 | 0.14 | 1.50 | 0.0465 | 0.0016 | |||
| KLAC / KLA Corporation | 0.00 | 3.78 | 0.13 | -1.47 | 0.0463 | 0.0002 | |||
| PH / Parker-Hannifin Corporation | 0.00 | 0.13 | 0.0446 | 0.0446 | |||||
| EA / Electronic Arts Inc. | 0.00 | -77.62 | 0.13 | -73.62 | 0.0444 | -0.1208 | |||
| FIS / Fidelity National Information Services, Inc. | 0.00 | -83.23 | 0.13 | -83.79 | 0.0443 | -0.2243 | |||
| NUE / Nucor Corporation | 0.00 | -26.64 | 0.13 | -32.09 | 0.0438 | -0.0194 | |||
| CMI / Cummins Inc. | 0.00 | 4.27 | 0.12 | 39.08 | 0.0418 | 0.0236 | |||
| MRVL / Marvell Technology, Inc. | 0.00 | 0.12 | 0.0418 | 0.0418 | |||||
| NTNX / Nutanix, Inc. | 0.00 | -50.13 | 0.11 | -50.22 | 0.0392 | -0.0382 | |||
| CME / CME Group Inc. | 0.00 | -32.71 | 0.11 | -21.01 | 0.0375 | -0.0093 | |||
| COF / Capital One Financial Corporation | 0.00 | 0.00 | 0.11 | -11.76 | 0.0362 | -0.0040 | |||
| MAS / Masco Corporation | 0.00 | 1.42 | 0.10 | -22.56 | 0.0355 | -0.0095 | |||
| COG / Cabot Oil & Gas Corp. | 0.00 | -70.46 | 0.10 | -74.03 | 0.0346 | -0.0954 | |||
| CHTR / Charter Communications, Inc. | 0.00 | -37.01 | 0.10 | -33.33 | 0.0345 | -0.0081 | |||
| BBY / Best Buy Co., Inc. | 0.00 | 0.00 | 0.09 | -22.88 | 0.0315 | -0.0084 | |||
| CSL / Carlisle Companies Incorporated | 0.00 | -43.03 | 0.09 | -44.65 | 0.0303 | -0.0234 | |||
| LMT / Lockheed Martin Corporation | 0.00 | -78.26 | 0.09 | -77.81 | 0.0295 | -0.0998 | |||
| NBIX / Neurocrine Biosciences, Inc. | 0.00 | -70.44 | 0.08 | -79.26 | 0.0291 | -0.1075 | |||
| MKC / McCormick & Company, Incorporated | 0.00 | -54.67 | 0.08 | -55.00 | 0.0278 | -0.0330 | |||
| NOC / Northrop Grumman Corporation | 0.00 | 0.08 | 0.0264 | 0.0264 | |||||
| MTB / M&T Bank Corporation | 0.00 | -39.49 | 0.07 | -48.94 | 0.0248 | -0.0230 | |||
| IFF / International Flavors & Fragrances Inc. | 0.00 | -52.08 | 0.07 | -56.97 | 0.0245 | -0.0313 | |||
| Goldman Sachs International / DE (N/A) | 0.03 | 0.0106 | 0.0106 | ||||||
| LCH CLEARNET (US) LLC / DIR (N/A) | 0.02 | 0.0078 | 0.0078 | ||||||
| Goldman Sachs International / DE (N/A) | 0.01 | 0.0020 | 0.0020 | ||||||
| Southcross Energy Partners GP LLC, Pfd. / EP (N/A) | 0.07 | 0.00 | 0.0001 | 0.0001 | |||||
| Southcross Energy Partners GP LLC, Pfd. / EP (N/A) | 0.07 | 0.00 | 0.0001 | 0.0001 | |||||
| XAN5200EAB73 / Lealand Finance Company BV, Term Loan | 0.00 | 0.0000 | 0.0000 | ||||||
| SABN / Sabine Oil & Gas Holdings Inc. | 0.00 | 0.00 | 0.00 | 0.0000 | 0.0000 | ||||
| GEV / GE Vernova Inc. | 0.00 | -100.00 | 0.00 | -100.00 | -0.0587 | ||||
| TXRH / Texas Roadhouse, Inc. | 0.00 | -100.00 | 0.00 | -100.00 | -0.0658 | ||||
| RGA / Reinsurance Group of America, Incorporated | 0.00 | -100.00 | 0.00 | -100.00 | -0.0838 | ||||
| Goldman Sachs International / DE (N/A) | -0.03 | -0.0107 | -0.0107 | ||||||
| Goldman Sachs International / DE (N/A) | -0.04 | -0.0153 | -0.0153 | ||||||
| Goldman Sachs International / DE (N/A) | -0.04 | -0.0153 | -0.0153 | ||||||
| LCH CLEARNET (US) LLC / DIR (N/A) | -0.08 | -0.0265 | -0.0265 | ||||||
| LCH CLEARNET (US) LLC / DIR (N/A) | -0.17 | -0.0584 | -0.0584 | ||||||
| LCH CLEARNET (US) LLC / DIR (N/A) | -0.17 | -0.0584 | -0.0584 | ||||||
| Goldman Sachs International / DE (N/A) | -0.19 | -0.0646 | -0.0646 | ||||||
| LCH CLEARNET (US) LLC / DIR (N/A) | -0.22 | -0.0738 | -0.0738 | ||||||
| Forward Foreign Currency Contract / DFE (N/A) | -0.35 | -0.1200 | -0.1200 | ||||||
| Goldman Sachs International / DE (N/A) | -0.37 | -0.1269 | -0.1269 | ||||||
| Forward Foreign Currency Contract / DFE (N/A) | -0.44 | -0.1521 | -0.1521 | ||||||
| Forward Foreign Currency Contract / DFE (N/A) | -0.44 | -0.1521 | -0.1521 | ||||||
| LCH CLEARNET (US) LLC / DIR (N/A) | -0.53 | -0.1825 | -0.1825 | ||||||
| LCH CLEARNET (US) LLC / DIR (N/A) | -0.72 | -0.2475 | -0.2475 |