Statistik Asas
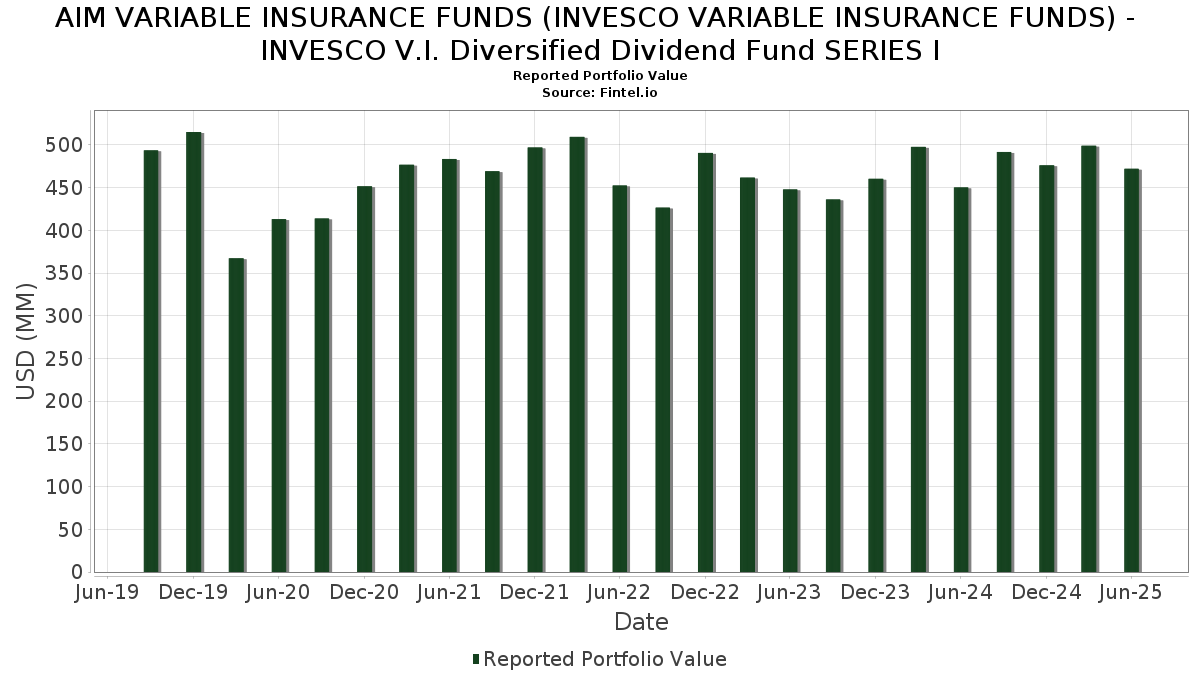
| Nilai Portfolio | $ 472,010,590 |
| Kedudukan Semasa | 83 |
Pegangan Terkini, Prestasi, AUM (dari 13F, 13D)
AIM VARIABLE INSURANCE FUNDS (INVESCO VARIABLE INSURANCE FUNDS) - INVESCO V.I. Diversified Dividend Fund SERIES I telah mendedahkan 83 jumlah pegangan dalam pemfailan SEC terkini mereka. Nilai portfolio terkini dikira sebagai $ 472,010,590 USD. Aset Sebenar Di Bawah Pengurusan (AUM) ialah nilai ini ditambah dengan tunai (yang tidak didedahkan). Pegangan teratas AIM VARIABLE INSURANCE FUNDS (INVESCO VARIABLE INSURANCE FUNDS) - INVESCO V.I. Diversified Dividend Fund SERIES I ialah JPMorgan Chase & Co. (US:JPM) , Walmart Inc. (US:WMT) , Bank of America Corporation (US:BAC) , Chevron Corporation (US:CVX) , and Philip Morris International Inc. (US:PM) . Kedudukan baharu AIM VARIABLE INSURANCE FUNDS (INVESCO VARIABLE INSURANCE FUNDS) - INVESCO V.I. Diversified Dividend Fund SERIES I termasuk Oracle Corporation (US:ORCL) , The Williams Companies, Inc. (US:WMB) , Alphabet Inc. (US:GOOGL) , Danaher Corporation (US:DHR) , and Keurig Dr Pepper Inc. (US:KDP) .
Kenaikan Teratas Suku Tahun Ini
Kami menggunakan perubahan dalam peruntukan portfolio kerana ini adalah metrik yang paling bermakna. Perubahan boleh disebabkan oleh perdagangan atau perubahan dalam harga saham.
| Sekuriti | Saham (MM) |
Nilai (MM$) |
Portfolio % | ΔPortfolio % |
|---|---|---|---|---|
| 19.45 | 19.45 | 4.3671 | 4.3671 | |
| 7.49 | 7.49 | 1.6807 | 1.6807 | |
| 0.03 | 5.96 | 1.3376 | 1.3376 | |
| 0.09 | 5.90 | 1.3245 | 1.3245 | |
| 0.03 | 5.55 | 1.2456 | 1.2456 | |
| 0.03 | 5.10 | 1.1440 | 1.1440 | |
| 0.14 | 4.70 | 1.0555 | 1.0555 | |
| 0.24 | 11.25 | 2.5243 | 0.8611 | |
| 0.01 | 3.45 | 0.7750 | 0.7750 | |
| 0.06 | 18.09 | 4.0606 | 0.6216 |
Penurunan Teratas Suku Tahun Ini
Kami menggunakan perubahan dalam peruntukan portfolio kerana ini adalah metrik yang paling bermakna. Perubahan boleh disebabkan oleh perdagangan atau perubahan dalam harga saham.
| Sekuriti | Saham (MM) |
Nilai (MM$) |
Portfolio % | ΔPortfolio % |
|---|---|---|---|---|
| 2.68 | 2.68 | 0.6026 | -3.0663 | |
| 0.01 | 3.27 | 0.7329 | -1.6542 | |
| 1.45 | 1.45 | 0.3246 | -1.6511 | |
| 0.04 | 1.97 | 0.4431 | -0.6300 | |
| 0.03 | 1.03 | 0.2311 | -0.6202 | |
| 0.07 | 3.44 | 0.7726 | -0.5143 | |
| 0.03 | 8.05 | 1.8068 | -0.5128 | |
| 0.01 | 3.67 | 0.8240 | -0.4974 | |
| 0.06 | 9.44 | 2.1191 | -0.4905 | |
| 0.02 | 4.59 | 1.0307 | -0.4690 |
13F dan Pemfailan Dana
Borang ini telah difailkan pada 2025-08-27 untuk tempoh pelaporan 2025-06-30. Klik ikon pautan untuk melihat sejarah transaksi penuh.
Tingkatkan untuk membuka data premium dan eksport ke Excel ![]() .
.
| Sekuriti | Jenis | Purata Harga Saham | Saham (MM) |
ΔSaham (%) |
ΔSaham (%) |
Nilai ($MM) |
Portfolio (%) |
ΔPortfolio (%) |
|
|---|---|---|---|---|---|---|---|---|---|
| Invesco Private Prime Fund / STIV (N/A) | 19.45 | 19.45 | 4.3671 | 4.3671 | |||||
| JPM / JPMorgan Chase & Co. | 0.06 | 0.75 | 18.09 | 19.08 | 4.0606 | 0.6216 | |||
| WMT / Walmart Inc. | 0.12 | -6.61 | 11.64 | 4.02 | 2.6127 | 0.0796 | |||
| BAC / Bank of America Corporation | 0.24 | 34.98 | 11.25 | 53.06 | 2.5243 | 0.8611 | |||
| CVX / Chevron Corporation | 0.08 | 13.56 | 11.15 | -2.80 | 2.5035 | -0.0940 | |||
| PM / Philip Morris International Inc. | 0.06 | -8.08 | 10.81 | 5.47 | 2.4269 | 0.1064 | |||
| MSFT / Microsoft Corporation | 0.02 | 0.78 | 10.79 | 33.54 | 2.4232 | 0.5932 | |||
| LOW / Lowe's Companies, Inc. | 0.05 | 2.10 | 10.13 | -2.87 | 2.2742 | -0.0871 | |||
| CSCO / Cisco Systems, Inc. | 0.14 | 2.10 | 9.90 | 14.79 | 2.2213 | 0.2699 | |||
| WFC / Wells Fargo & Company | 0.12 | 14.34 | 9.59 | 27.60 | 2.1536 | 0.4516 | |||
| JNJ / Johnson & Johnson | 0.06 | -11.09 | 9.44 | -18.11 | 2.1191 | -0.4905 | |||
| ETN / Eaton Corporation plc | 0.02 | 7.54 | 8.54 | 41.24 | 1.9173 | 0.5483 | |||
| UNP / Union Pacific Corporation | 0.04 | 2.10 | 8.50 | -0.56 | 1.9084 | -0.0270 | |||
| AIG / American International Group, Inc. | 0.10 | 2.10 | 8.41 | 0.51 | 1.8882 | -0.0062 | |||
| PG / The Procter & Gamble Company | 0.05 | 2.10 | 8.22 | -4.54 | 1.8459 | -0.1043 | |||
| SCHW / The Charles Schwab Corporation | 0.09 | 2.10 | 8.16 | 19.01 | 1.8316 | 0.2795 | |||
| MCD / McDonald's Corporation | 0.03 | -16.02 | 8.05 | -21.45 | 1.8068 | -0.5128 | |||
| Invesco Private Government Fund / STIV (N/A) | 7.49 | 7.49 | 1.6807 | 1.6807 | |||||
| MDT / Medtronic plc | 0.08 | -3.57 | 7.39 | -6.45 | 1.6585 | -0.1294 | |||
| T / AT&T Inc. | 0.25 | -4.53 | 7.34 | -2.30 | 1.6477 | -0.0531 | |||
| NOC / Northrop Grumman Corporation | 0.01 | -5.90 | 7.11 | -8.11 | 1.5953 | -0.1555 | |||
| BLK / BlackRock, Inc. | 0.01 | 2.09 | 6.76 | 13.18 | 1.5175 | 0.1653 | |||
| KO / The Coca-Cola Company | 0.10 | -6.05 | 6.75 | -7.19 | 1.5149 | -0.1312 | |||
| DE / Deere & Company | 0.01 | 28.42 | 6.72 | 39.14 | 1.5090 | 0.4152 | |||
| COP / ConocoPhillips | 0.07 | -9.80 | 6.62 | -22.92 | 1.4863 | -0.4585 | |||
| SYY / Sysco Corporation | 0.09 | 2.10 | 6.58 | 3.06 | 1.4764 | 0.0316 | |||
| PPL / PPL Corporation | 0.19 | 2.10 | 6.56 | -4.18 | 1.4736 | -0.0772 | |||
| EMR / Emerson Electric Co. | 0.05 | 0.00 | 6.47 | 21.60 | 1.4523 | 0.2479 | |||
| ETR / Entergy Corporation | 0.08 | 2.10 | 6.47 | -0.74 | 1.4521 | -0.0230 | |||
| PNC / The PNC Financial Services Group, Inc. | 0.03 | 2.11 | 6.35 | 8.29 | 1.4248 | 0.0979 | |||
| MAR / Marriott International, Inc. | 0.02 | 15.36 | 6.34 | 32.31 | 1.4230 | 0.3384 | |||
| PH / Parker-Hannifin Corporation | 0.01 | 0.00 | 6.07 | 14.90 | 1.3625 | 0.1667 | |||
| ORCL / Oracle Corporation | 0.03 | 5.96 | 1.3376 | 1.3376 | |||||
| WMB / The Williams Companies, Inc. | 0.09 | 5.90 | 1.3245 | 1.3245 | |||||
| CRH / CRH plc | 0.06 | 2.11 | 5.67 | 6.54 | 1.2723 | 0.0681 | |||
| GOOGL / Alphabet Inc. | 0.03 | 5.55 | 1.2456 | 1.2456 | |||||
| TXN / Texas Instruments Incorporated | 0.03 | -34.45 | 5.48 | -24.26 | 1.2293 | -0.4076 | |||
| COF / Capital One Financial Corporation | 0.03 | -31.85 | 5.40 | -19.14 | 1.2132 | -0.2998 | |||
| DIS / The Walt Disney Company | 0.04 | 2.10 | 5.34 | 28.28 | 1.1995 | 0.2566 | |||
| MS / Morgan Stanley | 0.04 | 2.11 | 5.24 | 23.28 | 1.1759 | 0.2139 | |||
| PLD / Prologis, Inc. | 0.05 | -15.70 | 5.13 | -20.73 | 1.1522 | -0.3136 | |||
| DHR / Danaher Corporation | 0.03 | 5.10 | 1.1440 | 1.1440 | |||||
| V / Visa Inc. | 0.01 | -20.84 | 5.10 | -19.81 | 1.1439 | -0.2946 | |||
| AXP / American Express Company | 0.02 | 2.10 | 4.79 | 21.05 | 1.0743 | 0.1793 | |||
| AVGO / Broadcom Inc. | 0.02 | 15.15 | 4.72 | 89.63 | 1.0596 | 0.4959 | |||
| KDP / Keurig Dr Pepper Inc. | 0.14 | 4.70 | 1.0555 | 1.0555 | |||||
| COR / Cencora, Inc. | 0.02 | -7.35 | 4.68 | -0.09 | 1.0502 | -0.0099 | |||
| ABBV / AbbVie Inc. | 0.02 | -21.77 | 4.59 | -30.69 | 1.0307 | -0.4690 | |||
| VLO / Valero Energy Corporation | 0.03 | 2.11 | 4.56 | 3.92 | 1.0242 | 0.0303 | |||
| AMT / American Tower Corporation | 0.02 | 32.33 | 4.43 | 34.44 | 0.9938 | 0.2482 | |||
| PEG / Public Service Enterprise Group Incorporated | 0.05 | 44.83 | 4.27 | 48.18 | 0.9576 | 0.3057 | |||
| CMCSA / Comcast Corporation | 0.11 | 2.11 | 3.96 | -1.25 | 0.8889 | -0.0188 | |||
| CL / Colgate-Palmolive Company | 0.04 | -19.07 | 3.95 | -21.49 | 0.8875 | -0.2525 | |||
| JCI / Johnson Controls International plc | 0.04 | 2.10 | 3.92 | 34.63 | 0.8798 | 0.2207 | |||
| CVS / CVS Health Corporation | 0.06 | -12.76 | 3.87 | -24.56 | 0.8691 | -0.2530 | |||
| HIG / The Hartford Insurance Group, Inc. | 0.03 | 2.11 | 3.83 | 4.67 | 0.8602 | 0.0316 | |||
| CMS / CMS Energy Corporation | 0.05 | 2.11 | 3.68 | -5.83 | 0.8266 | -0.0585 | |||
| HUBB / Hubbell Incorporated | 0.01 | 0.00 | 3.68 | 23.44 | 0.8253 | 0.1509 | |||
| GE / General Electric Company | 0.01 | -51.10 | 3.67 | -37.13 | 0.8240 | -0.4974 | |||
| CRM / Salesforce, Inc. | 0.01 | -9.15 | 3.62 | -7.68 | 0.8125 | -0.0750 | |||
| APD / Air Products and Chemicals, Inc. | 0.01 | 3.45 | 0.7750 | 0.7750 | |||||
| BMY / Bristol-Myers Squibb Company | 0.07 | -20.23 | 3.44 | -39.46 | 0.7726 | -0.5143 | |||
| UNH / UnitedHealth Group Incorporated | 0.01 | -48.02 | 3.27 | -69.03 | 0.7329 | -1.6542 | |||
| TEL / TE Connectivity plc | 0.02 | 2.11 | 3.11 | 21.90 | 0.6984 | 0.1205 | |||
| CSL / Carlisle Companies Incorporated | 0.01 | 2.10 | 3.03 | 11.97 | 0.6804 | 0.0676 | |||
| FITB / Fifth Third Bancorp | 0.07 | 2.11 | 2.99 | 7.14 | 0.6704 | 0.0393 | |||
| SW / Smurfit Westrock Plc | 0.07 | 2.10 | 2.90 | -2.22 | 0.6517 | -0.0205 | |||
| LNG / Cheniere Energy, Inc. | 0.01 | 5.05 | 2.84 | 10.57 | 0.6367 | 0.0559 | |||
| US8252524066 / Invesco Treasury Portfolio, Institutional Class | 2.68 | -83.43 | 2.68 | -83.44 | 0.6026 | -3.0663 | |||
| AIR / Airbus SE | 0.01 | -47.31 | 2.68 | -37.41 | 0.6018 | -0.3676 | |||
| YUM / Yum! Brands, Inc. | 0.02 | 2.66 | 0.5966 | 0.5966 | |||||
| ROST / Ross Stores, Inc. | 0.02 | 2.56 | 0.5743 | 0.5743 | |||||
| TJX / The TJX Companies, Inc. | 0.02 | 2.11 | 2.51 | 3.55 | 0.5628 | 0.0145 | |||
| ASML / ASML Holding N.V. - Depositary Receipt (Common Stock) | 0.00 | 2.08 | 2.43 | 23.49 | 0.5465 | 0.1001 | |||
| ALC / Alcon Inc. | 0.03 | -30.69 | 2.42 | -35.53 | 0.5421 | -0.3061 | |||
| OR / L'Oréal S.A. | 0.01 | 2.10 | 2.27 | 17.67 | 0.5099 | 0.0729 | |||
| LONN / Lonza Group AG | 0.00 | -15.92 | 2.25 | -2.68 | 0.5052 | -0.0182 | |||
| AZN / Astrazeneca plc | 0.02 | -22.30 | 2.11 | -26.35 | 0.4743 | -0.1752 | |||
| MRK / Merck & Co., Inc. | 0.03 | 2.10 | 2.07 | -9.94 | 0.4639 | -0.0556 | |||
| SNY / Sanofi - Depositary Receipt (Common Stock) | 0.04 | -52.19 | 1.97 | -58.38 | 0.4431 | -0.6300 | |||
| LRCX / Lam Research Corporation | 0.02 | 2.11 | 1.97 | 36.72 | 0.4413 | 0.1158 | |||
| US8252528851 / Invesco Government & Agency Portfolio, Institutional Class | 1.45 | -83.43 | 1.45 | -83.44 | 0.3246 | -1.6511 | |||
| SU / Suncor Energy Inc. | 0.03 | -71.69 | 1.03 | -72.63 | 0.2311 | -0.6202 |