Statistik Asas
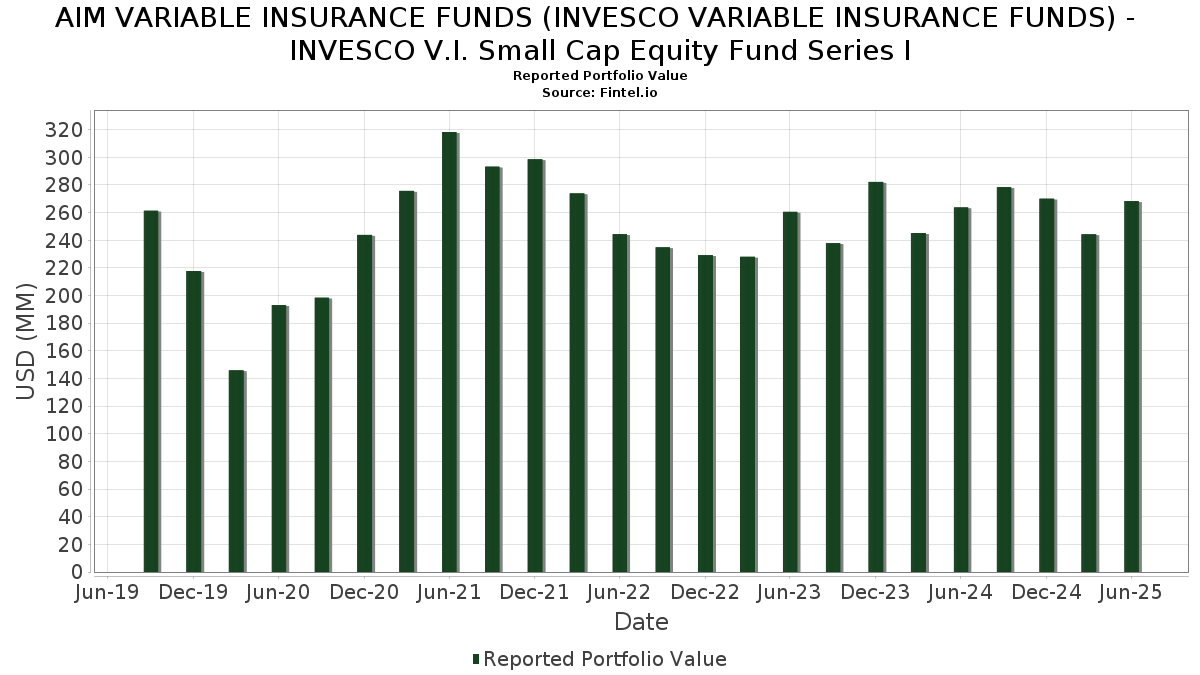
| Nilai Portfolio | $ 268,363,385 |
| Kedudukan Semasa | 89 |
Pegangan Terkini, Prestasi, AUM (dari 13F, 13D)
AIM VARIABLE INSURANCE FUNDS (INVESCO VARIABLE INSURANCE FUNDS) - INVESCO V.I. Small Cap Equity Fund Series I telah mendedahkan 89 jumlah pegangan dalam pemfailan SEC terkini mereka. Nilai portfolio terkini dikira sebagai $ 268,363,385 USD. Aset Sebenar Di Bawah Pengurusan (AUM) ialah nilai ini ditambah dengan tunai (yang tidak didedahkan). Pegangan teratas AIM VARIABLE INSURANCE FUNDS (INVESCO VARIABLE INSURANCE FUNDS) - INVESCO V.I. Small Cap Equity Fund Series I ialah Invesco Treasury Portfolio, Institutional Class (US:US8252524066) , Piper Sandler Companies (US:PIPR) , ITT Inc. (US:ITT) , Applied Industrial Technologies, Inc. (US:AIT) , and REV Group, Inc. (US:REVG) . Kedudukan baharu AIM VARIABLE INSURANCE FUNDS (INVESCO VARIABLE INSURANCE FUNDS) - INVESCO V.I. Small Cap Equity Fund Series I termasuk AeroVironment, Inc. (US:AVAV) , Crane Company (US:CR) , Stifel Financial Corp. (US:SF) , Abercrombie & Fitch Co. (US:ANF) , and DT Midstream, Inc. (US:DTM) .
Kenaikan Teratas Suku Tahun Ini
Kami menggunakan perubahan dalam peruntukan portfolio kerana ini adalah metrik yang paling bermakna. Perubahan boleh disebabkan oleh perdagangan atau perubahan dalam harga saham.
| Sekuriti | Saham (MM) |
Nilai (MM$) |
Portfolio % | ΔPortfolio % |
|---|---|---|---|---|
| 26.45 | 26.45 | 11.4135 | 11.4135 | |
| 10.14 | 10.14 | 4.3774 | 4.3774 | |
| 6.14 | 6.14 | 2.6498 | 2.0034 | |
| 0.01 | 3.87 | 1.6700 | 1.6700 | |
| 3.31 | 3.31 | 1.4267 | 1.0788 | |
| 0.01 | 2.49 | 1.0735 | 1.0735 | |
| 0.02 | 2.45 | 1.0565 | 1.0565 | |
| 0.03 | 2.44 | 1.0536 | 1.0536 | |
| 0.02 | 2.32 | 1.0021 | 1.0021 | |
| 0.01 | 2.18 | 0.9397 | 0.9397 |
Penurunan Teratas Suku Tahun Ini
Kami menggunakan perubahan dalam peruntukan portfolio kerana ini adalah metrik yang paling bermakna. Perubahan boleh disebabkan oleh perdagangan atau perubahan dalam harga saham.
| Sekuriti | Saham (MM) |
Nilai (MM$) |
Portfolio % | ΔPortfolio % |
|---|---|---|---|---|
| 0.01 | 2.19 | 0.9451 | -1.1811 | |
| 0.02 | 2.68 | 1.1548 | -0.7551 | |
| 0.05 | 2.40 | 1.0353 | -0.6865 | |
| 0.05 | 2.26 | 0.9745 | -0.4909 | |
| 0.03 | 2.31 | 0.9987 | -0.4260 | |
| 0.10 | 2.05 | 0.8837 | -0.3523 | |
| 0.02 | 1.91 | 0.8240 | -0.2913 | |
| 0.05 | 2.52 | 1.0860 | -0.2583 | |
| 0.00 | 1.91 | 0.8222 | -0.2558 | |
| 0.02 | 2.24 | 0.9664 | -0.2440 |
13F dan Pemfailan Dana
Borang ini telah difailkan pada 2025-08-27 untuk tempoh pelaporan 2025-06-30. Klik ikon pautan untuk melihat sejarah transaksi penuh.
Tingkatkan untuk membuka data premium dan eksport ke Excel ![]() .
.
| Sekuriti | Jenis | Purata Harga Saham | Saham (MM) |
ΔSaham (%) |
ΔSaham (%) |
Nilai ($MM) |
Portfolio (%) |
ΔPortfolio (%) |
|
|---|---|---|---|---|---|---|---|---|---|
| Invesco Private Prime Fund / STIV (N/A) | 26.45 | 26.45 | 11.4135 | 11.4135 | |||||
| Invesco Private Government Fund / STIV (N/A) | 10.14 | 10.14 | 4.3774 | 4.3774 | |||||
| US8252524066 / Invesco Treasury Portfolio, Institutional Class | 6.14 | 352.68 | 6.14 | 352.88 | 2.6498 | 2.0034 | |||
| PIPR / Piper Sandler Companies | 0.02 | -2.72 | 4.43 | 9.17 | 1.9118 | -0.0220 | |||
| ITT / ITT Inc. | 0.03 | -2.72 | 4.30 | 18.12 | 1.8535 | 0.1206 | |||
| AIT / Applied Industrial Technologies, Inc. | 0.02 | -2.72 | 4.27 | 0.35 | 1.8439 | -0.1854 | |||
| REVG / REV Group, Inc. | 0.08 | -2.72 | 4.01 | 46.55 | 1.7321 | 0.4264 | |||
| EHC / Encompass Health Corporation | 0.03 | -2.72 | 4.01 | 17.79 | 1.7284 | 0.1079 | |||
| PNFP / Pinnacle Financial Partners, Inc. | 0.04 | -2.72 | 3.97 | 1.30 | 1.7150 | -0.1549 | |||
| AVAV / AeroVironment, Inc. | 0.01 | 3.87 | 1.6700 | 1.6700 | |||||
| TBBK / The Bancorp, Inc. | 0.07 | -2.72 | 3.86 | 4.89 | 1.6665 | -0.0882 | |||
| SKWD / Skyward Specialty Insurance Group, Inc. | 0.06 | -2.72 | 3.69 | 6.22 | 1.5920 | -0.0630 | |||
| FLEX / Flex Ltd. | 0.07 | -2.72 | 3.68 | 46.79 | 1.5882 | 0.3934 | |||
| BTSG / BrightSpring Health Services, Inc. | 0.15 | -2.72 | 3.54 | 26.87 | 1.5258 | 0.1975 | |||
| ATI / ATI Inc. | 0.04 | -2.72 | 3.49 | 61.46 | 1.5080 | 0.4764 | |||
| CVLT / Commvault Systems, Inc. | 0.02 | -2.72 | 3.49 | 7.49 | 1.5054 | -0.0411 | |||
| TLN / Talen Energy Corporation | 0.01 | -2.72 | 3.36 | 41.70 | 1.4516 | 0.3200 | |||
| XPO / XPO, Inc. | 0.03 | -2.72 | 3.35 | 14.17 | 1.4468 | 0.0477 | |||
| US8252528851 / Invesco Government & Agency Portfolio, Institutional Class | 3.31 | 352.84 | 3.31 | 352.88 | 1.4267 | 1.0788 | |||
| MTSI / MACOM Technology Solutions Holdings, Inc. | 0.02 | -2.72 | 3.28 | 38.89 | 1.4134 | 0.2894 | |||
| THC / Tenet Healthcare Corporation | 0.02 | -2.72 | 3.00 | 27.32 | 1.2934 | 0.1713 | |||
| CW / Curtiss-Wright Corporation | 0.01 | -35.46 | 2.99 | 16.32 | 1.2893 | 0.1040 | |||
| SANM / Sanmina Corporation | 0.03 | -2.72 | 2.96 | 24.91 | 1.2771 | 0.1481 | |||
| BGC / BGC Group, Inc. | 0.29 | -2.72 | 2.94 | 8.53 | 1.2683 | -0.0223 | |||
| HURN / Huron Consulting Group Inc. | 0.02 | -2.72 | 2.92 | -6.72 | 1.2584 | -0.2315 | |||
| WAL / Western Alliance Bancorporation | 0.04 | -2.72 | 2.90 | -1.29 | 1.2513 | -0.1483 | |||
| TNL / Travel + Leisure Co. | 0.06 | -2.72 | 2.86 | 8.44 | 1.2362 | -0.0225 | |||
| FTDR / Frontdoor, Inc. | 0.05 | -2.72 | 2.84 | 49.24 | 1.2271 | 0.3190 | |||
| CAKE / The Cheesecake Factory Incorporated | 0.05 | -2.72 | 2.84 | 25.30 | 1.2270 | 0.1453 | |||
| CWST / Casella Waste Systems, Inc. | 0.02 | -2.72 | 2.82 | 0.68 | 1.2152 | -0.1181 | |||
| MASI / Masimo Corporation | 0.02 | -2.72 | 2.77 | -1.77 | 1.1973 | -0.1488 | |||
| CNM / Core & Main, Inc. | 0.05 | -2.72 | 2.76 | 21.55 | 1.1930 | 0.1089 | |||
| STVN / Stevanato Group S.p.A. | 0.11 | -2.72 | 2.76 | 16.39 | 1.1923 | 0.0609 | |||
| GFF / Griffon Corporation | 0.04 | -2.72 | 2.76 | -1.54 | 1.1895 | -0.1446 | |||
| SLAB / Silicon Laboratories Inc. | 0.02 | 46.13 | 2.71 | 91.40 | 1.1712 | 0.4951 | |||
| AR / Antero Resources Corporation | 0.07 | -2.72 | 2.71 | -3.11 | 1.1712 | -0.1637 | |||
| OLLI / Ollie's Bargain Outlet Holdings, Inc. | 0.02 | -41.04 | 2.68 | -33.22 | 1.1548 | -0.7551 | |||
| SSB / SouthState Corporation | 0.03 | -2.72 | 2.66 | -3.52 | 1.1482 | -0.1665 | |||
| QTWO / Q2 Holdings, Inc. | 0.03 | -2.72 | 2.66 | 13.80 | 1.1463 | 0.0338 | |||
| VIRT / Virtu Financial, Inc. | 0.06 | -2.72 | 2.65 | 14.27 | 1.1439 | 0.0387 | |||
| BANC / Banc of California, Inc. | 0.19 | -2.72 | 2.64 | -3.68 | 1.1393 | -0.1670 | |||
| STEP / StepStone Group Inc. | 0.05 | -2.72 | 2.63 | 3.38 | 1.1345 | -0.0775 | |||
| IESC / IES Holdings, Inc. | 0.01 | 56.11 | 2.60 | 180.17 | 1.1220 | 0.6796 | |||
| POWL / Powell Industries, Inc. | 0.01 | 87.81 | 2.60 | 132.20 | 1.1203 | 0.5871 | |||
| GLPI / Gaming and Leisure Properties, Inc. | 0.05 | -2.72 | 2.52 | -10.81 | 1.0860 | -0.2583 | |||
| SFM / Sprouts Farmers Market, Inc. | 0.02 | -2.72 | 2.50 | 4.90 | 1.0804 | -0.0567 | |||
| CR / Crane Company | 0.01 | 2.49 | 1.0735 | 1.0735 | |||||
| GTES / Gates Industrial Corporation plc | 0.11 | -2.72 | 2.46 | 21.67 | 1.0613 | 0.0982 | |||
| SF / Stifel Financial Corp. | 0.02 | 2.45 | 1.0565 | 1.0565 | |||||
| ANF / Abercrombie & Fitch Co. | 0.03 | 2.44 | 1.0536 | 1.0536 | |||||
| CDNA / CareDx, Inc | 0.12 | -2.72 | 2.40 | 7.09 | 1.0362 | -0.0324 | |||
| DRS / Leonardo DRS, Inc. | 0.05 | -53.03 | 2.40 | -33.60 | 1.0353 | -0.6865 | |||
| EGP / EastGroup Properties, Inc. | 0.01 | -2.72 | 2.37 | -7.73 | 1.0209 | -0.2007 | |||
| FOUR / Shift4 Payments, Inc. | 0.02 | -2.72 | 2.36 | 18.03 | 1.0171 | 0.0652 | |||
| DSGX / The Descartes Systems Group Inc. | 0.02 | -2.72 | 2.34 | -1.93 | 1.0086 | -0.1272 | |||
| DTM / DT Midstream, Inc. | 0.02 | 2.32 | 1.0021 | 1.0021 | |||||
| GOLF / Acushnet Holdings Corp. | 0.03 | -27.01 | 2.31 | -22.58 | 0.9987 | -0.4260 | |||
| KTB / Kontoor Brands, Inc. | 0.03 | -2.72 | 2.29 | 0.09 | 0.9875 | -0.1023 | |||
| ADMA / ADMA Biologics, Inc. | 0.12 | -2.72 | 2.27 | -10.68 | 0.9812 | -0.2324 | |||
| CHEF / The Chefs' Warehouse, Inc. | 0.04 | -2.72 | 2.27 | 14.01 | 0.9802 | 0.0305 | |||
| WCC / WESCO International, Inc. | 0.01 | -2.72 | 2.26 | 16.02 | 0.9750 | 0.0468 | |||
| X / TMX Group Limited | 0.05 | -36.74 | 2.26 | -26.55 | 0.9745 | -0.4909 | |||
| PATK / Patrick Industries, Inc. | 0.02 | -19.20 | 2.24 | -11.85 | 0.9664 | -0.2440 | |||
| APPF / AppFolio, Inc. | 0.01 | -2.72 | 2.22 | 1.88 | 0.9595 | -0.0807 | |||
| VCEL / Vericel Corporation | 0.05 | -2.72 | 2.22 | -7.23 | 0.9577 | -0.1824 | |||
| ASND / Ascendis Pharma A/S - Depositary Receipt (Common Stock) | 0.01 | -2.72 | 2.20 | 7.72 | 0.9513 | -0.0239 | |||
| STAG / STAG Industrial, Inc. | 0.06 | -2.72 | 2.19 | -2.28 | 0.9452 | -0.1231 | |||
| COOP / Mr. Cooper Group Inc. | 0.01 | -60.65 | 2.19 | -50.91 | 0.9451 | -1.1811 | |||
| LOPE / Grand Canyon Education, Inc. | 0.01 | 2.18 | 0.9397 | 0.9397 | |||||
| MRX / Marex Group plc | 0.05 | 2.13 | 0.9182 | 0.9182 | |||||
| DFIN / Donnelley Financial Solutions, Inc. | 0.03 | -2.72 | 2.08 | 37.24 | 0.8985 | 0.1753 | |||
| RRC / Range Resources Corporation | 0.05 | 2.08 | 0.8965 | 0.8965 | |||||
| BWIN / The Baldwin Insurance Group, Inc. | 0.05 | -2.72 | 2.07 | -6.81 | 0.8917 | -0.1650 | |||
| GPK / Graphic Packaging Holding Company | 0.10 | -2.72 | 2.05 | -21.02 | 0.8837 | -0.3523 | |||
| KNF / Knife River Corporation | 0.03 | -2.72 | 2.04 | -11.94 | 0.8812 | -0.2242 | |||
| RGEN / Repligen Corporation | 0.02 | -2.72 | 2.04 | -4.90 | 0.8788 | -0.1417 | |||
| PBH / Prestige Consumer Healthcare Inc. | 0.03 | -2.72 | 2.01 | -9.65 | 0.8689 | -0.1931 | |||
| WDFC / WD-40 Company | 0.01 | -2.71 | 1.98 | -9.10 | 0.8535 | -0.1830 | |||
| POWI / Power Integrations, Inc. | 0.04 | -2.72 | 1.97 | 7.67 | 0.8485 | -0.0217 | |||
| EXLS / ExlService Holdings, Inc. | 0.04 | 1.92 | 0.8271 | 0.8271 | |||||
| LNTH / Lantheus Holdings, Inc. | 0.02 | -2.72 | 1.91 | -18.42 | 0.8240 | -0.2913 | |||
| MUSA / Murphy USA Inc. | 0.00 | -2.72 | 1.91 | -15.78 | 0.8222 | -0.2558 | |||
| SPXC / SPX Technologies, Inc. | 0.01 | -2.72 | 1.89 | 26.66 | 0.8161 | 0.1046 | |||
| NMRK / Newmark Group, Inc. | 0.15 | -2.72 | 1.80 | -2.86 | 0.7765 | -0.1065 | |||
| MBIN / Merchants Bancorp | 0.05 | -2.72 | 1.65 | -13.03 | 0.7112 | -0.1921 | |||
| ENS / EnerSys | 0.02 | -2.72 | 1.46 | -8.90 | 0.6321 | -0.1341 | |||
| IOSP / Innospec Inc. | 0.02 | -2.72 | 1.44 | -13.66 | 0.6219 | -0.1736 | |||
| AXSM / Axsome Therapeutics, Inc. | 0.01 | -2.71 | 1.43 | -12.98 | 0.6166 | -0.1654 | |||
| HALO / Halozyme Therapeutics, Inc. | 0.02 | 1.04 | 0.4501 | 0.4501 |