Statistik Asas
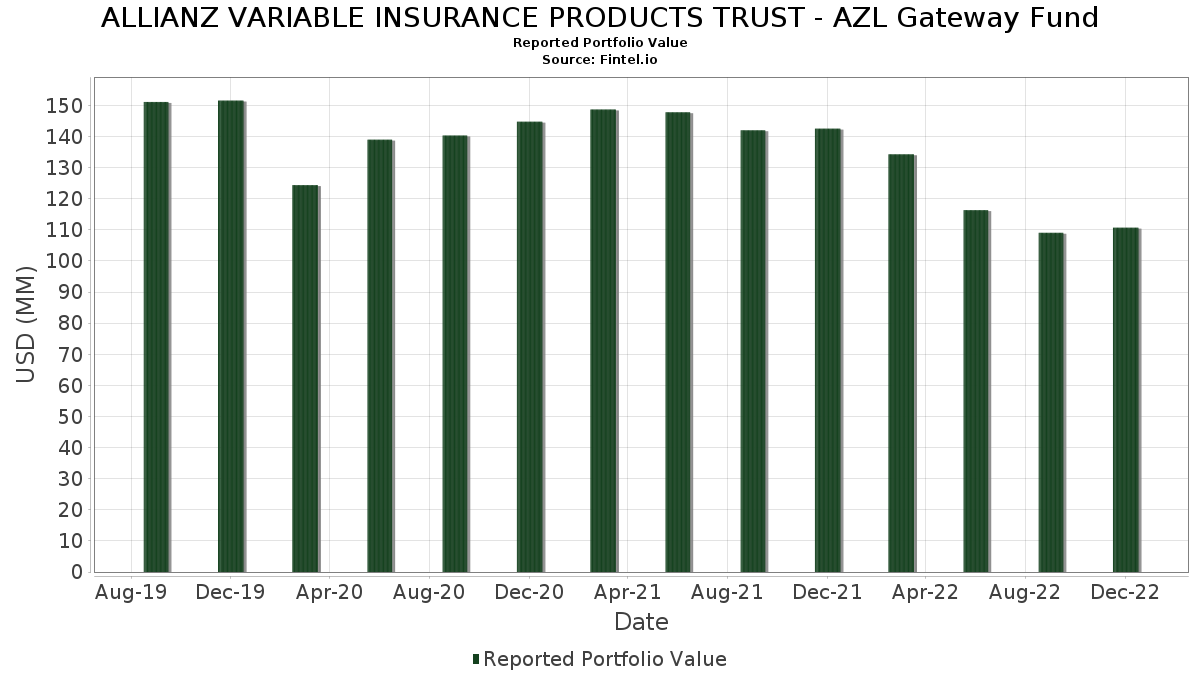
| Nilai Portfolio | $ 110,693,176 |
| Kedudukan Semasa | 304 |
Pegangan Terkini, Prestasi, AUM (dari 13F, 13D)
ALLIANZ VARIABLE INSURANCE PRODUCTS TRUST - AZL Gateway Fund telah mendedahkan 304 jumlah pegangan dalam pemfailan SEC terkini mereka. Nilai portfolio terkini dikira sebagai $ 110,693,176 USD. Aset Sebenar Di Bawah Pengurusan (AUM) ialah nilai ini ditambah dengan tunai (yang tidak didedahkan). Pegangan teratas ALLIANZ VARIABLE INSURANCE PRODUCTS TRUST - AZL Gateway Fund ialah Apple Inc. (US:AAPL) , Microsoft Corporation (US:MSFT) , Dreyfus Treasury Securities Cash Management - Dreyfus Treasury Securities Cash Management Institutional Shares (US:DIRXX) , Alphabet Inc. (US:GOOG) , and Amazon.com, Inc. (US:AMZN) . Kedudukan baharu ALLIANZ VARIABLE INSURANCE PRODUCTS TRUST - AZL Gateway Fund termasuk Prologis, Inc. (US:PLD) , Constellation Energy Corporation (US:CEG) , PG&E Corporation (US:PCG) , EQT Corporation (US:EQT) , and LPL Financial Holdings Inc. (US:LPLA) .
Kenaikan Teratas Suku Tahun Ini
Kami menggunakan perubahan dalam peruntukan portfolio kerana ini adalah metrik yang paling bermakna. Perubahan boleh disebabkan oleh perdagangan atau perubahan dalam harga saham.
| Sekuriti | Saham (MM) |
Nilai (MM$) |
Portfolio % | ΔPortfolio % |
|---|---|---|---|---|
| 0.25 | 0.2238 | 0.5034 | ||
| 0.22 | 0.1995 | 0.4792 | ||
| 0.13 | 0.1176 | 0.3973 | ||
| 0.12 | 0.1120 | 0.3917 | ||
| 0.12 | 0.1120 | 0.3917 | ||
| 0.10 | 0.0860 | 0.3657 | ||
| 0.06 | 0.0577 | 0.3373 | ||
| 0.01 | 1.72 | 1.5509 | 0.3063 | |
| 0.00 | 0.32 | 0.2929 | 0.2929 | |
| -0.01 | -0.0130 | 0.2666 |
Penurunan Teratas Suku Tahun Ini
Kami menggunakan perubahan dalam peruntukan portfolio kerana ini adalah metrik yang paling bermakna. Perubahan boleh disebabkan oleh perdagangan atau perubahan dalam harga saham.
| Sekuriti | Saham (MM) |
Nilai (MM$) |
Portfolio % | ΔPortfolio % |
|---|---|---|---|---|
| 0.01 | 1.04 | 0.9407 | -1.1456 | |
| 0.03 | 2.50 | 2.2571 | -0.8675 | |
| 0.05 | 6.81 | 6.1498 | -0.6910 | |
| 3.54 | 3.54 | 3.2028 | -0.5598 | |
| 0.03 | 2.61 | 2.3570 | -0.3843 | |
| 0.01 | 0.96 | 0.8696 | -0.1408 | |
| 0.01 | 0.64 | 0.5819 | -0.1398 | |
| 0.00 | 0.65 | 0.5878 | -0.1240 | |
| -0.43 | -0.3916 | -0.1120 | ||
| -0.42 | -0.3790 | -0.0994 |
13F dan Pemfailan Dana
Borang ini telah difailkan pada 2023-02-27 untuk tempoh pelaporan 2022-12-31. Klik ikon pautan untuk melihat sejarah transaksi penuh.
Tingkatkan untuk membuka data premium dan eksport ke Excel ![]() .
.
| Sekuriti | Jenis | Purata Harga Saham | Saham (MM) |
ΔSaham (%) |
ΔSaham (%) |
Nilai ($MM) |
Portfolio (%) |
ΔPortfolio (%) |
|
|---|---|---|---|---|---|---|---|---|---|
| AAPL / Apple Inc. | 0.05 | -3.18 | 6.81 | -8.98 | 6.1498 | -0.6910 | |||
| MSFT / Microsoft Corporation | 0.03 | -1.59 | 6.20 | 1.34 | 5.5980 | 0.0043 | |||
| DIRXX / Dreyfus Treasury Securities Cash Management - Dreyfus Treasury Securities Cash Management Institutional Shares | 3.54 | -13.81 | 3.54 | -13.81 | 3.2028 | -0.5598 | |||
| GOOG / Alphabet Inc. | 0.03 | -5.66 | 2.61 | -12.95 | 2.3570 | -0.3843 | |||
| AMZN / Amazon.com, Inc. | 0.03 | -1.60 | 2.50 | -26.86 | 2.2571 | -0.8675 | |||
| BRK.B / Berkshire Hathaway Inc. | 0.01 | -1.88 | 2.19 | 13.52 | 1.9813 | 0.2139 | |||
| UNH / UnitedHealth Group Incorporated | 0.00 | -1.87 | 1.97 | 2.97 | 1.7836 | 0.0304 | |||
| XOM / Exxon Mobil Corporation | 0.02 | -4.48 | 1.74 | 20.69 | 1.5711 | 0.2527 | |||
| JPM / JPMorgan Chase & Co. | 0.01 | -1.67 | 1.72 | 26.18 | 1.5509 | 0.3063 | |||
| JNJ / Johnson & Johnson | 0.01 | -1.65 | 1.68 | 6.31 | 1.5225 | 0.0729 | |||
| PG / The Procter & Gamble Company | 0.01 | -2.04 | 1.64 | 17.63 | 1.4776 | 0.2053 | |||
| HD / The Home Depot, Inc. | 0.00 | -1.71 | 1.33 | 12.47 | 1.1988 | 0.1199 | |||
| V / Visa Inc. | 0.01 | -1.88 | 1.28 | 14.77 | 1.1591 | 0.1363 | |||
| CVX / Chevron Corporation | 0.01 | -6.10 | 1.27 | 17.38 | 1.1480 | 0.1571 | |||
| PEP / PepsiCo, Inc. | 0.01 | -9.43 | 1.26 | 0.16 | 1.1403 | -0.0117 | |||
| NVDA / NVIDIA Corporation | 0.01 | -1.92 | 1.26 | 18.11 | 1.1379 | 0.1621 | |||
| BAC / Bank of America Corporation | 0.03 | -8.77 | 1.16 | 0.09 | 1.0457 | -0.0126 | |||
| LLY / Eli Lilly and Company | 0.00 | -1.85 | 1.13 | 11.05 | 1.0175 | 0.0897 | |||
| MA / Mastercard Incorporated | 0.00 | -1.98 | 1.12 | 19.91 | 1.0121 | 0.1572 | |||
| MRK / Merck & Co., Inc. | 0.01 | -1.84 | 1.09 | 26.43 | 0.9816 | 0.1956 | |||
| ABBV / AbbVie Inc. | 0.01 | -1.70 | 1.06 | 18.37 | 0.9612 | 0.1389 | |||
| PFE / Pfizer Inc. | 0.02 | -1.83 | 1.06 | 15.03 | 0.9544 | 0.1137 | |||
| TSLA / Tesla, Inc. | 0.01 | -1.69 | 1.04 | -54.39 | 0.9407 | -1.1456 | |||
| CSCO / Cisco Systems, Inc. | 0.02 | -2.01 | 0.97 | 16.63 | 0.8753 | 0.1159 | |||
| META / Meta Platforms, Inc. | 0.01 | -1.74 | 0.96 | -12.86 | 0.8696 | -0.1408 | |||
| AVGO / Broadcom Inc. | 0.00 | -1.97 | 0.92 | 23.55 | 0.8296 | 0.1491 | |||
| TMO / Thermo Fisher Scientific Inc. | 0.00 | -2.01 | 0.91 | 6.41 | 0.8250 | 0.0398 | |||
| RTX / RTX Corporation | 0.01 | -2.75 | 0.91 | 20.03 | 0.8233 | 0.1280 | |||
| MCD / McDonald's Corporation | 0.00 | 0.00 | 0.88 | 14.23 | 0.7913 | 0.0898 | |||
| WFC / Wells Fargo & Company | 0.02 | -2.01 | 0.87 | 0.58 | 0.7897 | -0.0052 | |||
| COP / ConocoPhillips | 0.01 | 0.00 | 0.85 | 15.31 | 0.7695 | 0.0937 | |||
| ABT / Abbott Laboratories | 0.01 | -2.57 | 0.83 | 10.56 | 0.7475 | 0.0628 | |||
| GOOGL / Alphabet Inc. | 0.01 | 0.00 | 0.82 | -7.74 | 0.7432 | -0.0726 | |||
| COST / Costco Wholesale Corporation | 0.00 | -2.41 | 0.81 | -5.58 | 0.7338 | -0.0539 | |||
| WMT / Walmart Inc. | 0.01 | 0.00 | 0.79 | 9.28 | 0.7138 | 0.0527 | |||
| VZ / Verizon Communications Inc. | 0.02 | -2.14 | 0.79 | 1.55 | 0.7098 | 0.0020 | |||
| MDLZ / Mondelez International, Inc. | 0.01 | 0.00 | 0.77 | 21.59 | 0.6928 | 0.1157 | |||
| HON / Honeywell International Inc. | 0.00 | 0.00 | 0.76 | 28.21 | 0.6867 | 0.1449 | |||
| ANTM / Anthem Inc | 0.00 | 0.00 | 0.71 | 12.92 | 0.6401 | 0.0662 | |||
| TXN / Texas Instruments Incorporated | 0.00 | -1.83 | 0.70 | 4.79 | 0.6332 | 0.0214 | |||
| AFL / Aflac Incorporated | 0.01 | 0.00 | 0.69 | 28.10 | 0.6263 | 0.1309 | |||
| BMY / Bristol-Myers Squibb Company | 0.01 | 0.00 | 0.69 | 1.33 | 0.6208 | -0.0003 | |||
| LOW / Lowe's Companies, Inc. | 0.00 | -2.21 | 0.69 | 3.78 | 0.6202 | 0.0148 | |||
| DIS / The Walt Disney Company | 0.01 | -2.30 | 0.68 | -10.00 | 0.6102 | -0.0764 | |||
| ADBE / Adobe Inc. | 0.00 | -2.21 | 0.67 | 19.46 | 0.6052 | 0.0927 | |||
| ACN / Accenture plc | 0.00 | 0.00 | 0.66 | 3.76 | 0.5985 | 0.0141 | |||
| MS / Morgan Stanley | 0.01 | -2.44 | 0.66 | 4.94 | 0.5955 | 0.0211 | |||
| CAT / Caterpillar Inc. | 0.00 | 0.00 | 0.65 | 45.96 | 0.5888 | 0.1805 | |||
| DHR / Danaher Corporation | 0.00 | -18.63 | 0.65 | -16.34 | 0.5878 | -0.1240 | |||
| AEP / American Electric Power Company, Inc. | 0.01 | -25.67 | 0.64 | -18.40 | 0.5819 | -0.1398 | |||
| CMCSA / Comcast Corporation | 0.02 | -2.18 | 0.64 | 16.55 | 0.5798 | 0.0764 | |||
| NKE / NIKE, Inc. | 0.01 | -2.80 | 0.63 | 37.06 | 0.5648 | 0.1468 | |||
| UPS / United Parcel Service, Inc. | 0.00 | 0.00 | 0.62 | 7.59 | 0.5641 | 0.0333 | |||
| MO / Altria Group, Inc. | 0.01 | 0.00 | 0.62 | 13.24 | 0.5572 | 0.0588 | |||
| CVS / CVS Health Corporation | 0.01 | -2.46 | 0.61 | -4.67 | 0.5532 | -0.0345 | |||
| AMGN / Amgen Inc. | 0.00 | -1.98 | 0.58 | 14.29 | 0.5281 | 0.0599 | |||
| SCHW / The Charles Schwab Corporation | 0.01 | -2.02 | 0.58 | 13.56 | 0.5227 | 0.0564 | |||
| AJG / Arthur J. Gallagher & Co. | 0.00 | -2.98 | 0.58 | 6.85 | 0.5218 | 0.0273 | |||
| ORCL / Oracle Corporation | 0.01 | -9.52 | 0.56 | 21.04 | 0.5048 | 0.0827 | |||
| ADP / Automatic Data Processing, Inc. | 0.00 | 0.00 | 0.56 | 5.69 | 0.5033 | 0.0207 | |||
| DE / Deere & Company | 0.00 | 0.00 | 0.56 | 28.41 | 0.5033 | 0.1064 | |||
| ED / Consolidated Edison, Inc. | 0.01 | 0.00 | 0.55 | 11.11 | 0.4979 | 0.0443 | |||
| NFLX / Netflix, Inc. | 0.00 | -2.03 | 0.54 | 22.68 | 0.4892 | 0.0855 | |||
| WM / Waste Management, Inc. | 0.00 | -2.83 | 0.53 | -4.86 | 0.4774 | -0.0306 | |||
| SPGI / S&P Global Inc. | 0.00 | 0.00 | 0.53 | 9.60 | 0.4752 | 0.0365 | |||
| AON / Aon plc | 0.00 | -2.54 | 0.51 | 9.29 | 0.4578 | 0.0333 | |||
| BA / The Boeing Company | 0.00 | 0.00 | 0.50 | 57.46 | 0.4484 | 0.1598 | |||
| AMT / American Tower Corporation | 0.00 | -2.65 | 0.48 | -3.98 | 0.4359 | -0.0236 | |||
| QCOM / QUALCOMM Incorporated | 0.00 | -1.97 | 0.48 | -4.55 | 0.4358 | -0.0268 | |||
| ISRG / Intuitive Surgical, Inc. | 0.00 | 0.00 | 0.48 | 41.79 | 0.4297 | 0.1223 | |||
| WEC / WEC Energy Group, Inc. | 0.01 | -5.40 | 0.47 | -0.84 | 0.4279 | -0.0089 | |||
| AEE / Ameren Corporation | 0.01 | 0.00 | 0.47 | 10.43 | 0.4216 | 0.0349 | |||
| MDT / Medtronic plc | 0.01 | -2.86 | 0.47 | -6.44 | 0.4205 | -0.0349 | |||
| CRM / Salesforce, Inc. | 0.00 | 0.00 | 0.47 | -7.74 | 0.4203 | -0.0414 | |||
| HAL / Halliburton Company | 0.01 | 0.00 | 0.46 | 59.86 | 0.4183 | 0.1533 | |||
| ADI / Analog Devices, Inc. | 0.00 | 0.00 | 0.46 | 17.56 | 0.4181 | 0.0585 | |||
| ETN / Eaton Corporation plc | 0.00 | -10.08 | 0.46 | 5.73 | 0.4174 | 0.0180 | |||
| PH / Parker-Hannifin Corporation | 0.00 | -4.92 | 0.44 | 14.06 | 0.3963 | 0.0449 | |||
| CSX / CSX Corporation | 0.01 | 0.00 | 0.43 | 16.17 | 0.3901 | 0.0504 | |||
| BSX / Boston Scientific Corporation | 0.01 | 0.00 | 0.43 | 19.38 | 0.3844 | 0.0586 | |||
| BKNG / Booking Holdings Inc. | 0.00 | -3.21 | 0.43 | 18.72 | 0.3842 | 0.0565 | |||
| AMD / Advanced Micro Devices, Inc. | 0.01 | -2.55 | 0.42 | -0.48 | 0.3782 | -0.0062 | |||
| ICE / Intercontinental Exchange, Inc. | 0.00 | 0.00 | 0.42 | 13.32 | 0.3777 | 0.0409 | |||
| INTC / Intel Corporation | 0.02 | 0.00 | 0.42 | 2.46 | 0.3775 | 0.0048 | |||
| KDP / Keurig Dr Pepper Inc. | 0.01 | -3.66 | 0.41 | -4.01 | 0.3683 | -0.0205 | |||
| MMM / 3M Company | 0.00 | -3.19 | 0.40 | 5.04 | 0.3582 | 0.0130 | |||
| HLT / Hilton Worldwide Holdings Inc. | 0.00 | -4.99 | 0.39 | -0.51 | 0.3562 | -0.0062 | |||
| ORLY / O'Reilly Automotive, Inc. | 0.00 | 0.00 | 0.38 | 20.06 | 0.3409 | 0.0533 | |||
| TGT / Target Corporation | 0.00 | -2.36 | 0.37 | -1.86 | 0.3345 | -0.0109 | |||
| CDNS / Cadence Design Systems, Inc. | 0.00 | 0.00 | 0.36 | -1.63 | 0.3266 | -0.0098 | |||
| MNST / Monster Beverage Corporation | 0.00 | 0.00 | 0.36 | 16.78 | 0.3212 | 0.0426 | |||
| CMI / Cummins Inc. | 0.00 | -3.94 | 0.35 | 14.56 | 0.3201 | 0.0367 | |||
| PYPL / PayPal Holdings, Inc. | 0.00 | 0.00 | 0.35 | -17.37 | 0.3188 | -0.0713 | |||
| VRTX / Vertex Pharmaceuticals Incorporated | 0.00 | 0.00 | 0.35 | -0.28 | 0.3165 | -0.0048 | |||
| HCA / HCA Healthcare, Inc. | 0.00 | 0.00 | 0.35 | 30.71 | 0.3157 | 0.0709 | |||
| PEG / Public Service Enterprise Group Incorporated | 0.01 | 0.00 | 0.35 | 8.75 | 0.3152 | 0.0223 | |||
| LHX / L3Harris Technologies, Inc. | 0.00 | 0.00 | 0.34 | 0.29 | 0.3086 | -0.0033 | |||
| NOW / ServiceNow, Inc. | 0.00 | 0.00 | 0.34 | 3.03 | 0.3073 | 0.0047 | |||
| CTVA / Corteva, Inc. | 0.01 | 0.00 | 0.33 | 2.84 | 0.2955 | 0.0046 | |||
| PLD / Prologis, Inc. | 0.00 | 0.32 | 0.2929 | 0.2929 | |||||
| MSCI / MSCI Inc. | 0.00 | 0.00 | 0.32 | 10.34 | 0.2892 | 0.0237 | |||
| PAYX / Paychex, Inc. | 0.00 | 0.00 | 0.31 | 3.02 | 0.2778 | 0.0047 | |||
| GPC / Genuine Parts Company | 0.00 | 0.00 | 0.30 | 16.48 | 0.2748 | 0.0353 | |||
| DFS / Discover Financial Services | 0.00 | -4.63 | 0.30 | 2.78 | 0.2679 | 0.0036 | |||
| LNT / Alliant Energy Corporation | 0.01 | 0.00 | 0.29 | 4.26 | 0.2659 | 0.0075 | |||
| GE / General Electric Company | 0.00 | -34.46 | 0.29 | -11.21 | 0.2648 | -0.0375 | |||
| CDW / CDW Corporation | 0.00 | 0.00 | 0.29 | 14.46 | 0.2579 | 0.0297 | |||
| OKE / ONEOK, Inc. | 0.00 | -5.56 | 0.27 | 21.62 | 0.2440 | 0.0400 | |||
| EW / Edwards Lifesciences Corporation | 0.00 | 0.00 | 0.27 | -9.46 | 0.2423 | -0.0294 | |||
| MLM / Martin Marietta Materials, Inc. | 0.00 | -6.35 | 0.26 | -1.49 | 0.2388 | -0.0073 | |||
| AMAT / Applied Materials, Inc. | 0.00 | -40.17 | 0.25 | -28.93 | 0.2289 | -0.0970 | |||
| MU / Micron Technology, Inc. | 0.01 | 0.00 | 0.25 | -0.40 | 0.2267 | -0.0034 | |||
| FE / FirstEnergy Corp. | 0.01 | 0.00 | 0.25 | 13.30 | 0.2238 | 0.0239 | |||
| S P 500 INDEX PUT OPTION / DE (N/A) | 0.25 | -158.53 | 0.2238 | 0.5034 | |||||
| DOW / Dow Inc. | 0.00 | 0.00 | 0.24 | 14.55 | 0.2210 | 0.0259 | |||
| ACGL / Arch Capital Group Ltd. | 0.00 | 96.96 | 0.24 | 173.03 | 0.2205 | 0.1382 | |||
| SYF / Synchrony Financial | 0.01 | 0.00 | 0.24 | 16.27 | 0.2202 | 0.0289 | |||
| CPRT / Copart, Inc. | 0.00 | 100.00 | 0.24 | 14.69 | 0.2188 | 0.0252 | |||
| VRSN / VeriSign, Inc. | 0.00 | -4.47 | 0.24 | 13.15 | 0.2183 | 0.0227 | |||
| CARR / Carrier Global Corporation | 0.01 | -27.40 | 0.24 | -16.07 | 0.2131 | -0.0431 | |||
| OXY / Occidental Petroleum Corporation | 0.00 | -12.41 | 0.23 | -10.28 | 0.2056 | -0.0263 | |||
| F / Ford Motor Company | 0.02 | 0.00 | 0.23 | 3.67 | 0.2048 | 0.0051 | |||
| MRNA / Moderna, Inc. | 0.00 | 0.00 | 0.23 | 52.70 | 0.2043 | 0.0681 | |||
| LYB / LyondellBasell Industries N.V. | 0.00 | -5.54 | 0.22 | 4.21 | 0.2021 | 0.0057 | |||
| VLO / Valero Energy Corporation | 0.00 | -29.79 | 0.22 | -16.60 | 0.1999 | -0.0429 | |||
| S P 500 INDEX PUT OPTION / DE (N/A) | 0.22 | -152.13 | 0.1995 | 0.4792 | |||||
| FIS / Fidelity National Information Services, Inc. | 0.00 | -3.53 | 0.22 | -13.49 | 0.1976 | -0.0334 | |||
| GM / General Motors Company | 0.01 | 0.00 | 0.22 | 4.83 | 0.1968 | 0.0067 | |||
| HRL / Hormel Foods Corporation | 0.00 | 0.00 | 0.21 | 0.00 | 0.1933 | -0.0020 | |||
| IT / Gartner, Inc. | 0.00 | 0.00 | 0.21 | 21.71 | 0.1926 | 0.0321 | |||
| INVH / Invitation Homes Inc. | 0.01 | 0.00 | 0.21 | -12.39 | 0.1859 | -0.0286 | |||
| KR / The Kroger Co. | 0.00 | 0.00 | 0.20 | 1.50 | 0.1843 | 0.0012 | |||
| GLW / Corning Incorporated | 0.01 | 0.00 | 0.20 | 10.33 | 0.1835 | 0.0147 | |||
| HUBB / Hubbell Incorporated | 0.00 | 0.00 | 0.20 | 5.29 | 0.1803 | 0.0068 | |||
| ODFL / Old Dominion Freight Line, Inc. | 0.00 | -34.18 | 0.20 | -25.00 | 0.1798 | -0.0627 | |||
| FDS / FactSet Research Systems Inc. | 0.00 | 0.00 | 0.19 | 0.00 | 0.1744 | -0.0017 | |||
| BIIB / Biogen Inc. | 0.00 | -27.69 | 0.19 | -25.10 | 0.1732 | -0.0606 | |||
| NVR / NVR, Inc. | 0.00 | 0.00 | 0.19 | 15.95 | 0.1709 | 0.0213 | |||
| TDY / Teledyne Technologies Incorporated | 0.00 | 0.00 | 0.18 | 18.24 | 0.1590 | 0.0231 | |||
| UDR / UDR, Inc. | 0.00 | 0.00 | 0.18 | -7.41 | 0.1587 | -0.0144 | |||
| ILMN / Illumina, Inc. | 0.00 | 0.00 | 0.18 | 6.06 | 0.1586 | 0.0071 | |||
| EMN / Eastman Chemical Company | 0.00 | 0.00 | 0.17 | 14.57 | 0.1566 | 0.0183 | |||
| CLX / The Clorox Company | 0.00 | 0.00 | 0.17 | 8.92 | 0.1553 | 0.0114 | |||
| STE / STERIS plc | 0.00 | 0.00 | 0.17 | 10.67 | 0.1509 | 0.0133 | |||
| UNM / Unum Group | 0.00 | -28.98 | 0.16 | -25.00 | 0.1469 | -0.0512 | |||
| CPT / Camden Property Trust | 0.00 | 0.00 | 0.16 | -6.43 | 0.1452 | -0.0118 | |||
| AVY / Avery Dennison Corporation | 0.00 | 0.00 | 0.16 | 11.27 | 0.1433 | 0.0129 | |||
| SUI / Sun Communities, Inc. | 0.00 | 0.00 | 0.16 | 5.37 | 0.1424 | 0.0059 | |||
| NNN / NNN REIT, Inc. | 0.00 | -11.72 | 0.16 | 1.29 | 0.1423 | 0.0001 | |||
| WCN / Waste Connections, Inc. | 0.00 | 0.00 | 0.16 | -1.89 | 0.1411 | -0.0045 | |||
| BAX / Baxter International Inc. | 0.00 | 0.00 | 0.16 | -5.49 | 0.1405 | -0.0098 | |||
| RPM / RPM International Inc. | 0.00 | 0.00 | 0.15 | 16.79 | 0.1389 | 0.0187 | |||
| TER / Teradyne, Inc. | 0.00 | 0.00 | 0.15 | 16.79 | 0.1384 | 0.0178 | |||
| UHS / Universal Health Services, Inc. | 0.00 | 0.00 | 0.15 | 60.22 | 0.1348 | 0.0494 | |||
| ELS / Equity LifeStyle Properties, Inc. | 0.00 | 0.00 | 0.15 | 2.76 | 0.1347 | 0.0020 | |||
| ASH / Ashland Inc. | 0.00 | 0.00 | 0.15 | 13.18 | 0.1328 | 0.0140 | |||
| AFG / American Financial Group, Inc. | 0.00 | 0.00 | 0.14 | 11.90 | 0.1279 | 0.0119 | |||
| NEM / Newmont Corporation | 0.00 | -33.53 | 0.14 | -25.53 | 0.1272 | -0.0453 | |||
| ZBRA / Zebra Technologies Corporation | 0.00 | 0.00 | 0.14 | -2.10 | 0.1267 | -0.0044 | |||
| CP / Canadian Pacific Kansas City Limited | 0.00 | 0.00 | 0.14 | 12.00 | 0.1266 | 0.0119 | |||
| EVRG / Evergy, Inc. | 0.00 | 0.00 | 0.14 | 6.15 | 0.1248 | 0.0055 | |||
| JBHT / J.B. Hunt Transport Services, Inc. | 0.00 | 0.00 | 0.14 | 11.38 | 0.1243 | 0.0114 | |||
| TRGP / Targa Resources Corp. | 0.00 | 202.82 | 0.13 | 272.22 | 0.1213 | 0.0880 | |||
| WPC / W. P. Carey Inc. | 0.00 | 0.00 | 0.13 | 11.76 | 0.1208 | 0.0116 | |||
| CEG / Constellation Energy Corporation | 0.00 | 0.13 | 0.1197 | 0.1197 | |||||
| VOYA / Voya Financial, Inc. | 0.00 | 0.00 | 0.13 | 1.54 | 0.1195 | 0.0004 | |||
| PCG / PG&E Corporation | 0.01 | 0.13 | 0.1192 | 0.1192 | |||||
| S P 500 INDEX PUT OPTION / DE (N/A) | 0.13 | -130.81 | 0.1176 | 0.3973 | |||||
| CSGP / CoStar Group, Inc. | 0.00 | 0.00 | 0.13 | 11.30 | 0.1159 | 0.0101 | |||
| SON / Sonoco Products Company | 0.00 | 0.00 | 0.13 | 6.84 | 0.1137 | 0.0061 | |||
| S P 500 INDEX PUT OPTION / DE (N/A) | 0.12 | -129.38 | 0.1120 | 0.3917 | |||||
| S P 500 INDEX PUT OPTION / DE (N/A) | 0.12 | -129.38 | 0.1120 | 0.3917 | |||||
| LNG / Cheniere Energy, Inc. | 0.00 | -19.51 | 0.12 | -27.38 | 0.1107 | -0.0434 | |||
| CE / Celanese Corporation | 0.00 | 0.00 | 0.12 | 13.33 | 0.1082 | 0.0114 | |||
| ALK / Alaska Air Group, Inc. | 0.00 | 0.00 | 0.12 | 9.43 | 0.1053 | 0.0081 | |||
| AMH / American Homes 4 Rent | 0.00 | -12.39 | 0.12 | -19.44 | 0.1052 | -0.0271 | |||
| SCCO / Southern Copper Corporation | 0.00 | 0.00 | 0.12 | 35.29 | 0.1043 | 0.0259 | |||
| LW / Lamb Weston Holdings, Inc. | 0.00 | 0.00 | 0.12 | 16.16 | 0.1043 | 0.0129 | |||
| HEI / HEICO Corporation | 0.00 | 0.00 | 0.11 | 6.93 | 0.0977 | 0.0050 | |||
| HGV / Hilton Grand Vacations Inc. | 0.00 | 0.00 | 0.11 | 16.30 | 0.0974 | 0.0132 | |||
| CVE / Cenovus Energy Inc. | 0.01 | 0.00 | 0.11 | 27.38 | 0.0969 | 0.0192 | |||
| OGE / OGE Energy Corp. | 0.00 | 0.00 | 0.10 | 8.33 | 0.0947 | 0.0063 | |||
| VVV / Valvoline Inc. | 0.00 | 0.00 | 0.10 | 28.40 | 0.0944 | 0.0202 | |||
| CUBE / CubeSmart | 0.00 | 0.00 | 0.10 | 0.98 | 0.0933 | -0.0007 | |||
| TOL / Toll Brothers, Inc. | 0.00 | 0.00 | 0.10 | 19.77 | 0.0933 | 0.0138 | |||
| BG / Bunge Global SA | 0.00 | 0.00 | 0.10 | 21.43 | 0.0927 | 0.0150 | |||
| LBTYK / Liberty Global Ltd. | 0.01 | 0.00 | 0.10 | 18.60 | 0.0922 | 0.0129 | |||
| TFX / Teleflex Incorporated | 0.00 | 0.00 | 0.10 | 24.69 | 0.0914 | 0.0167 | |||
| VMW / Vmware Inc. - Class A | 0.00 | 0.00 | 0.10 | 15.48 | 0.0881 | 0.0107 | |||
| ICLR / ICON Public Limited Company | 0.00 | 0.00 | 0.10 | 5.49 | 0.0876 | 0.0037 | |||
| ASB / Associated Banc-Corp | 0.00 | 0.00 | 0.10 | 14.29 | 0.0873 | 0.0104 | |||
| FDX / FedEx Corporation | 0.00 | -10.48 | 0.10 | 4.35 | 0.0869 | 0.0026 | |||
| S P 500 INDEX PUT OPTION / DE (N/A) | 0.10 | -122.51 | 0.0860 | 0.3657 | |||||
| MRVL / Marvell Technology, Inc. | 0.00 | 0.00 | 0.09 | -13.76 | 0.0852 | -0.0147 | |||
| CASY / Casey's General Stores, Inc. | 0.00 | -9.91 | 0.09 | 0.00 | 0.0847 | -0.0012 | |||
| LYV / Live Nation Entertainment, Inc. | 0.00 | 0.00 | 0.09 | -7.92 | 0.0844 | -0.0088 | |||
| UAL / United Airlines Holdings, Inc. | 0.00 | 0.00 | 0.09 | 16.25 | 0.0843 | 0.0106 | |||
| PANW / Palo Alto Networks, Inc. | 0.00 | 0.00 | 0.09 | -15.60 | 0.0840 | -0.0158 | |||
| MOS / The Mosaic Company | 0.00 | 0.00 | 0.09 | -9.80 | 0.0837 | -0.0097 | |||
| VEEV / Veeva Systems Inc. | 0.00 | 0.00 | 0.09 | -2.15 | 0.0828 | -0.0029 | |||
| WEN / The Wendy's Company | 0.00 | 0.00 | 0.09 | 21.62 | 0.0819 | 0.0134 | |||
| SBRA / Sabra Health Care REIT, Inc. | 0.01 | 0.00 | 0.09 | -5.32 | 0.0807 | -0.0056 | |||
| ETSY / Etsy, Inc. | 0.00 | 0.00 | 0.09 | 20.27 | 0.0807 | 0.0124 | |||
| MOH / Molina Healthcare, Inc. | 0.00 | 0.00 | 0.09 | 0.00 | 0.0800 | -0.0009 | |||
| EPAM / EPAM Systems, Inc. | 0.00 | 0.00 | 0.09 | -9.37 | 0.0791 | -0.0094 | |||
| PNR / Pentair plc | 0.00 | 0.00 | 0.09 | 11.54 | 0.0786 | 0.0067 | |||
| CDAY / Ceridian HCM Holding Inc. | 0.00 | 0.00 | 0.09 | 14.67 | 0.0783 | 0.0092 | |||
| BAH / Booz Allen Hamilton Holding Corporation | 0.00 | 0.00 | 0.09 | 13.33 | 0.0774 | 0.0082 | |||
| LII / Lennox International Inc. | 0.00 | 0.00 | 0.09 | 7.59 | 0.0772 | 0.0044 | |||
| HP / Helmerich & Payne, Inc. | 0.00 | 0.00 | 0.08 | 33.87 | 0.0758 | 0.0186 | |||
| MAN / ManpowerGroup Inc. | 0.00 | 0.00 | 0.08 | 27.69 | 0.0756 | 0.0161 | |||
| LULU / lululemon athletica inc. | 0.00 | 0.00 | 0.08 | 15.49 | 0.0744 | 0.0087 | |||
| CCK / Crown Holdings, Inc. | 0.00 | 0.00 | 0.08 | 1.23 | 0.0743 | 0.0001 | |||
| MPW / Medical Properties Trust, Inc. | 0.01 | 0.00 | 0.08 | -5.81 | 0.0738 | -0.0058 | |||
| POST / Post Holdings, Inc. | 0.00 | 0.00 | 0.08 | 9.46 | 0.0738 | 0.0060 | |||
| RNR / RenaissanceRe Holdings Ltd. | 0.00 | 0.00 | 0.08 | 32.79 | 0.0734 | 0.0168 | |||
| / Healthcare Realty Trust Inc | 0.00 | 0.00 | 0.08 | -8.05 | 0.0728 | -0.0070 | |||
| SCI / Service Corporation International | 0.00 | 0.00 | 0.08 | 19.70 | 0.0718 | 0.0111 | |||
| LNC / Lincoln National Corporation | 0.00 | 0.00 | 0.08 | -30.36 | 0.0711 | -0.0318 | |||
| TKR / The Timken Company | 0.00 | 0.00 | 0.08 | 18.46 | 0.0703 | 0.0108 | |||
| STLD / Steel Dynamics, Inc. | 0.00 | 0.00 | 0.08 | 37.50 | 0.0701 | 0.0186 | |||
| WDAY / Workday, Inc. | 0.00 | -53.64 | 0.08 | -49.33 | 0.0693 | -0.0684 | |||
| WRK / WestRock Company | 0.00 | -36.01 | 0.08 | -27.88 | 0.0685 | -0.0267 | |||
| JBLU / JetBlue Airways Corporation | 0.01 | 0.00 | 0.08 | -1.32 | 0.0680 | -0.0024 | |||
| GATX / GATX Corporation | 0.00 | 0.00 | 0.07 | 26.32 | 0.0652 | 0.0123 | |||
| EQT / EQT Corporation | 0.00 | 0.07 | 0.0625 | 0.0625 | |||||
| FL / Foot Locker, Inc. | 0.00 | 0.00 | 0.07 | 21.43 | 0.0621 | 0.0103 | |||
| USFD / US Foods Holding Corp. | 0.00 | 0.00 | 0.07 | 28.85 | 0.0614 | 0.0131 | |||
| MKL / Markel Group Inc. | 0.00 | 0.00 | 0.07 | 20.37 | 0.0595 | 0.0099 | |||
| SU / Suncor Energy Inc. | 0.00 | 0.00 | 0.07 | 12.07 | 0.0593 | 0.0060 | |||
| KKR / KKR & Co. Inc. | 0.00 | 0.00 | 0.06 | 8.47 | 0.0583 | 0.0036 | |||
| S P 500 INDEX PUT OPTION / DE (N/A) | 0.06 | -114.93 | 0.0577 | 0.3373 | |||||
| LPLA / LPL Financial Holdings Inc. | 0.00 | 0.06 | 0.0572 | 0.0572 | |||||
| NGVT / Ingevity Corporation | 0.00 | -13.82 | 0.06 | 0.00 | 0.0572 | -0.0006 | |||
| LUMN / Lumen Technologies, Inc. | 0.01 | 0.00 | 0.06 | -28.24 | 0.0555 | -0.0229 | |||
| BURL / Burlington Stores, Inc. | 0.00 | 0.00 | 0.06 | 84.85 | 0.0551 | 0.0243 | |||
| MTN / Vail Resorts, Inc. | 0.00 | 0.00 | 0.06 | 9.26 | 0.0541 | 0.0045 | |||
| SGEN / Seagen Inc | 0.00 | 0.00 | 0.06 | -6.56 | 0.0524 | -0.0041 | |||
| OLN / Olin Corporation | 0.00 | 0.00 | 0.06 | 23.91 | 0.0520 | 0.0094 | |||
| CSL / Carlisle Companies Incorporated | 0.00 | 0.06 | 0.0500 | 0.0500 | |||||
| AVTR / Avantor, Inc. | 0.00 | 0.00 | 0.05 | 8.16 | 0.0479 | 0.0028 | |||
| DXC / DXC Technology Company | 0.00 | 0.00 | 0.05 | 8.33 | 0.0475 | 0.0031 | |||
| ALLY / Ally Financial Inc. | 0.00 | 0.00 | 0.05 | -13.56 | 0.0469 | -0.0072 | |||
| US4039491000 / HF Sinclair Corp. | 0.00 | 0.00 | 0.05 | -3.85 | 0.0459 | -0.0023 | |||
| SIRI / Sirius XM Holdings Inc. | 0.01 | 0.00 | 0.05 | 2.04 | 0.0457 | 0.0005 | |||
| BX / Blackstone Inc. | 0.00 | 0.00 | 0.05 | -12.28 | 0.0457 | -0.0065 | |||
| HZNP / Horizon Therapeutics Plc | 0.00 | 0.05 | 0.0457 | 0.0457 | |||||
| ALV / Autoliv, Inc. | 0.00 | 0.00 | 0.05 | 16.28 | 0.0456 | 0.0054 | |||
| / Annaly Capital Management Inc | 0.00 | 0.00 | 0.05 | 22.50 | 0.0450 | 0.0079 | |||
| MELI / MercadoLibre, Inc. | 0.00 | 0.00 | 0.05 | 2.08 | 0.0444 | 0.0004 | |||
| SQ / Block, Inc. | 0.00 | -12.37 | 0.05 | 0.00 | 0.0438 | -0.0005 | |||
| / Aspen Technology, Inc. | 0.00 | 0.05 | 0.0427 | 0.0427 | |||||
| SBNY / Signature Bank | 0.00 | 0.00 | 0.05 | -22.95 | 0.0427 | -0.0140 | |||
| FNF / Fidelity National Financial, Inc. | 0.00 | 0.00 | 0.05 | 2.22 | 0.0423 | 0.0011 | |||
| DEI / Douglas Emmett, Inc. | 0.00 | 0.00 | 0.05 | -13.21 | 0.0422 | -0.0067 | |||
| TRU / TransUnion | 0.00 | 0.00 | 0.05 | -4.17 | 0.0419 | -0.0026 | |||
| UGI / UGI Corporation | 0.00 | 0.00 | 0.04 | 12.82 | 0.0406 | 0.0047 | |||
| NTR / Nutrien Ltd. | 0.00 | 0.00 | 0.04 | -12.00 | 0.0402 | -0.0063 | |||
| LBRDK / Liberty Broadband Corporation | 0.00 | 0.00 | 0.04 | 4.76 | 0.0401 | 0.0008 | |||
| BMRN / BioMarin Pharmaceutical Inc. | 0.00 | 0.00 | 0.04 | 22.22 | 0.0398 | 0.0068 | |||
| DELL / Dell Technologies Inc. | 0.00 | 0.00 | 0.04 | 16.22 | 0.0395 | 0.0055 | |||
| UBER / Uber Technologies, Inc. | 0.00 | 0.00 | 0.04 | -6.52 | 0.0389 | -0.0033 | |||
| SHOP / Shopify Inc. | 0.00 | 0.00 | 0.04 | 28.13 | 0.0377 | 0.0081 | |||
| KRC / Kilroy Realty Corporation | 0.00 | 0.00 | 0.04 | -9.09 | 0.0370 | -0.0038 | |||
| AEO / American Eagle Outfitters, Inc. | 0.00 | 0.00 | 0.04 | 42.86 | 0.0367 | 0.0108 | |||
| JAZZ / Jazz Pharmaceuticals plc | 0.00 | 0.00 | 0.04 | 18.18 | 0.0357 | 0.0055 | |||
| DKS / DICK'S Sporting Goods, Inc. | 0.00 | 0.00 | 0.04 | 14.71 | 0.0354 | 0.0042 | |||
| FSLR / First Solar, Inc. | 0.00 | 0.04 | 0.0349 | 0.0349 | |||||
| MLCO / Melco Resorts & Entertainment Limited - Depositary Receipt (Common Stock) | 0.00 | 0.00 | 0.03 | 78.95 | 0.0309 | 0.0129 | |||
| MTCH / Match Group, Inc. | 0.00 | 0.00 | 0.03 | -13.16 | 0.0304 | -0.0050 | |||
| PII / Polaris Inc. | 0.00 | 0.00 | 0.03 | 6.45 | 0.0302 | 0.0012 | |||
| WSM / Williams-Sonoma, Inc. | 0.00 | 0.00 | 0.03 | -3.03 | 0.0298 | -0.0011 | |||
| BKI / Black Knight Inc - Class A | 0.00 | 0.00 | 0.03 | -3.03 | 0.0293 | -0.0018 | |||
| IONS / Ionis Pharmaceuticals, Inc. | 0.00 | 0.00 | 0.03 | -16.22 | 0.0288 | -0.0054 | |||
| HLF / Herbalife Ltd. | 0.00 | 0.00 | 0.03 | -26.83 | 0.0279 | -0.0098 | |||
| ALNY / Alnylam Pharmaceuticals, Inc. | 0.00 | 0.00 | 0.03 | 20.00 | 0.0277 | 0.0041 | |||
| ZM / Zoom Communications Inc. | 0.00 | 0.00 | 0.03 | -9.09 | 0.0275 | -0.0028 | |||
| JWN / Nordstrom, Inc. | 0.00 | 0.00 | 0.03 | -3.45 | 0.0258 | -0.0013 | |||
| ZG / Zillow Group, Inc. | 0.00 | 0.00 | 0.03 | 12.50 | 0.0252 | 0.0025 | |||
| ENB / Enbridge Inc. | 0.00 | 0.00 | 0.03 | 4.17 | 0.0230 | 0.0009 | |||
| GXO / GXO Logistics, Inc. | 0.00 | 0.00 | 0.02 | 26.32 | 0.0219 | 0.0037 | |||
| GNRC / Generac Holdings Inc. | 0.00 | 0.02 | 0.0216 | 0.0216 | |||||
| CIEN / Ciena Corporation | 0.00 | 0.00 | 0.02 | 27.78 | 0.0214 | 0.0042 | |||
| AA / Alcoa Corporation | 0.00 | 0.00 | 0.02 | 37.50 | 0.0202 | 0.0051 | |||
| XPO / XPO, Inc. | 0.00 | 0.00 | 0.02 | -28.57 | 0.0189 | -0.0067 | |||
| ZI / ZoomInfo Technologies Inc. | 0.00 | 0.02 | 0.0182 | 0.0182 | |||||
| SSNC / SS&C Technologies Holdings, Inc. | 0.00 | 0.00 | 0.02 | 11.76 | 0.0172 | 0.0012 | |||
| GT / The Goodyear Tire & Rubber Company | 0.00 | 0.00 | 0.02 | 0.00 | 0.0171 | -0.0001 | |||
| PODD / Insulet Corporation | 0.00 | 0.00 | 0.02 | 33.33 | 0.0146 | 0.0031 | |||
| EXAS / Exact Sciences Corporation | 0.00 | 0.00 | 0.01 | 55.56 | 0.0132 | 0.0044 | |||
| / RXO Inc | 0.00 | 0.01 | 0.0098 | 0.0098 | |||||
| LYFT / Lyft, Inc. | 0.00 | 0.00 | 0.01 | -20.00 | 0.0081 | -0.0017 | |||
| TWLO / Twilio Inc. | 0.00 | 0.00 | 0.01 | -30.00 | 0.0069 | -0.0030 | |||
| ROKU / Roku, Inc. | 0.00 | 0.00 | 0.00 | -33.33 | 0.0041 | -0.0016 | |||
| US30190A1043 / F&G Annuities & Life Inc | 0.00 | 0.00 | 0.0015 | 0.0015 | |||||
| S P 500 INDEX CALL OPTION / DE (N/A) | -0.01 | -96.68 | -0.0130 | 0.2666 | |||||
| S P 500 INDEX CALL OPTION / DE (N/A) | -0.02 | -95.02 | -0.0191 | 0.2606 | |||||
| S P 500 INDEX CALL OPTION / DE (N/A) | -0.17 | -59.00 | -0.1567 | 0.1229 | |||||
| S P 500 INDEX CALL OPTION / DE (N/A) | -0.20 | -51.90 | -0.1835 | 0.0962 | |||||
| S P 500 INDEX CALL OPTION / DE (N/A) | -0.23 | -44.79 | -0.2109 | 0.0687 | |||||
| S P 500 INDEX CALL OPTION / DE (N/A) | -0.23 | -44.79 | -0.2109 | 0.0687 | |||||
| S P 500 INDEX CALL OPTION / DE (N/A) | -0.23 | -44.55 | -0.2122 | 0.0675 | |||||
| S P 500 INDEX CALL OPTION / DE (N/A) | -0.42 | -0.71 | -0.3790 | -0.0994 | |||||
| S P 500 INDEX CALL OPTION / DE (N/A) | -0.43 | 2.61 | -0.3916 | -0.1120 |