Statistik Asas
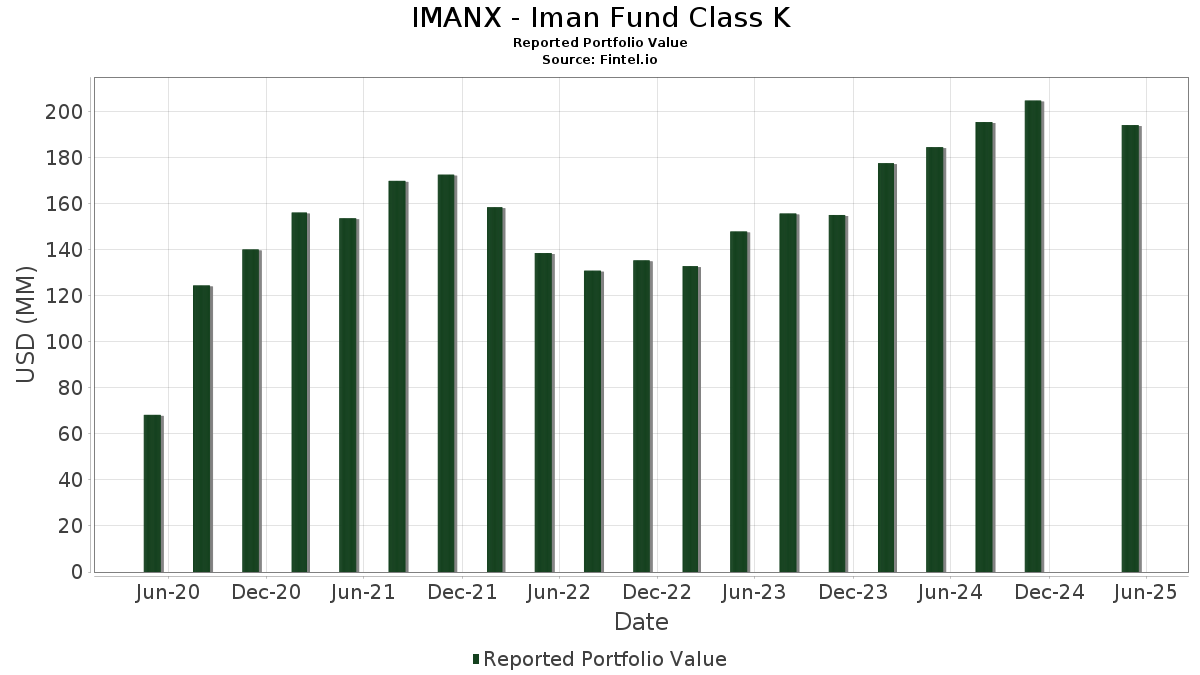
| Nilai Portfolio | $ 194,094,643 |
| Kedudukan Semasa | 110 |
Pegangan Terkini, Prestasi, AUM (dari 13F, 13D)
IMANX - Iman Fund Class K telah mendedahkan 110 jumlah pegangan dalam pemfailan SEC terkini mereka. Nilai portfolio terkini dikira sebagai $ 194,094,643 USD. Aset Sebenar Di Bawah Pengurusan (AUM) ialah nilai ini ditambah dengan tunai (yang tidak didedahkan). Pegangan teratas IMANX - Iman Fund Class K ialah Microsoft Corporation (US:MSFT) , Apple Inc. (US:AAPL) , NVIDIA Corporation (US:NVDA) , Taiwan Semiconductor Manufacturing Company Limited - Depositary Receipt (Common Stock) (US:TSM) , and Meta Platforms, Inc. (US:META) . Kedudukan baharu IMANX - Iman Fund Class K termasuk Hubbell Incorporated (US:HUBB) , A. O. Smith Corporation (US:AOS) , OneSpaWorld Holdings Limited (US:OSW) , LandBridge Company LLC (US:LB) , and YETI Holdings, Inc. (US:YETI) .
Kenaikan Teratas Suku Tahun Ini
Kami menggunakan perubahan dalam peruntukan portfolio kerana ini adalah metrik yang paling bermakna. Perubahan boleh disebabkan oleh perdagangan atau perubahan dalam harga saham.
| Sekuriti | Saham (MM) |
Nilai (MM$) |
Portfolio % | ΔPortfolio % |
|---|---|---|---|---|
| 0.01 | 3.18 | 1.6288 | 1.2257 | |
| 0.01 | 2.34 | 1.1962 | 1.1962 | |
| 0.01 | 2.15 | 1.0990 | 1.0990 | |
| 0.02 | 4.70 | 2.4076 | 1.0535 | |
| 0.03 | 14.35 | 7.3457 | 0.9232 | |
| 0.03 | 1.74 | 0.8919 | 0.8919 | |
| 0.00 | 1.28 | 0.6575 | 0.5461 | |
| 0.01 | 4.06 | 2.0769 | 0.5282 | |
| 0.05 | 2.47 | 1.2619 | 0.4897 | |
| 0.05 | 9.67 | 4.9466 | 0.4554 |
Penurunan Teratas Suku Tahun Ini
Kami menggunakan perubahan dalam peruntukan portfolio kerana ini adalah metrik yang paling bermakna. Perubahan boleh disebabkan oleh perdagangan atau perubahan dalam harga saham.
| Sekuriti | Saham (MM) |
Nilai (MM$) |
Portfolio % | ΔPortfolio % |
|---|---|---|---|---|
| 0.00 | 0.38 | 0.1932 | -1.5512 | |
| 0.07 | 13.13 | 6.7191 | -0.8275 | |
| 0.00 | 0.29 | 0.1479 | -0.7258 | |
| 0.00 | 2.52 | 1.2884 | -0.7080 | |
| 0.00 | 0.21 | 0.1093 | -0.6573 | |
| 0.04 | 2.88 | 1.4746 | -0.6190 | |
| 0.01 | 2.61 | 1.3364 | -0.5842 | |
| 0.01 | 1.77 | 0.9072 | -0.5487 | |
| 0.00 | 3.64 | 1.8615 | -0.4032 | |
| 0.01 | 1.38 | 0.7051 | -0.3301 |
13F dan Pemfailan Dana
Borang ini telah difailkan pada 2025-07-23 untuk tempoh pelaporan 2025-05-31. Klik ikon pautan untuk melihat sejarah transaksi penuh.
Tingkatkan untuk membuka data premium dan eksport ke Excel ![]() .
.
| Sekuriti | Jenis | Purata Harga Saham | Saham (MM) |
ΔSaham (%) |
ΔSaham (%) |
Nilai ($MM) |
Portfolio (%) |
ΔPortfolio (%) |
|
|---|---|---|---|---|---|---|---|---|---|
| MSFT / Microsoft Corporation | 0.03 | 0.00 | 14.35 | 8.72 | 7.3457 | 0.9232 | |||
| AAPL / Apple Inc. | 0.07 | 0.00 | 13.13 | -15.37 | 6.7191 | -0.8275 | |||
| NVDA / NVIDIA Corporation | 0.08 | 0.00 | 11.44 | -2.26 | 5.8538 | 0.1612 | |||
| TSM / Taiwan Semiconductor Manufacturing Company Limited - Depositary Receipt (Common Stock) | 0.05 | 0.00 | 9.67 | 4.69 | 4.9466 | 0.4554 | |||
| META / Meta Platforms, Inc. | 0.01 | -9.73 | 7.66 | 1.77 | 3.9183 | 0.2586 | |||
| GOOGL / Alphabet Inc. | 0.04 | 0.00 | 7.10 | 1.65 | 3.6342 | 0.2360 | |||
| XOM / Exxon Mobil Corporation | 0.05 | 0.00 | 5.31 | -13.28 | 2.7181 | -0.2610 | |||
| AVGO / Broadcom Inc. | 0.02 | 13.16 | 4.70 | 69.03 | 2.4076 | 1.0535 | |||
| SAP / SAP SE - Depositary Receipt (Common Stock) | 0.01 | 0.00 | 4.06 | 27.49 | 2.0769 | 0.5282 | |||
| JNJ / Johnson & Johnson | 0.02 | 0.00 | 3.86 | 0.13 | 1.9738 | 0.1001 | |||
| TSLA / Tesla, Inc. | 0.01 | 0.00 | 3.68 | 0.38 | 1.8829 | 0.0999 | |||
| ORLY / O'Reilly Automotive, Inc. | 0.00 | -28.97 | 3.64 | -21.87 | 1.8615 | -0.4032 | |||
| PG / The Procter & Gamble Company | 0.02 | 0.00 | 3.49 | -5.24 | 1.7879 | -0.0052 | |||
| GGG / Graco Inc. | 0.04 | 0.00 | 3.28 | -7.04 | 1.6767 | -0.0379 | |||
| IDXX / IDEXX Laboratories, Inc. | 0.01 | 215.52 | 3.18 | 284.30 | 1.6288 | 1.2257 | |||
| ASML / ASML Holding N.V. - Depositary Receipt (Common Stock) | 0.00 | 0.00 | 3.09 | 7.32 | 1.5836 | 0.1808 | |||
| ROST / Ross Stores, Inc. | 0.02 | 0.00 | 3.02 | -9.57 | 1.5439 | -0.0784 | |||
| NVO / Novo Nordisk A/S - Depositary Receipt (Common Stock) | 0.04 | 0.00 | 2.88 | -33.06 | 1.4746 | -0.6190 | |||
| LII / Lennox International Inc. | 0.00 | -6.23 | 2.76 | -20.68 | 1.4140 | -0.2800 | |||
| CVX / Chevron Corporation | 0.02 | 0.00 | 2.62 | -15.60 | 1.3432 | -0.1692 | |||
| LIN / Linde plc | 0.01 | -34.79 | 2.61 | -33.87 | 1.3364 | -0.5842 | |||
| TPL / Texas Pacific Land Corporation | 0.00 | -11.89 | 2.52 | -38.67 | 1.2884 | -0.7080 | |||
| CPRT / Copart, Inc. | 0.05 | 91.27 | 2.47 | 55.32 | 1.2619 | 0.4897 | |||
| LLY / Eli Lilly and Company | 0.00 | 0.00 | 2.46 | -7.27 | 1.2609 | -0.0313 | |||
| HUBB / Hubbell Incorporated | 0.01 | 2.34 | 1.1962 | 1.1962 | |||||
| POOL / Pool Corporation | 0.01 | 0.00 | 2.21 | -20.30 | 1.1317 | -0.2178 | |||
| ABT / Abbott Laboratories | 0.02 | 0.00 | 2.18 | 12.51 | 1.1143 | 0.1726 | |||
| WPM / Wheaton Precious Metals Corp. | 0.03 | -32.91 | 2.17 | -6.63 | 1.1099 | -0.0200 | |||
| DHR / Danaher Corporation | 0.01 | -7.32 | 2.16 | -26.59 | 1.1079 | -0.3262 | |||
| FFIV / F5, Inc. | 0.01 | 2.15 | 1.0990 | 1.0990 | |||||
| WTS / Watts Water Technologies, Inc. | 0.01 | 0.00 | 2.13 | 12.20 | 1.0922 | 0.1670 | |||
| RHHBY / Roche Holding AG - Depositary Receipt (Common Stock) | 0.05 | 0.00 | 1.97 | 11.21 | 1.0106 | 0.1468 | |||
| NVR / NVR, Inc. | 0.00 | 9.79 | 1.84 | -15.44 | 0.9395 | -0.1162 | |||
| FSS / Federal Signal Corporation | 0.02 | 0.00 | 1.83 | -3.42 | 0.9387 | 0.0148 | |||
| GOOG / Alphabet Inc. | 0.01 | 0.00 | 1.83 | 1.39 | 0.9363 | 0.0585 | |||
| DLB / Dolby Laboratories, Inc. | 0.02 | 26.56 | 1.80 | 16.01 | 0.9235 | 0.0864 | |||
| CRM / Salesforce, Inc. | 0.01 | -26.35 | 1.77 | -40.80 | 0.9072 | -0.5487 | |||
| AOS / A. O. Smith Corporation | 0.03 | 1.74 | 0.8919 | 0.8919 | |||||
| LSTR / Landstar System, Inc. | 0.01 | 24.00 | 1.70 | -8.50 | 0.8708 | -0.0336 | |||
| AEM / Agnico Eagle Mines Limited | 0.01 | 0.00 | 1.70 | 39.84 | 0.8695 | 0.2782 | |||
| TXN / Texas Instruments Incorporated | 0.01 | 0.00 | 1.61 | -9.04 | 0.8234 | -0.0371 | |||
| WST / West Pharmaceutical Services, Inc. | 0.01 | 0.00 | 1.38 | -35.29 | 0.7051 | -0.3301 | |||
| UFPI / UFP Industries, Inc. | 0.01 | 0.00 | 1.36 | -28.22 | 0.6940 | -0.2249 | |||
| AGI / Alamos Gold Inc. | 0.05 | -12.93 | 1.31 | 19.80 | 0.6691 | 0.1381 | |||
| CHE / Chemed Corporation | 0.00 | 458.75 | 1.28 | 463.16 | 0.6575 | 0.5461 | |||
| KAI / Kadant Inc. | 0.00 | -10.81 | 1.26 | -32.20 | 0.6426 | -0.2580 | |||
| SN / SharkNinja, Inc. | 0.01 | 0.00 | 1.20 | -8.57 | 0.6116 | -0.0242 | |||
| BSX / Boston Scientific Corporation | 0.01 | 0.00 | 1.05 | 16.11 | 0.5387 | 0.0977 | |||
| SSD / Simpson Manufacturing Co., Inc. | 0.01 | 0.00 | 1.05 | -17.36 | 0.5386 | -0.0809 | |||
| IT / Gartner, Inc. | 0.00 | 0.00 | 0.99 | -15.74 | 0.5070 | -0.0649 | |||
| EXPO / Exponent, Inc. | 0.01 | 0.00 | 0.98 | -22.64 | 0.5001 | -0.1145 | |||
| TJX / The TJX Companies, Inc. | 0.01 | 0.00 | 0.96 | 0.94 | 0.4936 | 0.0289 | |||
| AMD / Advanced Micro Devices, Inc. | 0.01 | 0.00 | 0.96 | -19.28 | 0.4930 | -0.0875 | |||
| ADI / Analog Devices, Inc. | 0.00 | 0.00 | 0.93 | -1.90 | 0.4763 | 0.0150 | |||
| QCOM / QUALCOMM Incorporated | 0.01 | 0.00 | 0.93 | -8.49 | 0.4748 | -0.0179 | |||
| SHOP / Shopify Inc. | 0.01 | 0.00 | 0.91 | -7.23 | 0.4664 | -0.0116 | |||
| GEV / GE Vernova Inc. | 0.00 | 0.00 | 0.85 | 41.60 | 0.4357 | 0.1431 | |||
| ISRG / Intuitive Surgical, Inc. | 0.00 | 0.00 | 0.82 | 1.87 | 0.4183 | 0.0281 | |||
| ADBE / Adobe Inc. | 0.00 | 0.00 | 0.79 | -19.64 | 0.4068 | -0.0738 | |||
| LRCX / Lam Research Corporation | 0.01 | -20.97 | 0.79 | -13.65 | 0.4052 | -0.0404 | |||
| OSW / OneSpaWorld Holdings Limited | 0.04 | 0.79 | 0.4034 | 0.4034 | |||||
| NKE / NIKE, Inc. | 0.01 | 0.00 | 0.79 | -23.14 | 0.4031 | -0.0950 | |||
| LB / LandBridge Company LLC | 0.01 | 0.78 | 0.3999 | 0.3999 | |||||
| RIO / Rio Tinto Group - Depositary Receipt (Common Stock) | 0.01 | 0.00 | 0.78 | -5.47 | 0.3984 | -0.0020 | |||
| MCK / McKesson Corporation | 0.00 | 0.00 | 0.77 | 14.52 | 0.3958 | 0.0672 | |||
| NOW / ServiceNow, Inc. | 0.00 | 0.00 | 0.76 | -3.66 | 0.3907 | 0.0052 | |||
| AMAT / Applied Materials, Inc. | 0.00 | 0.00 | 0.75 | -10.26 | 0.3850 | -0.0229 | |||
| TYL / Tyler Technologies, Inc. | 0.00 | -21.69 | 0.75 | -28.16 | 0.3839 | -0.1242 | |||
| EOG / EOG Resources, Inc. | 0.01 | 34.89 | 0.66 | 10.02 | 0.3373 | 0.0456 | |||
| UBER / Uber Technologies, Inc. | 0.01 | 0.60 | 0.3058 | 0.3058 | |||||
| VRTX / Vertex Pharmaceuticals Incorporated | 0.00 | 0.00 | 0.57 | -5.59 | 0.2941 | -0.0019 | |||
| TT / Trane Technologies plc | 0.00 | 0.00 | 0.54 | 3.44 | 0.2774 | 0.0223 | |||
| FORM / FormFactor, Inc. | 0.02 | 0.00 | 0.50 | -25.56 | 0.2551 | -0.0703 | |||
| MTD / Mettler-Toledo International Inc. | 0.00 | -44.59 | 0.47 | -48.86 | 0.2424 | -0.2079 | |||
| REGN / Regeneron Pharmaceuticals, Inc. | 0.00 | 0.00 | 0.45 | -34.69 | 0.2296 | -0.1043 | |||
| ANSS / ANSYS, Inc. | 0.00 | 0.00 | 0.44 | -5.81 | 0.2243 | -0.0020 | |||
| CDNS / Cadence Design Systems, Inc. | 0.00 | 0.00 | 0.42 | -6.65 | 0.2160 | -0.0034 | |||
| CTAS / Cintas Corporation | 0.00 | 0.00 | 0.39 | 0.52 | 0.1970 | 0.0103 | |||
| EME / EMCOR Group, Inc. | 0.00 | -88.62 | 0.38 | -89.49 | 0.1932 | -1.5512 | |||
| FERG / Ferguson Enterprises Inc. | 0.00 | 0.00 | 0.36 | -15.55 | 0.1866 | -0.0234 | |||
| EW / Edwards Lifesciences Corporation | 0.00 | 0.00 | 0.35 | 9.78 | 0.1781 | 0.0237 | |||
| DECK / Deckers Outdoor Corporation | 0.00 | 0.00 | 0.31 | -46.14 | 0.1571 | -0.1202 | |||
| MRVL / Marvell Technology, Inc. | 0.01 | 0.00 | 0.30 | -35.21 | 0.1540 | -0.0714 | |||
| LEN / Lennar Corporation | 0.00 | -73.54 | 0.29 | -83.91 | 0.1479 | -0.7258 | |||
| CMG / Chipotle Mexican Grill, Inc. | 0.01 | 0.00 | 0.29 | -18.70 | 0.1474 | -0.0247 | |||
| RMD / ResMed Inc. | 0.00 | 0.00 | 0.28 | -1.74 | 0.1447 | 0.0048 | |||
| SMCI / Super Micro Computer, Inc. | 0.01 | 0.00 | 0.27 | 22.94 | 0.1372 | 0.0308 | |||
| LULU / lululemon athletica inc. | 0.00 | 0.00 | 0.24 | -1.25 | 0.1215 | 0.0046 | |||
| ODFL / Old Dominion Freight Line, Inc. | 0.00 | 0.00 | 0.24 | -28.83 | 0.1213 | -0.0408 | |||
| NXT / Nextracker Inc. | 0.00 | 0.00 | 0.23 | 48.72 | 0.1189 | 0.0428 | |||
| MPWR / Monolithic Power Systems, Inc. | 0.00 | 0.00 | 0.23 | 16.67 | 0.1186 | 0.0219 | |||
| SKX / Skechers U.S.A., Inc. | 0.00 | 0.00 | 0.23 | -2.97 | 0.1175 | 0.0026 | |||
| JBHT / J.B. Hunt Transport Services, Inc. | 0.00 | 0.00 | 0.23 | -26.62 | 0.1158 | -0.0341 | |||
| VLTO / Veralto Corporation | 0.00 | 0.00 | 0.23 | -6.64 | 0.1155 | -0.0021 | |||
| YETI / YETI Holdings, Inc. | 0.01 | 0.22 | 0.1131 | 0.1131 | |||||
| FNV / Franco-Nevada Corporation | 0.00 | -89.72 | 0.21 | -85.82 | 0.1093 | -0.6573 | |||
| EXPD / Expeditors International of Washington, Inc. | 0.00 | 0.00 | 0.20 | -7.34 | 0.1038 | -0.0027 | |||
| AZEK / The AZEK Company Inc. | 0.00 | -75.00 | 0.19 | -76.69 | 0.0988 | -0.3043 | |||
| BOOT / Boot Barn Holdings, Inc. | 0.00 | 0.00 | 0.19 | 17.07 | 0.0984 | 0.0184 | |||
| ROL / Rollins, Inc. | 0.00 | 0.00 | 0.19 | 13.25 | 0.0967 | 0.0159 | |||
| MSGS / Madison Square Garden Sports Corp. | 0.00 | 0.17 | 0.0884 | 0.0884 | |||||
| LPX / Louisiana-Pacific Corporation | 0.00 | 0.17 | 0.0876 | 0.0876 | |||||
| VRT / Vertiv Holdings Co | 0.00 | 0.00 | 0.17 | -15.31 | 0.0851 | -0.0105 | |||
| ENSG / The Ensign Group, Inc. | 0.00 | 0.00 | 0.15 | 0.68 | 0.0754 | 0.0042 | |||
| ODC / Oil-Dri Corporation of America | 0.00 | 100.00 | 0.15 | 45.00 | 0.0743 | 0.0257 | |||
| EPAM / EPAM Systems, Inc. | 0.00 | -56.81 | 0.11 | -69.21 | 0.0580 | -0.1205 | |||
| JJSF / J&J Snack Foods Corp. | 0.00 | 0.00 | 0.11 | -33.95 | 0.0551 | -0.0239 | |||
| PDFS / PDF Solutions, Inc. | 0.01 | 0.00 | 0.10 | -44.44 | 0.0516 | -0.0360 | |||
| ACLS / Axcelis Technologies, Inc. | 0.00 | 0.00 | 0.10 | -24.60 | 0.0490 | -0.0124 | |||
| VICR / Vicor Corporation | 0.00 | -63.41 | 0.07 | -70.18 | 0.0335 | -0.0726 |