Statistik Asas
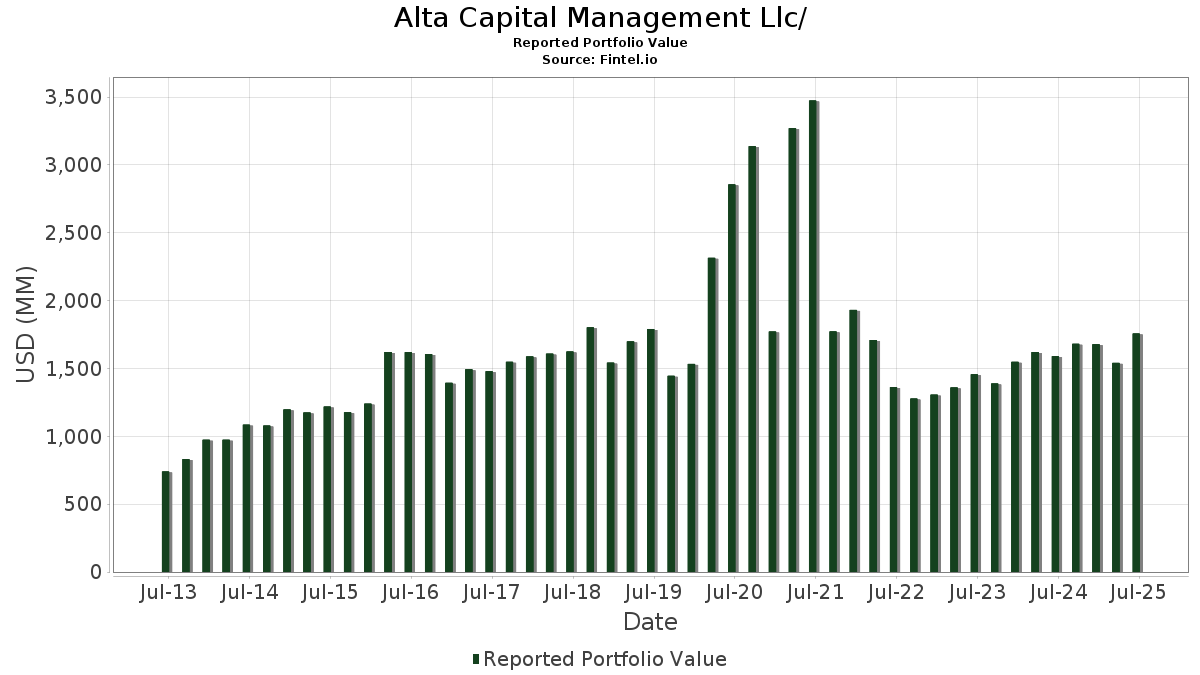
| Nilai Portfolio | $ 1,757,253,797 |
| Kedudukan Semasa | 94 |
Pegangan Terkini, Prestasi, AUM (dari 13F, 13D)
Alta Capital Management Llc/ telah mendedahkan 94 jumlah pegangan dalam pemfailan SEC terkini mereka. Nilai portfolio terkini dikira sebagai $ 1,757,253,797 USD. Aset Sebenar Di Bawah Pengurusan (AUM) ialah nilai ini ditambah dengan tunai (yang tidak didedahkan). Pegangan teratas Alta Capital Management Llc/ ialah NVIDIA Corporation (US:NVDA) , Amazon.com, Inc. (US:AMZN) , Alphabet Inc. (US:GOOGL) , Microsoft Corporation (US:MSFT) , and Apple Inc. (US:AAPL) . Kedudukan baharu Alta Capital Management Llc/ termasuk Vertiv Holdings Co (US:VRT) , Murata Manufacturing Co., Ltd. - Depositary Receipt (Common Stock) (US:MRAAY) , .
Kenaikan Teratas Suku Tahun Ini
Kami menggunakan perubahan dalam peruntukan portfolio kerana ini adalah metrik yang paling bermakna. Perubahan boleh disebabkan oleh perdagangan atau perubahan dalam harga saham.
| Sekuriti | Saham (MM) |
Nilai (MM$) |
Portfolio % | ΔPortfolio % |
|---|---|---|---|---|
| 0.07 | 51.28 | 2.9179 | 2.3021 | |
| 0.78 | 123.20 | 7.0107 | 2.2341 | |
| 0.22 | 61.08 | 3.4759 | 1.1551 | |
| 0.67 | 66.45 | 3.7813 | 0.7762 | |
| 0.18 | 88.47 | 5.0348 | 0.7034 | |
| 0.07 | 58.21 | 3.3125 | 0.4586 | |
| 0.02 | 39.78 | 2.2637 | 0.3993 | |
| 0.05 | 11.18 | 0.6361 | 0.3920 | |
| 0.48 | 104.50 | 5.9465 | 0.3562 | |
| 0.10 | 11.10 | 0.6314 | 0.3104 |
Penurunan Teratas Suku Tahun Ini
Kami menggunakan perubahan dalam peruntukan portfolio kerana ini adalah metrik yang paling bermakna. Perubahan boleh disebabkan oleh perdagangan atau perubahan dalam harga saham.
| Sekuriti | Saham (MM) |
Nilai (MM$) |
Portfolio % | ΔPortfolio % |
|---|---|---|---|---|
| 0.12 | 37.94 | 2.1592 | -1.7362 | |
| 0.35 | 71.96 | 4.0948 | -1.0683 | |
| 0.00 | 0.66 | 0.0377 | -0.7720 | |
| 0.05 | 26.44 | 1.5047 | -0.6943 | |
| 0.09 | 36.22 | 2.0612 | -0.6874 | |
| 0.11 | 41.35 | 2.3532 | -0.6402 | |
| 0.07 | 25.68 | 1.4612 | -0.5055 | |
| 0.64 | 31.52 | 1.7935 | -0.4695 | |
| 0.33 | 57.50 | 3.2721 | -0.4517 | |
| 0.10 | 56.36 | 3.2072 | -0.4501 |
13F dan Pemfailan Dana
Borang ini telah difailkan pada 2025-07-28 untuk tempoh pelaporan 2025-06-30. Klik ikon pautan untuk melihat sejarah transaksi penuh.
Tingkatkan untuk membuka data premium dan eksport ke Excel ![]() .
.
| Sekuriti | Jenis | Purata Harga Saham | Saham (MM) |
ΔSaham (%) |
ΔSaham (%) |
Nilai ($MM) |
Portfolio (%) |
ΔPortfolio (%) |
|
|---|---|---|---|---|---|---|---|---|---|
| NVDA / NVIDIA Corporation | 0.78 | 14.81 | 123.20 | 67.36 | 7.0107 | 2.2341 | |||
| AMZN / Amazon.com, Inc. | 0.48 | 5.19 | 104.50 | 21.29 | 5.9465 | 0.3562 | |||
| GOOGL / Alphabet Inc. | 0.57 | 0.43 | 101.11 | 14.45 | 5.7541 | 0.0211 | |||
| MSFT / Microsoft Corporation | 0.18 | 0.03 | 88.47 | 32.55 | 5.0348 | 0.7034 | |||
| AAPL / Apple Inc. | 0.35 | -2.09 | 71.96 | -9.57 | 4.0948 | -1.0683 | |||
| APH / Amphenol Corporation | 0.67 | -4.70 | 66.45 | 43.48 | 3.7813 | 0.7762 | |||
| AVGO / Broadcom Inc. | 0.22 | 3.73 | 61.08 | 70.78 | 3.4759 | 1.1551 | |||
| INTU / Intuit Inc. | 0.07 | 3.17 | 58.21 | 32.35 | 3.3125 | 0.4586 | |||
| XPRO / Expro Group Holdings N.V. | 0.33 | 28.33 | 57.50 | 0.20 | 3.2721 | -0.4517 | |||
| MA / Mastercard Incorporated | 0.10 | -2.46 | 56.36 | -0.01 | 3.2072 | -0.4501 | |||
| BKNG / Booking Holdings Inc. | 0.01 | -2.61 | 54.65 | 22.39 | 3.1099 | 0.2123 | |||
| TJX / The TJX Companies, Inc. | 0.44 | 3.21 | 53.92 | 4.64 | 3.0683 | -0.2754 | |||
| META / Meta Platforms, Inc. | 0.07 | 321.87 | 51.28 | 440.31 | 2.9179 | 2.3021 | |||
| SPGI / S&P Global Inc. | 0.09 | 3.39 | 45.95 | 7.30 | 2.6147 | -0.1640 | |||
| AZO / AutoZone, Inc. | 0.01 | 15.28 | 45.43 | 12.24 | 2.5855 | -0.0413 | |||
| ADSK / Autodesk, Inc. | 0.14 | -2.76 | 44.75 | 14.98 | 2.5467 | 0.0211 | |||
| ADBE / Adobe Inc. | 0.11 | -11.13 | 41.35 | -10.36 | 2.3532 | -0.6402 | |||
| ASML / ASML Holding N.V. - Depositary Receipt (Common Stock) | 0.05 | 3.32 | 40.70 | 24.96 | 2.3164 | 0.2026 | |||
| MELI / MercadoLibre, Inc. | 0.02 | 3.34 | 39.78 | 38.45 | 2.2637 | 0.3993 | |||
| UNH / UnitedHealth Group Incorporated | 0.12 | 6.11 | 37.94 | -36.79 | 2.1592 | -1.7362 | |||
| TMO / Thermo Fisher Scientific Inc. | 0.09 | 4.94 | 36.22 | -14.49 | 2.0612 | -0.6874 | |||
| CPRT / Copart, Inc. | 0.64 | 4.22 | 31.52 | -9.63 | 1.7935 | -0.4695 | |||
| SHW / The Sherwin-Williams Company | 0.09 | 2.97 | 31.25 | 1.25 | 1.7786 | -0.2245 | |||
| V / Visa Inc. | 0.09 | -1.73 | 30.45 | -0.44 | 1.7329 | -0.2519 | |||
| BRK.A / Berkshire Hathaway Inc. | 0.05 | -14.45 | 26.44 | -21.97 | 1.5047 | -0.6943 | |||
| ZTS / Zoetis Inc. | 0.17 | 1.78 | 25.79 | -3.60 | 1.4678 | -0.2683 | |||
| HD / The Home Depot, Inc. | 0.07 | -15.32 | 25.68 | -15.28 | 1.4612 | -0.5055 | |||
| BAH / Booz Allen Hamilton Holding Corporation | 0.24 | 6.45 | 25.01 | 5.99 | 1.4233 | -0.1080 | |||
| NVO / Novo Nordisk A/S - Depositary Receipt (Common Stock) | 0.31 | 6.63 | 21.24 | 5.98 | 1.2086 | -0.0917 | |||
| VRSN / VeriSign, Inc. | 0.07 | 0.36 | 19.66 | 14.16 | 1.1188 | 0.0013 | |||
| KNSL / Kinsale Capital Group, Inc. | 0.04 | -0.86 | 18.00 | -1.43 | 1.0243 | -0.1607 | |||
| CTAS / Cintas Corporation | 0.08 | 5.96 | 17.17 | 14.91 | 0.9770 | 0.0075 | |||
| LOW / Lowe's Companies, Inc. | 0.07 | 11.87 | 15.89 | 6.42 | 0.9041 | -0.0646 | |||
| GDDY / GoDaddy Inc. | 0.08 | 7.82 | 14.97 | 7.77 | 0.8517 | -0.0495 | |||
| IDXX / IDEXX Laboratories, Inc. | 0.02 | 6.00 | 11.88 | 35.39 | 0.6758 | 0.1066 | |||
| ORCL / Oracle Corporation | 0.05 | 90.07 | 11.18 | 197.26 | 0.6361 | 0.3920 | |||
| FSS / Federal Signal Corporation | 0.10 | 55.03 | 11.10 | 124.32 | 0.6314 | 0.3104 | |||
| VST / Vistra Corp. | 0.05 | 6.48 | 10.31 | 75.73 | 0.5865 | 0.2059 | |||
| QSR / Restaurant Brands International Inc. | 0.15 | 5.48 | 9.78 | 4.94 | 0.5565 | -0.0483 | |||
| WM / Waste Management, Inc. | 0.04 | 0.83 | 9.13 | -0.34 | 0.5196 | -0.0749 | |||
| JPM / JPMorgan Chase & Co. | 0.03 | 4.50 | 8.08 | 23.50 | 0.4599 | 0.0353 | |||
| NSSC / Napco Security Technologies, Inc. | 0.24 | -40.58 | 7.20 | -23.36 | 0.4096 | -0.1999 | |||
| CVX / Chevron Corporation | 0.04 | 8.25 | 6.20 | -7.34 | 0.3530 | -0.0814 | |||
| MKL / Markel Group Inc. | 0.00 | 10.27 | 5.64 | 17.80 | 0.3209 | 0.0103 | |||
| AMT / American Tower Corporation | 0.02 | 4.38 | 5.16 | 6.02 | 0.2938 | -0.0222 | |||
| UNP / Union Pacific Corporation | 0.02 | 8.15 | 5.01 | 5.32 | 0.2851 | -0.0236 | |||
| T / AT&T Inc. | 0.17 | -14.15 | 4.89 | -12.14 | 0.2783 | -0.0829 | |||
| CSCO / Cisco Systems, Inc. | 0.07 | -10.19 | 4.75 | 0.98 | 0.2706 | -0.0350 | |||
| TXN / Texas Instruments Incorporated | 0.02 | 5.96 | 4.31 | 22.43 | 0.2451 | 0.0168 | |||
| MCD / McDonald's Corporation | 0.01 | 5.09 | 4.26 | -1.71 | 0.2425 | -0.0388 | |||
| LMT / Lockheed Martin Corporation | 0.01 | 6.48 | 3.97 | 10.38 | 0.2258 | -0.0074 | |||
| WEC / WEC Energy Group, Inc. | 0.04 | -5.01 | 3.94 | -9.17 | 0.2244 | -0.0573 | |||
| DPZ / Domino's Pizza, Inc. | 0.01 | 9.98 | 3.93 | 7.88 | 0.2237 | -0.0128 | |||
| MO / Altria Group, Inc. | 0.06 | 3.93 | 3.72 | 1.53 | 0.2117 | -0.0261 | |||
| GOOG / Alphabet Inc. | 0.02 | 0.00 | 3.55 | 13.54 | 0.2019 | -0.0009 | |||
| EXR / Extra Space Storage Inc. | 0.02 | -17.42 | 3.53 | -17.99 | 0.2010 | -0.0785 | |||
| BKH / Black Hills Corporation | 0.06 | 5.82 | 3.31 | -2.13 | 0.1882 | -0.0311 | |||
| FAST / Fastenal Company | 0.08 | 109.70 | 3.26 | 13.60 | 0.1854 | -0.0007 | |||
| PEP / PepsiCo, Inc. | 0.02 | 10.06 | 3.21 | -3.08 | 0.1827 | -0.0323 | |||
| ADP / Automatic Data Processing, Inc. | 0.01 | 4.59 | 3.04 | 5.56 | 0.1730 | -0.0139 | |||
| GCAAF / Guardian Capital Group Limited | 0.09 | 28.83 | 2.91 | 45.30 | 0.1656 | 0.0356 | |||
| ZION / Zions Bancorporation, National Association | 0.03 | 20.17 | 1.43 | 25.22 | 0.0811 | 0.0072 | |||
| KR / The Kroger Co. | 0.02 | 35.64 | 1.27 | 43.71 | 0.0722 | 0.0149 | |||
| PSX / Phillips 66 | 0.01 | 8.77 | 1.26 | 5.09 | 0.0717 | -0.0061 | |||
| WMT / Walmart Inc. | 0.01 | 0.00 | 0.98 | 11.40 | 0.0556 | -0.0013 | |||
| BA / The Boeing Company | 0.00 | 14.53 | 0.83 | 40.78 | 0.0470 | 0.0089 | |||
| LLY / Eli Lilly and Company | 0.00 | 0.00 | 0.81 | -5.62 | 0.0459 | -0.0096 | |||
| BRK.A / Berkshire Hathaway Inc. | 0.00 | 0.00 | 0.73 | -8.77 | 0.0415 | -0.0103 | |||
| BR / Broadridge Financial Solutions, Inc. | 0.00 | -94.70 | 0.66 | -94.69 | 0.0377 | -0.7720 | |||
| ABBV / AbbVie Inc. | 0.00 | 0.00 | 0.60 | -11.37 | 0.0342 | -0.0098 | |||
| OXY / Occidental Petroleum Corporation | 0.01 | 37.92 | 0.59 | 17.43 | 0.0334 | 0.0010 | |||
| TTWO / Take-Two Interactive Software, Inc. | 0.00 | -7.93 | 0.57 | 7.97 | 0.0324 | -0.0018 | |||
| TSLA / Tesla, Inc. | 0.00 | 0.44 | 0.0253 | 0.0253 | |||||
| DLTR / Dollar Tree, Inc. | 0.00 | 7.98 | 0.43 | 42.19 | 0.0244 | 0.0049 | |||
| ECL / Ecolab Inc. | 0.00 | 0.00 | 0.40 | 6.32 | 0.0230 | -0.0017 | |||
| SPY / SPDR S&P 500 ETF | 0.00 | 0.38 | 0.0217 | 0.0217 | |||||
| ULTA / Ulta Beauty, Inc. | 0.00 | 4.49 | 0.36 | 33.46 | 0.0204 | 0.0030 | |||
| TSM / Taiwan Semiconductor Manufacturing Company Limited - Depositary Receipt (Common Stock) | 0.00 | 24.41 | 0.36 | 70.00 | 0.0204 | 0.0067 | |||
| PEO / Adams Natural Resources Fund, Inc. | 0.02 | 0.00 | 0.34 | -6.32 | 0.0195 | -0.0042 | |||
| DE / Deere & Company | 0.00 | 0.15 | 0.33 | 8.50 | 0.0189 | -0.0010 | |||
| SBUX / Starbucks Corporation | 0.00 | -10.00 | 0.33 | -16.07 | 0.0188 | -0.0067 | |||
| VRT / Vertiv Holdings Co | 0.00 | 0.33 | 0.0186 | 0.0186 | |||||
| YUM / Yum! Brands, Inc. | 0.00 | 38.72 | 0.31 | 30.67 | 0.0177 | 0.0023 | |||
| CRM / Salesforce, Inc. | 0.00 | 0.31 | 0.0174 | 0.0174 | |||||
| RTX / RTX Corporation | 0.00 | 0.00 | 0.29 | 10.38 | 0.0164 | -0.0006 | |||
| MAR / Marriott International, Inc. | 0.00 | 0.29 | 0.28 | 15.10 | 0.0161 | 0.0001 | |||
| ACN / Accenture plc | 0.00 | 0.00 | 0.26 | -4.01 | 0.0150 | -0.0029 | |||
| EXLS / ExlService Holdings, Inc. | 0.01 | 9.92 | 0.26 | 1.97 | 0.0148 | -0.0017 | |||
| STE / STERIS plc | 0.00 | -8.11 | 0.25 | -2.72 | 0.0142 | -0.0024 | |||
| FLT / Corpay, Inc. | 0.00 | 8.24 | 0.23 | 2.68 | 0.0131 | -0.0014 | |||
| RY / Royal Bank of Canada | 0.00 | 0.21 | 0.0118 | 0.0118 | |||||
| WEGZY / WEG S.A. - Depositary Receipt (Common Stock) | 0.02 | 0.12 | 0.0068 | 0.0068 | |||||
| MRAAY / Murata Manufacturing Co., Ltd. - Depositary Receipt (Common Stock) | 0.02 | 0.11 | 0.0065 | 0.0065 | |||||
| ITUB / Itaú Unibanco Holding S.A. - Depositary Receipt (Common Stock) | 0.01 | 24.28 | 0.10 | 53.23 | 0.0054 | 0.0014 | |||
| YUMC / Yum China Holdings, Inc. | 0.00 | -100.00 | 0.00 | 0.0000 |