Statistik Asas
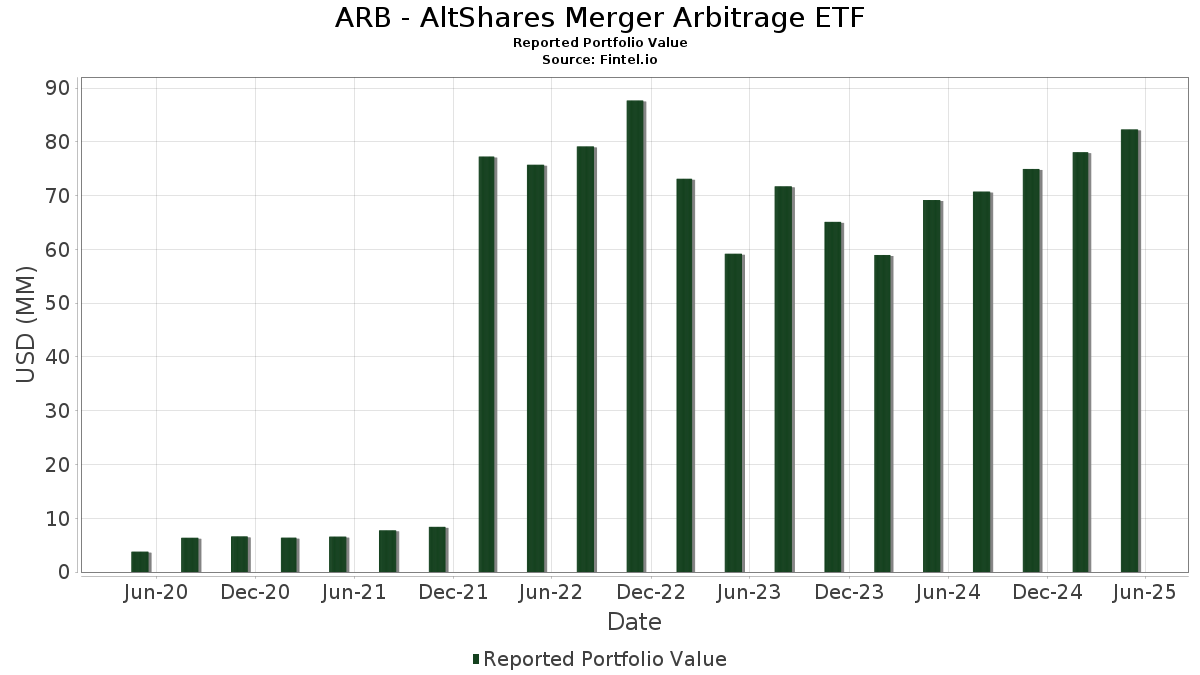
| Nilai Portfolio | $ 82,283,032 |
| Kedudukan Semasa | 95 |
Pegangan Terkini, Prestasi, AUM (dari 13F, 13D)
ARB - AltShares Merger Arbitrage ETF telah mendedahkan 95 jumlah pegangan dalam pemfailan SEC terkini mereka. Nilai portfolio terkini dikira sebagai $ 82,283,032 USD. Aset Sebenar Di Bawah Pengurusan (AUM) ialah nilai ini ditambah dengan tunai (yang tidak didedahkan). Pegangan teratas ARB - AltShares Merger Arbitrage ETF ialah Skechers U.S.A., Inc. (US:SKX) , SpringWorks Therapeutics, Inc. (US:SWTX) , Frontier Communications Parent, Inc. (US:FYBR) , Just Eat Takeaway.com N.V. (GB:JET) , and Kellanova (US:K) . Kedudukan baharu ARB - AltShares Merger Arbitrage ETF termasuk Skechers U.S.A., Inc. (US:SKX) , SpringWorks Therapeutics, Inc. (US:SWTX) , Walgreens Boots Alliance, Inc. (US:WBA) , Dun & Bradstreet Holdings, Inc. (US:DNB) , and AvidXchange Holdings, Inc. (US:AVDX) .
Kenaikan Teratas Suku Tahun Ini
Kami menggunakan perubahan dalam peruntukan portfolio kerana ini adalah metrik yang paling bermakna. Perubahan boleh disebabkan oleh perdagangan atau perubahan dalam harga saham.
| Sekuriti | Saham (MM) |
Nilai (MM$) |
Portfolio % | ΔPortfolio % |
|---|---|---|---|---|
| 0.08 | 4.65 | 5.3695 | 5.3695 | |
| 0.10 | 4.55 | 5.2528 | 5.2528 | |
| 0.20 | 4.51 | 5.2063 | 5.2063 | |
| 0.38 | 4.31 | 4.9746 | 4.9746 | |
| 0.43 | 3.90 | 4.5019 | 4.5019 | |
| 0.00 | 0.00 | 3.8052 | ||
| 0.31 | 3.04 | 3.5077 | 3.5077 | |
| 0.07 | 3.89 | 4.4866 | 3.4477 | |
| 0.07 | 2.80 | 3.2325 | 3.2325 | |
| 0.28 | 2.77 | 3.1976 | 3.1976 |
Penurunan Teratas Suku Tahun Ini
Kami menggunakan perubahan dalam peruntukan portfolio kerana ini adalah metrik yang paling bermakna. Perubahan boleh disebabkan oleh perdagangan atau perubahan dalam harga saham.
| Sekuriti | Saham (MM) |
Nilai (MM$) |
Portfolio % | ΔPortfolio % |
|---|---|---|---|---|
| 0.25 | 0.25 | 0.2869 | -6.9087 | |
| 2.16 | 2.16 | 2.4959 | -4.6997 | |
| 0.00 | 0.00 | -4.0892 | ||
| 0.00 | 0.00 | -4.0626 | ||
| 0.00 | 0.00 | -3.8336 | ||
| 0.00 | 0.00 | -3.7542 | ||
| 0.00 | 0.00 | -1.9449 | ||
| 0.00 | 0.00 | -1.8999 | ||
| 0.00 | 0.00 | -1.8982 | ||
| 0.00 | 0.00 | -1.8410 |
13F dan Pemfailan Dana
Borang ini telah difailkan pada 2025-07-08 untuk tempoh pelaporan 2025-05-31. Klik ikon pautan untuk melihat sejarah transaksi penuh.
Tingkatkan untuk membuka data premium dan eksport ke Excel ![]() .
.
| Sekuriti | Jenis | Purata Harga Saham | Saham (MM) |
ΔSaham (%) |
ΔSaham (%) |
Nilai ($MM) |
Portfolio (%) |
ΔPortfolio (%) |
|
|---|---|---|---|---|---|---|---|---|---|
| SKX / Skechers U.S.A., Inc. | 0.08 | 4.65 | 5.3695 | 5.3695 | |||||
| SWTX / SpringWorks Therapeutics, Inc. | 0.10 | 4.55 | 5.2528 | 5.2528 | |||||
| FYBR / Frontier Communications Parent, Inc. | 0.13 | 34.51 | 4.53 | 35.40 | 5.2306 | 1.0647 | |||
| JET / Just Eat Takeaway.com N.V. | 0.20 | 4.51 | 5.2063 | 5.2063 | |||||
| K / Kellanova | 0.05 | 33.96 | 4.48 | 33.53 | 5.1654 | 0.9933 | |||
| WBA / Walgreens Boots Alliance, Inc. | 0.38 | 4.31 | 4.9746 | 4.9746 | |||||
| DNB / Dun & Bradstreet Holdings, Inc. | 0.43 | 3.90 | 4.5019 | 4.5019 | |||||
| TXNM / TXNM Energy, Inc. | 0.07 | 3,645.66 | 3.89 | 4,218.89 | 4.4866 | 3.4477 | |||
| TGI / Triumph Group, Inc. | 0.15 | 20.81 | 3.81 | 22.77 | 4.3999 | 0.5346 | |||
| CIX / CI Financial Corp. | 0.16 | 67.89 | 3.72 | 77.35 | 4.2917 | 1.6809 | |||
| PL0 / Playa Hotels & Resorts N.V. | 0.28 | 106.18 | 3.71 | 107.91 | 4.2781 | 2.0587 | |||
| HEES / H&E Equipment Services, Inc. | 0.04 | 17.48 | 3.38 | 15.93 | 3.8964 | 0.2718 | |||
| AVDX / AvidXchange Holdings, Inc. | 0.31 | 3.04 | 3.5077 | 3.5077 | |||||
| FARO / FARO Technologies, Inc. | 0.07 | 2.80 | 3.2325 | 3.2325 | |||||
| INGXF / Innergex Renewable Energy Inc. | 0.28 | 2.77 | 3.1976 | 3.1976 | |||||
| RDUS / Radius Recycling, Inc. | 0.09 | 2.63 | 3.0384 | 3.0384 | |||||
| US61747C7074 / Morgan Stanley Institutional Liquidity Funds Government Portfolio, Institutional Class | 2.16 | -62.59 | 2.16 | -62.60 | 2.4959 | -4.6997 | |||
| EVRI / Everi Holdings Inc. | 0.14 | 25.50 | 1.93 | 28.58 | 2.2277 | 0.3594 | |||
| PRA / ProAssurance Corporation | 0.08 | 1.92 | 2.2114 | 2.2114 | |||||
| DROOF / Deliveroo plc | 0.77 | 1.83 | 2.1112 | 2.1112 | |||||
| AN / AutoNation, Inc. | 0.15 | 1.80 | 2.0714 | 2.0714 | |||||
| PQX1 / Biotage AB (publ) | 0.11 | 1.65 | 1.9050 | 1.9050 | |||||
| PPBI / Pacific Premier Bancorp, Inc. | 0.07 | 1.50 | 1.7287 | 1.7287 | |||||
| CCRN / Cross Country Healthcare, Inc. | 0.11 | -4.79 | 1.43 | -26.90 | 1.6533 | -0.7849 | |||
| IPG / The Interpublic Group of Companies, Inc. | 0.06 | 1.42 | 1.6440 | 1.6440 | |||||
| LSEA / Landsea Homes Corporation | 0.10 | 1.16 | 1.3395 | 1.3395 | |||||
| BRKL / Brookline Bancorp, Inc. | 0.08 | 27.76 | 0.86 | 11.88 | 0.9893 | 0.0354 | |||
| ANDHF / Andlauer Healthcare Group Inc. | 0.02 | 0.81 | 0.9303 | 0.9303 | |||||
| INZY / Inozyme Pharma, Inc. | 0.20 | 0.79 | 0.9125 | 0.9125 | |||||
| MORGAN STANLEY PRIME BROKER US / (000000000) | 0.79 | 0.79 | 0.9100 | 0.9100 | |||||
| HONE / HarborOne Bancorp, Inc. | 0.06 | 0.70 | 0.8033 | 0.8033 | |||||
| BRDG / Bridge Investment Group Holdings Inc. | 0.07 | 0.67 | 0.7770 | 0.7770 | |||||
| GB / Global Blue Group Holding AG | 0.09 | 125.61 | 0.67 | 129.55 | 0.7713 | 0.4086 | |||
| GVMXX / State Street Institutional Investment Trust - State Street Institutional US Govt Money Market Fnd Premier Cls | 0.25 | -95.70 | 0.25 | -95.71 | 0.2869 | -6.9087 | |||
| CHX / ChampionX Corporation | 0.01 | -81.72 | 0.23 | -85.28 | 0.2639 | -1.6639 | |||
| SSBK / Southern States Bancshares, Inc. | 0.01 | 0.22 | 0.2550 | 0.2550 | |||||
| Long: COLBMSS TRS USD R V 01MFEDL FEDL01M-40BPS / Short: COLBMSS TRS USD P E COLB US PE / DE (000000000) | 0.10 | 0.1117 | 0.1117 | ||||||
| Long: BHLBMSS TRS USD R V 01MFEDL FEDL01 -40 BPS / Short: BHLBMSS TRS USD P E BHLBMSS TRS P E / DE (000000000) | 0.08 | 0.0916 | 0.0916 | ||||||
| Long: APOMSS TRS USD R V 01MFEDL FEDL01M-40BPS / Short: APOMSS TRS USD P E APO US PE / DE (000000000) | 0.03 | 0.0366 | 0.0366 | ||||||
| PURCHASED CAD / SOLD USD / DFE (000000000) | 0.02 | 0.0280 | 0.0280 | ||||||
| PURCHASED CAD / SOLD USD / DFE (000000000) | 0.02 | 0.0276 | 0.0276 | ||||||
| PURCHASED GBP / SOLD USD / DFE (000000000) | 0.02 | 0.0217 | 0.0217 | ||||||
| PURCHASED NOK / SOLD USD / DFE (000000000) | 0.02 | 0.0209 | 0.0209 | ||||||
| PURCHASED GBP / SOLD USD / DFE (000000000) | 0.02 | 0.0206 | 0.0206 | ||||||
| PURCHASED CAD / SOLD USD / DFE (000000000) | 0.01 | 0.0171 | 0.0171 | ||||||
| PURCHASED GBP / SOLD USD / DFE (000000000) | 0.01 | 0.0116 | 0.0116 | ||||||
| Long: HRIMSS TRS USD R V 01MFEDL FDL01 - 40 BPS / Short: HRIMSS TRS USD P E HRIMSS TRS P E / DE (000000000) | 0.01 | 0.0115 | 0.0115 | ||||||
| PURCHASED GBP / SOLD USD / DFE (000000000) | 0.01 | 0.0098 | 0.0098 | ||||||
| HATL / H&T Group plc | 0.00 | 0.00 | 0.0044 | 0.0044 | |||||
| PURCHASED EUR / SOLD USD / DFE (000000000) | 0.00 | 0.0029 | 0.0029 | ||||||
| PURCHASED USD / SOLD SEK / DFE (000000000) | 0.00 | 0.0016 | 0.0016 | ||||||
| PURCHASED GBP / SOLD USD / DFE (000000000) | 0.00 | 0.0016 | 0.0016 | ||||||
| PURCHASED EUR / SOLD USD / DFE (000000000) | 0.00 | 0.0015 | 0.0015 | ||||||
| PURCHASED USD / SOLD GBP / DFE (000000000) | 0.00 | 0.0009 | 0.0009 | ||||||
| PURCHASED USD / SOLD EUR / DFE (000000000) | 0.00 | 0.0007 | 0.0007 | ||||||
| PURCHASED SEK / SOLD USD / DFE (000000000) | 0.00 | 0.0006 | 0.0006 | ||||||
| PURCHASED USD / SOLD DKK / DFE (000000000) | 0.00 | 0.0001 | 0.0001 | ||||||
| CALLIDITAS THERAPEUTICS AB / EC (SE0023950894) | 0.00 | 0.00 | 0.0000 | 0.0000 | |||||
| MORGAN STANLEY PRIME BROKER CA / STIV (000000000) | 0.00 | 0.00 | 0.0000 | 0.0000 | |||||
| 927HZF903 / MORGAN STANLEY PRIME BROKER G | 0.00 | -50.00 | 0.00 | 0.0000 | -0.0000 | ||||
| ENFN / Enfusion, Inc. | 0.00 | -100.00 | 0.00 | -100.00 | -0.2494 | ||||
| LGTY / Logility Supply Chain Solutions, Inc. | 0.00 | -100.00 | 0.00 | -100.00 | -0.7873 | ||||
| US361ESC0496 / ESC GCI LIBERTY INC SR | 0.00 | 0.00 | 0.00 | 0.0000 | 0.0000 | ||||
| PYCR / Paycor HCM, Inc. | 0.00 | -100.00 | 0.00 | -100.00 | -3.7542 | ||||
| ACCD / Accolade, Inc. | 0.00 | -100.00 | 0.00 | -100.00 | -1.8369 | ||||
| AMPS / Altus Power, Inc. | 0.00 | -100.00 | 0.00 | -100.00 | -1.8999 | ||||
| PDCO / Patterson Companies, Inc. | 0.00 | -100.00 | 0.00 | -100.00 | -3.8336 | ||||
| NVRO / Nevro Corp. | 0.00 | -100.00 | 0.00 | -100.00 | -0.8138 | ||||
| ITCI / Intra-Cellular Therapies, Inc. | 0.00 | -100.00 | 0.00 | -100.00 | -4.0892 | ||||
| PURCHASED USD / SOLD SEK / DFE (000000000) | 0.00 | -0.0000 | -0.0000 | ||||||
| TI1 / TI Fluid Systems plc | 0.00 | -100.00 | 0.00 | -100.00 | -1.4974 | ||||
| AZPN / Aspen Technology, Inc. | 0.00 | -100.00 | 0.00 | -100.00 | -4.0626 | ||||
| PTVE / Pactiv Evergreen Inc. | 0.00 | -100.00 | 0.00 | -100.00 | -1.9449 | ||||
| BERY / Berry Global Group, Inc. | 0.00 | -100.00 | 0.00 | -100.00 | -1.8982 | ||||
| SWI / SolarWinds Corporation | 0.00 | -100.00 | 0.00 | -100.00 | -1.8410 | ||||
| CHTR / Charter Communications, Inc. | 0.00 | -100.00 | 0.00 | -100.00 | 3.8052 | ||||
| PURCHASED SEK / SOLD USD / DFE (000000000) | -0.00 | -0.0001 | -0.0001 | ||||||
| PURCHASED USD / SOLD EUR / DFE (000000000) | -0.00 | -0.0002 | -0.0002 | ||||||
| PURCHASED USD / SOLD SEK / DFE (000000000) | -0.00 | -0.0002 | -0.0002 | ||||||
| PURCHASED USD / SOLD GBP / DFE (000000000) | -0.00 | -0.0018 | -0.0018 | ||||||
| PURCHASED USD / SOLD DKK / DFE (000000000) | -0.00 | -0.0019 | -0.0019 | ||||||
| PURCHASED USD / SOLD CAD / DFE (000000000) | -0.00 | -0.0022 | -0.0022 | ||||||
| PURCHASED USD / SOLD GBP / DFE (000000000) | -0.00 | -0.0027 | -0.0027 | ||||||
| PURCHASED USD / SOLD CAD / DFE (000000000) | -0.00 | -0.0029 | -0.0029 | ||||||
| PURCHASED USD / SOLD EUR / DFE (000000000) | -0.00 | -0.0035 | -0.0035 | ||||||
| PURCHASED DKK / SOLD USD / DFE (000000000) | -0.00 | -0.0036 | -0.0036 | ||||||
| PURCHASED SEK / SOLD USD / DFE (000000000) | -0.00 | -0.0040 | -0.0040 | ||||||
| PURCHASED USD / SOLD CAD / DFE (000000000) | -0.00 | -0.0044 | -0.0044 | ||||||
| PURCHASED USD / SOLD GBP / DFE (000000000) | -0.00 | -0.0048 | -0.0048 | ||||||
| PURCHASED USD / SOLD GBP / DFE (000000000) | -0.00 | -0.0050 | -0.0050 | ||||||
| Long: FBKMSS TRS USD R V 01MFEDL0 FEDL01-40BPS / Short: FBKMSS TRS USD P E / DE (000000000) | -0.01 | -0.0060 | -0.0060 | ||||||
| Long: OMCMSS TRS USD R V 00MFEDL FEDL01M-40BPS / Short: OMCMSS TRS USD P E OMCMSS US TRS RE / DE (000000000) | -0.01 | -0.0073 | -0.0073 | ||||||
| PURCHASED USD / SOLD SEK / DFE (000000000) | -0.01 | -0.0078 | -0.0078 | ||||||
| PURCHASED USD / SOLD GBP / DFE (000000000) | -0.01 | -0.0120 | -0.0120 | ||||||
| PURCHASED USD / SOLD SEK / DFE (000000000) | -0.01 | -0.0126 | -0.0126 | ||||||
| PURCHASED USD / SOLD SEK / DFE (000000000) | -0.01 | -0.0137 | -0.0137 | ||||||
| PURCHASED USD / SOLD CAD / DFE (000000000) | -0.02 | -0.0178 | -0.0178 | ||||||
| PURCHASED USD / SOLD EUR / DFE (000000000) | -0.02 | -0.0219 | -0.0219 | ||||||
| PURCHASED USD / SOLD SEK / DFE (000000000) | -0.02 | -0.0261 | -0.0261 | ||||||
| PURCHASED USD / SOLD GBP / DFE (000000000) | -0.02 | -0.0264 | -0.0264 | ||||||
| PURCHASED USD / SOLD NOK / DFE (000000000) | -0.02 | -0.0266 | -0.0266 | ||||||
| PURCHASED USD / SOLD EUR / DFE (000000000) | -0.03 | -0.0338 | -0.0338 | ||||||
| PURCHASED USD / SOLD CAD / DFE (000000000) | -0.03 | -0.0402 | -0.0402 | ||||||
| PURCHASED USD / SOLD EUR / DFE (000000000) | -0.05 | -0.0583 | -0.0583 | ||||||
| PURCHASED USD / SOLD EUR / DFE (000000000) | -0.06 | -0.0726 | -0.0726 | ||||||
| PURCHASED USD / SOLD DKK / DFE (000000000) | -0.07 | -0.0765 | -0.0765 | ||||||
| PURCHASED USD / SOLD CAD / DFE (000000000) | -0.10 | -0.1198 | -0.1198 | ||||||
| PURCHASED USD / SOLD GBP / DFE (000000000) | -0.11 | -0.1264 | -0.1264 | ||||||
| PURCHASED USD / SOLD CAD / DFE (000000000) | -0.12 | -0.1428 | -0.1428 | ||||||
| OMC / Omnicom Group Inc. | Short | -0.00 | -0.25 | -0.2919 | -0.2919 | ||||
| EBC / Eastern Bankshares, Inc. | Short | -0.04 | -0.53 | -0.6109 | -0.6109 |