Statistik Asas
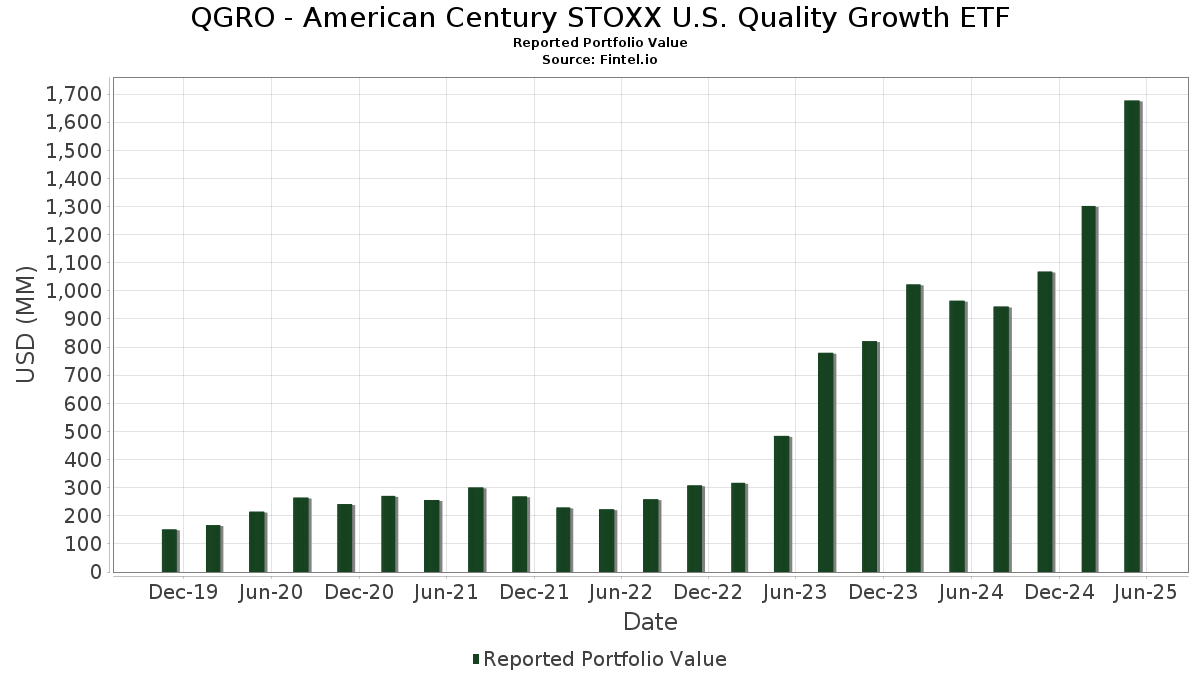
| Nilai Portfolio | $ 1,676,687,872 |
| Kedudukan Semasa | 192 |
Pegangan Terkini, Prestasi, AUM (dari 13F, 13D)
QGRO - American Century STOXX U.S. Quality Growth ETF telah mendedahkan 192 jumlah pegangan dalam pemfailan SEC terkini mereka. Nilai portfolio terkini dikira sebagai $ 1,676,687,872 USD. Aset Sebenar Di Bawah Pengurusan (AUM) ialah nilai ini ditambah dengan tunai (yang tidak didedahkan). Pegangan teratas QGRO - American Century STOXX U.S. Quality Growth ETF ialah Booking Holdings Inc. (US:BKNG) , Netflix, Inc. (US:NFLX) , Meta Platforms, Inc. (US:META) , Palo Alto Networks, Inc. (US:PANW) , and The TJX Companies, Inc. (US:TJX) . Kedudukan baharu QGRO - American Century STOXX U.S. Quality Growth ETF termasuk Spotify Technology S.A. (US:SPOT) , Commvault Systems, Inc. (US:CVLT) , Doximity, Inc. (US:DOCS) , Hims & Hers Health, Inc. (US:HIMS) , and DT Midstream, Inc. (US:DTM) .
Kenaikan Teratas Suku Tahun Ini
Kami menggunakan perubahan dalam peruntukan portfolio kerana ini adalah metrik yang paling bermakna. Perubahan boleh disebabkan oleh perdagangan atau perubahan dalam harga saham.
| Sekuriti | Saham (MM) |
Nilai (MM$) |
Portfolio % | ΔPortfolio % |
|---|---|---|---|---|
| 0.07 | 45.24 | 2.6985 | 2.6985 | |
| 0.04 | 37.56 | 2.2406 | 2.0535 | |
| 0.16 | 39.47 | 2.3540 | 1.6742 | |
| 0.32 | 27.24 | 1.6249 | 1.4370 | |
| 0.14 | 23.60 | 1.4077 | 1.3022 | |
| 0.09 | 23.67 | 1.4119 | 1.2984 | |
| 0.06 | 40.75 | 2.4307 | 1.1363 | |
| 0.10 | 32.38 | 1.9315 | 0.8515 | |
| 0.02 | 16.00 | 0.9541 | 0.7859 | |
| 0.09 | 24.70 | 1.4736 | 0.7487 |
Penurunan Teratas Suku Tahun Ini
Kami menggunakan perubahan dalam peruntukan portfolio kerana ini adalah metrik yang paling bermakna. Perubahan boleh disebabkan oleh perdagangan atau perubahan dalam harga saham.
| Sekuriti | Saham (MM) |
Nilai (MM$) |
Portfolio % | ΔPortfolio % |
|---|---|---|---|---|
| 0.01 | 4.29 | 0.2559 | -2.7901 | |
| 0.03 | 2.80 | 0.1668 | -2.5182 | |
| 0.00 | 4.33 | 0.2581 | -1.9414 | |
| 0.14 | 14.45 | 0.8619 | -1.3886 | |
| 0.01 | 1.41 | 0.0841 | -1.3296 | |
| 0.07 | 17.25 | 1.0291 | -1.1805 | |
| 0.11 | 19.27 | 1.1494 | -1.1668 | |
| 0.01 | 3.11 | 0.1854 | -0.7728 | |
| 0.18 | 36.81 | 2.1953 | -0.7684 | |
| 0.07 | 3.00 | 0.1792 | -0.7275 |
13F dan Pemfailan Dana
Borang ini telah difailkan pada 2025-07-28 untuk tempoh pelaporan 2025-05-31. Klik ikon pautan untuk melihat sejarah transaksi penuh.
Tingkatkan untuk membuka data premium dan eksport ke Excel ![]() .
.
| Sekuriti | Jenis | Purata Harga Saham | Saham (MM) |
ΔSaham (%) |
ΔSaham (%) |
Nilai ($MM) |
Portfolio (%) |
ΔPortfolio (%) |
|
|---|---|---|---|---|---|---|---|---|---|
| BKNG / Booking Holdings Inc. | 0.01 | 28.67 | 63.91 | 41.57 | 3.8121 | 0.3480 | |||
| NFLX / Netflix, Inc. | 0.05 | -7.76 | 59.66 | 13.56 | 3.5584 | -0.4727 | |||
| META / Meta Platforms, Inc. | 0.08 | 26.99 | 54.80 | 23.06 | 3.2686 | -0.1484 | |||
| PANW / Palo Alto Networks, Inc. | 0.26 | 32.99 | 49.92 | 34.38 | 2.9778 | 0.1272 | |||
| TJX / The TJX Companies, Inc. | 0.39 | 14.91 | 49.49 | 16.89 | 2.9517 | -0.2969 | |||
| SPOT / Spotify Technology S.A. | 0.07 | 45.24 | 2.6985 | 2.6985 | |||||
| UBER / Uber Technologies, Inc. | 0.52 | 16.71 | 44.08 | 29.22 | 2.6295 | 0.0117 | |||
| PGR / The Progressive Corporation | 0.15 | 23.09 | 41.59 | 24.36 | 2.4809 | -0.0853 | |||
| LLY / Eli Lilly and Company | 0.06 | 206.81 | 40.75 | 282.95 | 2.4307 | 1.1363 | |||
| GE / General Electric Company | 0.16 | 274.91 | 39.47 | 345.43 | 2.3540 | 1.6742 | |||
| BSX / Boston Scientific Corporation | 0.36 | 8.80 | 37.69 | 10.34 | 2.2483 | -0.3729 | |||
| COST / Costco Wholesale Corporation | 0.04 | 1,453.25 | 37.56 | 1,440.77 | 2.2406 | 2.0535 | |||
| AMZN / Amazon.com, Inc. | 0.18 | -1.33 | 36.81 | -4.71 | 2.1953 | -0.7684 | |||
| PLTR / Palantir Technologies Inc. | 0.27 | -13.94 | 35.28 | 33.54 | 2.1042 | 0.0772 | |||
| HWM / Howmet Aerospace Inc. | 0.21 | 41.54 | 34.98 | 76.03 | 2.0864 | 0.5616 | |||
| DASH / DoorDash, Inc. | 0.16 | 21.89 | 33.47 | 28.17 | 1.9964 | -0.0074 | |||
| NVDA / NVIDIA Corporation | 0.25 | 40.65 | 33.22 | 52.14 | 1.9815 | 0.3061 | |||
| PODD / Insulet Corporation | 0.10 | 92.73 | 32.38 | 130.08 | 1.9315 | 0.8515 | |||
| APP / AppLovin Corporation | 0.08 | -11.73 | 31.27 | 6.49 | 1.8654 | -0.3879 | |||
| ANET / Arista Networks Inc | 0.34 | 49.27 | 29.13 | 38.99 | 1.7376 | 0.1293 | |||
| NTNX / Nutanix, Inc. | 0.36 | 97.47 | 27.26 | 96.95 | 1.6259 | 0.5639 | |||
| DXCM / DexCom, Inc. | 0.32 | 1,045.69 | 27.24 | 1,012.75 | 1.6249 | 1.4370 | |||
| MSFT / Microsoft Corporation | 0.06 | 66.93 | 26.01 | 93.58 | 1.5516 | 0.5205 | |||
| RL / Ralph Lauren Corporation | 0.09 | 156.14 | 24.70 | 161.50 | 1.4736 | 0.7487 | |||
| VRSN / VeriSign, Inc. | 0.09 | 1,297.80 | 23.67 | 1,501.49 | 1.4119 | 1.2984 | |||
| JBL / Jabil Inc. | 0.14 | 1,483.06 | 23.60 | 1,617.54 | 1.4077 | 1.3022 | |||
| AAPL / Apple Inc. | 0.11 | 121.47 | 22.22 | 83.94 | 1.3256 | 0.3985 | |||
| SFM / Sprouts Farmers Market, Inc. | 0.12 | 40.23 | 21.09 | 63.34 | 1.2583 | 0.2673 | |||
| GOOGL / Alphabet Inc. | 0.11 | -36.70 | 19.27 | -36.16 | 1.1494 | -1.1668 | |||
| MRK / Merck & Co., Inc. | 0.23 | 39.57 | 17.51 | 16.25 | 1.0444 | -0.1113 | |||
| CRM / Salesforce, Inc. | 0.07 | -32.75 | 17.25 | -40.09 | 1.0291 | -1.1805 | |||
| V / Visa Inc. | 0.05 | 355.37 | 17.16 | 358.57 | 1.0233 | 0.7362 | |||
| WDAY / Workday, Inc. | 0.07 | 69.60 | 16.64 | 59.54 | 0.9923 | 0.1921 | |||
| ADBE / Adobe Inc. | 0.04 | 29.83 | 16.09 | 22.88 | 0.9594 | -0.0450 | |||
| MPWR / Monolithic Power Systems, Inc. | 0.02 | 573.52 | 16.00 | 629.70 | 0.9541 | 0.7859 | |||
| QCOM / QUALCOMM Incorporated | 0.11 | 51.02 | 15.33 | 39.52 | 0.9146 | 0.0713 | |||
| FTNT / Fortinet, Inc. | 0.14 | -47.72 | 14.45 | -50.73 | 0.8619 | -1.3886 | |||
| LRCX / Lam Research Corporation | 0.17 | 985.61 | 13.45 | 1,043.79 | 0.8024 | 0.7120 | |||
| CRS / Carpenter Technology Corporation | 0.05 | 356.44 | 12.86 | 418.21 | 0.7672 | 0.5767 | |||
| AYI / Acuity Inc. | 0.05 | 122.16 | 12.03 | 94.32 | 0.7179 | 0.2426 | |||
| BAH / Booz Allen Hamilton Holding Corporation | 0.10 | 39.77 | 10.79 | 40.02 | 0.6439 | 0.0523 | |||
| HUBS / HubSpot, Inc. | 0.02 | -25.76 | 10.36 | -39.51 | 0.6177 | -0.6959 | |||
| TEAM / Atlassian Corporation | 0.05 | 287.66 | 10.32 | 183.21 | 0.6156 | 0.3359 | |||
| JLL / Jones Lang LaSalle Incorporated | 0.04 | 8.71 | 9.68 | -10.95 | 0.5772 | -0.2567 | |||
| ESTC / Elastic N.V. | 0.11 | 298.16 | 9.26 | 322.74 | 0.5523 | 0.3210 | |||
| DOCU / DocuSign, Inc. | 0.10 | -30.69 | 8.94 | -26.16 | 0.5330 | -0.3955 | |||
| CVLT / Commvault Systems, Inc. | 0.05 | 8.86 | 0.5283 | 0.5283 | |||||
| IBKR / Interactive Brokers Group, Inc. | 0.03 | 194.80 | 7.15 | 202.41 | 0.4265 | 0.2451 | |||
| CEG / Constellation Energy Corporation | 0.02 | -25.97 | 6.90 | -9.55 | 0.4114 | -0.1736 | |||
| EXEL / Exelixis, Inc. | 0.16 | -19.50 | 6.80 | -10.45 | 0.4059 | -0.1772 | |||
| DBX / Dropbox, Inc. | 0.22 | -12.34 | 6.29 | -2.63 | 0.3754 | -0.1205 | |||
| WSM / Williams-Sonoma, Inc. | 0.04 | 86.71 | 5.93 | 55.25 | 0.3538 | 0.0606 | |||
| GAP / The Gap, Inc. | 0.26 | 210.16 | 5.85 | 206.07 | 0.3489 | 0.2023 | |||
| AMAT / Applied Materials, Inc. | 0.04 | -26.62 | 5.67 | -27.24 | 0.3384 | -0.2598 | |||
| MPC / Marathon Petroleum Corporation | 0.03 | 160.78 | 5.37 | 136.68 | 0.3202 | 0.0807 | |||
| EVR / Evercore Inc. | 0.02 | 507.38 | 5.35 | 481.63 | 0.3192 | 0.2486 | |||
| VLO / Valero Energy Corporation | 0.04 | 391.84 | 5.08 | 385.58 | 0.3033 | 0.2229 | |||
| CRUS / Cirrus Logic, Inc. | 0.05 | 125.83 | 5.02 | 113.17 | 0.2994 | 0.1187 | |||
| NYT / The New York Times Company | 0.09 | 46.31 | 4.91 | 73.81 | 0.2930 | 0.0761 | |||
| DOCS / Doximity, Inc. | 0.09 | 4.90 | 0.2923 | 0.2923 | |||||
| GVMXX / State Street Institutional Investment Trust - State Street Institutional US Govt Money Market Fnd Premier Cls | 4.74 | 99.15 | 4.74 | 99.16 | 0.2828 | 0.1001 | |||
| HIMS / Hims & Hers Health, Inc. | 0.08 | 4.74 | 0.2825 | 0.2825 | |||||
| IDXX / IDEXX Laboratories, Inc. | 0.01 | 107.91 | 4.67 | 121.77 | 0.2783 | 0.0562 | |||
| RMD / ResMed Inc. | 0.02 | 27.86 | 4.33 | 34.01 | 0.2586 | 0.0104 | |||
| NOW / ServiceNow, Inc. | 0.00 | -86.12 | 4.33 | -84.90 | 0.2581 | -1.9414 | |||
| COIN / Coinbase Global, Inc. | 0.02 | 4.31 | 0.2574 | 0.2574 | |||||
| MA / Mastercard Incorporated | 0.01 | -89.36 | 4.29 | -89.19 | 0.2559 | -2.7901 | |||
| CBRE / CBRE Group, Inc. | 0.03 | 21.59 | 4.25 | 7.10 | 0.2537 | -0.0510 | |||
| UGI / UGI Corporation | 0.12 | -29.80 | 4.15 | 1.62 | 0.2477 | -0.1837 | |||
| KLAC / KLA Corporation | 0.01 | 207.00 | 4.08 | 227.87 | 0.2435 | 0.1480 | |||
| ABT / Abbott Laboratories | 0.03 | 669.60 | 4.08 | 908.66 | 0.2431 | 0.1599 | |||
| FICO / Fair Isaac Corporation | 0.00 | 73.74 | 4.04 | 59.01 | 0.2412 | 0.0460 | |||
| AXON / Axon Enterprise, Inc. | 0.01 | 55.14 | 3.91 | 120.24 | 0.2331 | 0.0970 | |||
| CVNA / Carvana Co. | 0.01 | 39.62 | 3.90 | 95.98 | 0.2324 | 0.0798 | |||
| LECO / Lincoln Electric Holdings, Inc. | 0.02 | 262.81 | 3.86 | 240.04 | 0.2300 | 0.1430 | |||
| GEV / GE Vernova Inc. | 0.01 | 27.91 | 3.82 | 80.56 | 0.2277 | 0.0654 | |||
| VMI / Valmont Industries, Inc. | 0.01 | 96.03 | 3.74 | 79.04 | 0.2232 | 0.0628 | |||
| DT / Dynatrace, Inc. | 0.07 | 16.62 | 3.72 | 10.02 | 0.2220 | -0.0376 | |||
| ABNB / Airbnb, Inc. | 0.03 | 241.92 | 3.65 | 217.60 | 0.2175 | 0.1294 | |||
| PEGA / Pegasystems Inc. | 0.04 | -24.80 | 3.63 | -6.01 | 0.2166 | -0.0798 | |||
| AVGO / Broadcom Inc. | 0.01 | 24.00 | 3.63 | 50.48 | 0.2163 | 0.0314 | |||
| CART / Maplebear Inc. | 0.08 | 6.31 | 3.60 | 18.17 | 0.2149 | -0.0191 | |||
| LULU / lululemon athletica inc. | 0.01 | 230.93 | 3.60 | 186.70 | 0.2148 | 0.1184 | |||
| DUOL / Duolingo, Inc. | 0.01 | -73.12 | 3.56 | -55.24 | 0.2124 | -0.3980 | |||
| ACN / Accenture plc | 0.01 | 255.60 | 3.56 | 223.34 | 0.2124 | 0.1279 | |||
| FIX / Comfort Systems USA, Inc. | 0.01 | -61.11 | 3.49 | -48.80 | 0.2082 | -0.3151 | |||
| CRWD / CrowdStrike Holdings, Inc. | 0.01 | 23.77 | 3.47 | 49.74 | 0.2067 | 0.0291 | |||
| INSP / Inspire Medical Systems, Inc. | 0.02 | 94.81 | 3.21 | 45.06 | 0.1917 | 0.0217 | |||
| TT / Trane Technologies plc | 0.01 | 50.28 | 3.21 | 82.85 | 0.1915 | 0.0567 | |||
| BMI / Badger Meter, Inc. | 0.01 | 34.56 | 3.14 | 58.81 | 0.1870 | 0.0355 | |||
| EME / EMCOR Group, Inc. | 0.01 | -78.43 | 3.11 | -75.11 | 0.1854 | -0.7728 | |||
| OLLI / Ollie's Bargain Outlet Holdings, Inc. | 0.03 | 86.12 | 3.09 | 151.67 | 0.1842 | 0.0573 | |||
| NFG / National Fuel Gas Company | 0.04 | -74.46 | 3.04 | -58.49 | 0.1815 | -0.7101 | |||
| USFD / US Foods Holding Corp. | 0.04 | 21.82 | 3.02 | 34.49 | 0.1803 | 0.0078 | |||
| TOST / Toast, Inc. | 0.07 | -76.73 | 3.00 | -74.58 | 0.1792 | -0.7275 | |||
| ROL / Rollins, Inc. | 0.05 | 4.99 | 2.99 | 19.78 | 0.1785 | -0.0853 | |||
| DECK / Deckers Outdoor Corporation | 0.03 | 55.89 | 2.96 | 18.03 | 0.1766 | -0.0159 | |||
| CTAS / Cintas Corporation | 0.01 | 37.81 | 2.96 | 50.46 | 0.1765 | 0.0256 | |||
| SCHW / The Charles Schwab Corporation | 0.03 | 29.48 | 2.95 | 43.80 | 0.1759 | 0.0186 | |||
| SBAC / SBA Communications Corporation | 0.01 | 32.77 | 2.90 | 41.29 | 0.1731 | 0.0155 | |||
| AZEK / The AZEK Company Inc. | 0.06 | 2.87 | 0.1712 | 0.1712 | |||||
| VRSK / Verisk Analytics, Inc. | 0.01 | 711.36 | 2.85 | 1,456.83 | 0.1700 | 0.1026 | |||
| DTM / DT Midstream, Inc. | 0.03 | 2.85 | 0.1698 | 0.1698 | |||||
| LNG / Cheniere Energy, Inc. | 0.01 | 180.85 | 2.84 | 328.81 | 0.1696 | 0.1050 | |||
| GWRE / Guidewire Software, Inc. | 0.01 | 24.33 | 2.82 | 32.83 | 0.1680 | 0.0052 | |||
| HALO / Halozyme Therapeutics, Inc. | 0.05 | 135.80 | 2.81 | 123.67 | 0.1675 | 0.0711 | |||
| WMT / Walmart Inc. | 0.03 | -92.02 | 2.80 | -92.01 | 0.1668 | -2.5182 | |||
| ADP / Automatic Data Processing, Inc. | 0.01 | 25.68 | 2.79 | 29.84 | 0.1664 | 0.0015 | |||
| FN / Fabrinet | 0.01 | 45.74 | 2.79 | 69.67 | 0.1662 | 0.0402 | |||
| DIS / The Walt Disney Company | 0.02 | 29.85 | 2.78 | 29.01 | 0.1661 | 0.0004 | |||
| SGI / Somnigroup International Inc. | 0.04 | 78.61 | 2.76 | 126.25 | 0.1646 | 0.0385 | |||
| SO / The Southern Company | 0.03 | 2.73 | 0.1628 | 0.1628 | |||||
| CROX / Crocs, Inc. | 0.03 | 161.36 | 2.73 | 82.47 | 0.1627 | 0.0048 | |||
| FSS / Federal Signal Corporation | 0.03 | 25.41 | 2.69 | 45.14 | 0.1602 | 0.0182 | |||
| AXP / American Express Company | 0.01 | 26.26 | 2.67 | 23.38 | 0.1590 | -0.0068 | |||
| ECL / Ecolab Inc. | 0.01 | 21.68 | 2.66 | 20.14 | 0.1587 | -0.0112 | |||
| WFC / Wells Fargo & Company | 0.03 | 22.05 | 2.59 | 16.55 | 0.1546 | -0.0161 | |||
| MCO / Moody's Corporation | 0.01 | 320.51 | 2.55 | 576.86 | 0.1518 | 0.0300 | |||
| PIPR / Piper Sandler Companies | 0.01 | 2.54 | 0.1514 | 0.1514 | |||||
| MORN / Morningstar, Inc. | 0.01 | 37.32 | 2.52 | 34.99 | 0.1505 | 0.0071 | |||
| NEU / NewMarket Corporation | 0.00 | 90.08 | 2.51 | 114.74 | 0.1495 | 0.0599 | |||
| ISRG / Intuitive Surgical, Inc. | 0.00 | 19.14 | 2.50 | 14.79 | 0.1491 | -0.0180 | |||
| VIK / Viking Holdings Ltd | 0.06 | 2.49 | 0.1488 | 0.1488 | |||||
| AAON / AAON, Inc. | 0.03 | 66.69 | 2.49 | 108.98 | 0.1485 | 0.0571 | |||
| MMSI / Merit Medical Systems, Inc. | 0.03 | 26.76 | 2.47 | 18.06 | 0.1470 | -0.0132 | |||
| TMUS / T-Mobile US, Inc. | 0.01 | 10.81 | 2.42 | -0.49 | 0.1445 | -0.0423 | |||
| GRMN / Garmin Ltd. | 0.01 | 21.16 | 2.41 | 7.41 | 0.1435 | -0.0284 | |||
| DDS / Dillard's, Inc. | 0.01 | 6.79 | 2.35 | 8.69 | 0.1403 | -0.0258 | |||
| BRBR / BellRing Brands, Inc. | 0.04 | 28.96 | 2.31 | 10.78 | 0.1380 | -0.0222 | |||
| LANC / Lancaster Colony Corporation | 0.01 | 214.28 | 2.29 | 208.33 | 0.1369 | 0.0582 | |||
| ANF / Abercrombie & Fitch Co. | 0.03 | -3.93 | 2.27 | -26.78 | 0.1352 | -0.1024 | |||
| TENB / Tenable Holdings, Inc. | 0.07 | 41.78 | 2.25 | 19.77 | 0.1345 | -0.0100 | |||
| PSTG / Pure Storage, Inc. | 0.04 | -46.09 | 2.21 | -43.69 | 0.1318 | -0.2823 | |||
| TPL / Texas Pacific Land Corporation | 0.00 | -14.95 | 2.21 | -33.66 | 0.1316 | -0.1235 | |||
| PCOR / Procore Technologies, Inc. | 0.03 | 12.64 | 2.18 | -1.04 | 0.1303 | -0.0391 | |||
| BKR / Baker Hughes Company | 0.06 | 116.15 | 2.18 | 137.30 | 0.1299 | 0.0183 | |||
| TRGP / Targa Resources Corp. | 0.01 | -68.04 | 2.09 | -74.99 | 0.1249 | -0.5175 | |||
| AFRM / Affirm Holdings, Inc. | 0.04 | 2.03 | 0.1212 | 0.1212 | |||||
| CWAN / Clearwater Analytics Holdings, Inc. | 0.09 | 1.98 | 0.1184 | 0.1184 | |||||
| FI / Fiserv, Inc. | 0.01 | 17.89 | 1.88 | -18.57 | 0.1122 | -0.0651 | |||
| ULTA / Ulta Beauty, Inc. | 0.00 | 2.43 | 1.87 | 36.85 | 0.1114 | -0.0327 | |||
| LSCC / Lattice Semiconductor Corporation | 0.04 | -5.94 | 1.80 | -27.83 | 0.1075 | -0.1962 | |||
| NXT / Nextracker Inc. | 0.03 | 8.30 | 1.77 | 39.48 | 0.1056 | 0.0082 | |||
| CORT / Corcept Therapeutics Incorporated | 0.02 | 1.76 | 0.1049 | 0.1049 | |||||
| LYFT / Lyft, Inc. | 0.11 | 1.69 | 0.1006 | 0.1006 | |||||
| State Street Navigator Securities Lending Government Money Market Portfolio / STIV (N/A) | 1.68 | 1.68 | 0.1004 | 0.1004 | |||||
| WTS / Watts Water Technologies, Inc. | 0.01 | 22.84 | 1.61 | 38.64 | 0.0961 | 0.0069 | |||
| CSL / Carlisle Companies Incorporated | 0.00 | 68.57 | 1.60 | 88.03 | 0.0956 | 0.0302 | |||
| HRB / H&R Block, Inc. | 0.03 | 47.25 | 1.57 | 53.86 | 0.0939 | 0.0154 | |||
| ETSY / Etsy, Inc. | 0.03 | 665.23 | 1.56 | 220.53 | 0.0931 | -0.0644 | |||
| EEFT / Euronet Worldwide, Inc. | 0.01 | -29.60 | 1.54 | -29.36 | 0.0919 | -0.1383 | |||
| SEIC / SEI Investments Company | 0.02 | -84.49 | 1.54 | -83.48 | 0.0916 | -0.6215 | |||
| GDDY / GoDaddy Inc. | 0.01 | 35.40 | 1.53 | 37.39 | 0.0910 | 0.0058 | |||
| CHE / Chemed Corporation | 0.00 | -19.42 | 1.51 | -9.42 | 0.0901 | -0.1232 | |||
| CL / Colgate-Palmolive Company | 0.02 | 28.85 | 1.50 | 31.38 | 0.0894 | 0.0018 | |||
| DOX / Amdocs Limited | 0.02 | 24.54 | 1.50 | 44.73 | 0.0894 | -0.0178 | |||
| M07 / MSA Safety Incorporated | 0.01 | 1.48 | 0.0884 | 0.0884 | |||||
| KMB / Kimberly-Clark Corporation | 0.01 | -67.92 | 1.48 | -67.52 | 0.0882 | -0.2613 | |||
| FERG / Ferguson Enterprises Inc. | 0.01 | 1.48 | 0.0881 | 0.0881 | |||||
| QLYS / Qualys, Inc. | 0.01 | -63.87 | 1.46 | -61.92 | 0.0870 | -0.2070 | |||
| DCI / Donaldson Company, Inc. | 0.02 | 44.36 | 1.45 | 45.45 | 0.0867 | 0.0099 | |||
| CAT / Caterpillar Inc. | 0.00 | -75.65 | 1.45 | -75.37 | 0.0864 | -0.3648 | |||
| MSM / MSC Industrial Direct Co., Inc. | 0.02 | 36.76 | 1.44 | 38.22 | 0.0861 | 0.0059 | |||
| APTV / Aptiv PLC | 0.02 | 19.03 | 1.44 | 11.20 | 0.0859 | -0.0509 | |||
| GILD / Gilead Sciences, Inc. | 0.01 | 5.06 | 1.44 | 1.20 | 0.0858 | -0.0233 | |||
| PG / The Procter & Gamble Company | 0.01 | 26.79 | 1.44 | 23.90 | 0.0857 | -0.0033 | |||
| ZM / Zoom Communications Inc. | 0.02 | 25.85 | 1.42 | 38.75 | 0.0846 | 0.0062 | |||
| IBM / International Business Machines Corporation | 0.01 | -92.55 | 1.41 | -92.35 | 0.0841 | -1.3296 | |||
| AOS / A. O. Smith Corporation | 0.02 | 44.08 | 1.41 | 39.31 | 0.0840 | 0.0065 | |||
| FFIV / F5, Inc. | 0.00 | 1.37 | 0.0818 | 0.0818 | |||||
| TTC / The Toro Company | 0.02 | 1.37 | 0.0815 | 0.0815 | |||||
| JNJ / Johnson & Johnson | 0.01 | 16.77 | 1.36 | 9.84 | 0.0813 | -0.0139 | |||
| HD / The Home Depot, Inc. | 0.00 | 31.25 | 1.35 | 21.87 | 0.0808 | -0.0045 | |||
| LOW / Lowe's Companies, Inc. | 0.01 | 45.23 | 1.35 | 31.84 | 0.0805 | 0.0020 | |||
| MTCH / Match Group, Inc. | 0.04 | 20.05 | 1.32 | 13.34 | 0.0786 | -0.0106 | |||
| DLB / Dolby Laboratories, Inc. | 0.02 | -17.95 | 1.31 | -27.89 | 0.0781 | -0.1540 | |||
| MAT / Mattel, Inc. | 0.07 | 13.04 | 1.29 | 0.54 | 0.0771 | -0.0216 | |||
| UTHR / United Therapeutics Corporation | 0.00 | 35.21 | 1.26 | 34.61 | 0.0754 | 0.0034 | |||
| ALKS / Alkermes plc | 0.04 | -49.55 | 1.25 | -55.02 | 0.0745 | -0.1386 | |||
| BMY / Bristol-Myers Squibb Company | 0.03 | 35.62 | 1.25 | 9.78 | 0.0744 | -0.0127 | |||
| MEDP / Medpace Holdings, Inc. | 0.00 | 22.60 | 1.23 | 10.54 | 0.0732 | -0.0121 | |||
| EXPE / Expedia Group, Inc. | 0.01 | 15.89 | 1.21 | -2.41 | 0.0724 | -0.0230 | |||
| CLX / The Clorox Company | 0.01 | 48.11 | 1.21 | 36.31 | 0.0719 | -0.0357 | |||
| PINS / Pinterest, Inc. | 0.04 | 94.35 | 1.19 | 88.87 | 0.0709 | 0.0044 | |||
| MTD / Mettler-Toledo International Inc. | 0.00 | 4.61 | 1.18 | -16.01 | 0.0704 | -0.0780 | |||
| G / Genpact Limited | 0.03 | 6.70 | 1.17 | -13.69 | 0.0696 | -0.0341 | |||
| NTAP / NetApp, Inc. | 0.01 | 1.15 | 0.0686 | 0.0686 | |||||
| COKE / Coca-Cola Consolidated, Inc. | 0.01 | 984.53 | 1.13 | -12.25 | 0.0671 | -0.0313 | |||
| TGT / Target Corporation | 0.01 | 60.12 | 1.09 | 21.11 | 0.0651 | -0.0040 | |||
| COLM / Columbia Sportswear Company | 0.02 | 17.14 | 1.01 | -14.01 | 0.0601 | -0.0298 | |||
| WFRD / Weatherford International plc | 0.02 | -44.54 | 0.96 | -60.94 | 0.0572 | -0.1312 | |||
| US003CVR0169 / CONTRA ABIOMED INC | 0.00 | 0.00 | 0.00 | 0.00 | 0.0002 | -0.0000 | |||
| NRG / NRG Energy, Inc. | 0.00 | -100.00 | 0.00 | -100.00 | -0.2638 | ||||
| VRT / Vertiv Holdings Co | 0.00 | -100.00 | 0.00 | -100.00 | -0.1246 | ||||
| TXRH / Texas Roadhouse, Inc. | 0.00 | -100.00 | 0.00 | -100.00 | -0.2259 |