Statistik Asas
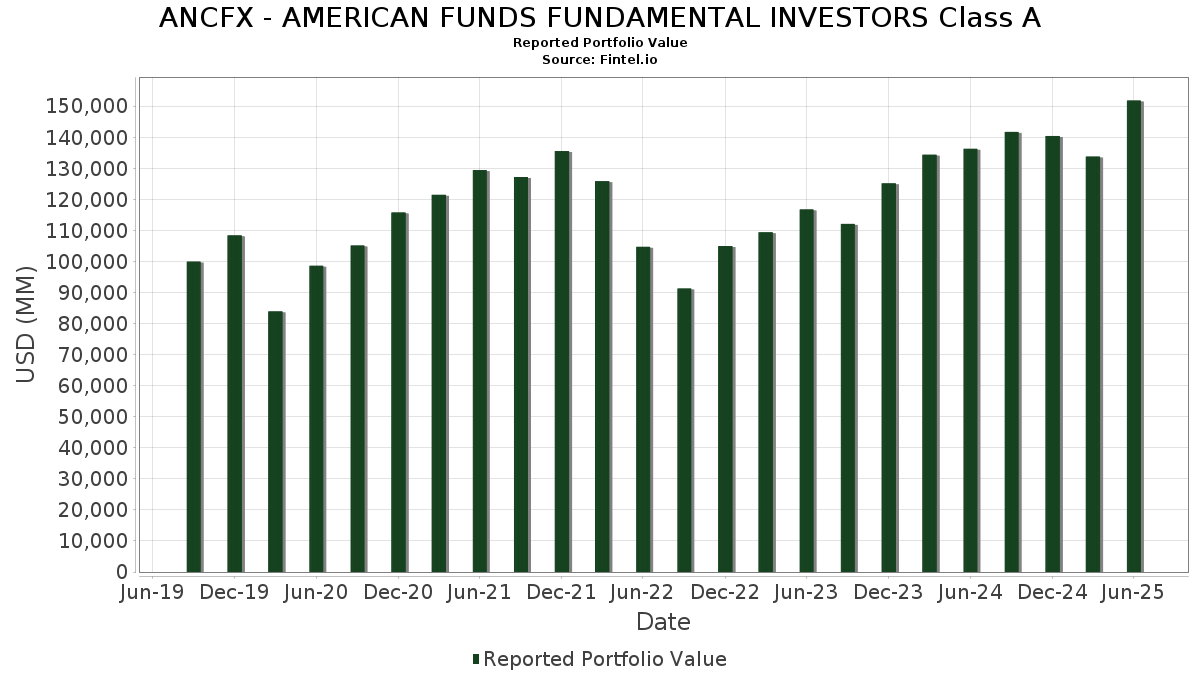
| Nilai Portfolio | $ 151,817,964,385 |
| Kedudukan Semasa | 226 |
Pegangan Terkini, Prestasi, AUM (dari 13F, 13D)
ANCFX - AMERICAN FUNDS FUNDAMENTAL INVESTORS Class A telah mendedahkan 226 jumlah pegangan dalam pemfailan SEC terkini mereka. Nilai portfolio terkini dikira sebagai $ 151,817,964,385 USD. Aset Sebenar Di Bawah Pengurusan (AUM) ialah nilai ini ditambah dengan tunai (yang tidak didedahkan). Pegangan teratas ANCFX - AMERICAN FUNDS FUNDAMENTAL INVESTORS Class A ialah Broadcom Inc. (US:AVGO) , Microsoft Corporation (US:MSFT) , Philip Morris International Inc. (US:PM) , NVIDIA Corporation (US:NVDA) , and CAPITAL GROUP CENTRAL CASH FUND (US:US14020B1026) . Kedudukan baharu ANCFX - AMERICAN FUNDS FUNDAMENTAL INVESTORS Class A termasuk Accenture plc (US:ACN) , AppLovin Corporation (US:APP) , Strategy Inc - Preferred Stock (US:STRD) , FTAI Aviation Ltd. (US:FTAI) , and ORDINARY SHARES (FI:FI4000552500) .
Kenaikan Teratas Suku Tahun Ini
Kami menggunakan perubahan dalam peruntukan portfolio kerana ini adalah metrik yang paling bermakna. Perubahan boleh disebabkan oleh perdagangan atau perubahan dalam harga saham.
| Sekuriti | Saham (MM) |
Nilai (MM$) |
Portfolio % | ΔPortfolio % |
|---|---|---|---|---|
| 38.12 | 10,506.77 | 6.8992 | 1.8781 | |
| 18.45 | 9,177.58 | 6.0264 | 0.8561 | |
| 33.21 | 5,247.17 | 3.4455 | 0.7867 | |
| 23.76 | 2,928.95 | 1.9233 | 0.5824 | |
| 8.99 | 945.86 | 0.6211 | 0.4987 | |
| 1.44 | 1,286.32 | 0.8447 | 0.4677 | |
| 8.95 | 1,935.86 | 1.2712 | 0.3953 | |
| 2.61 | 555.88 | 0.3650 | 0.3564 | |
| 4.35 | 1,361.86 | 0.8943 | 0.2719 | |
| 13.28 | 1,532.13 | 1.0061 | 0.2555 |
Penurunan Teratas Suku Tahun Ini
Kami menggunakan perubahan dalam peruntukan portfolio kerana ini adalah metrik yang paling bermakna. Perubahan boleh disebabkan oleh perdagangan atau perubahan dalam harga saham.
| Sekuriti | Saham (MM) |
Nilai (MM$) |
Portfolio % | ΔPortfolio % |
|---|---|---|---|---|
| 3.67 | 1,145.89 | 0.7524 | -1.0782 | |
| 6.04 | 1,238.64 | 0.8133 | -0.7057 | |
| 17.77 | 3,897.80 | 2.5595 | -0.5588 | |
| 42.45 | 4,245.43 | 2.7877 | -0.4939 | |
| 5.32 | 917.66 | 0.6026 | -0.3372 | |
| 4.83 | 283.45 | 0.1861 | -0.2614 | |
| 4.45 | 158.93 | 0.1044 | -0.2506 | |
| 2.60 | 2,025.39 | 1.3300 | -0.2272 | |
| 1.29 | 236.24 | 0.1551 | -0.2262 | |
| 1.96 | 292.51 | 0.1921 | -0.2035 |
13F dan Pemfailan Dana
Borang ini telah difailkan pada 2025-08-25 untuk tempoh pelaporan 2025-06-30. Klik ikon pautan untuk melihat sejarah transaksi penuh.
Tingkatkan untuk membuka data premium dan eksport ke Excel ![]() .
.
| Sekuriti | Jenis | Purata Harga Saham | Saham (MM) |
ΔSaham (%) |
ΔSaham (%) |
Nilai ($MM) |
Portfolio (%) |
ΔPortfolio (%) |
|
|---|---|---|---|---|---|---|---|---|---|
| AVGO / Broadcom Inc. | 38.12 | -5.43 | 10,506.77 | 55.69 | 6.8992 | 1.8781 | |||
| MSFT / Microsoft Corporation | 18.45 | -0.33 | 9,177.58 | 32.07 | 6.0264 | 0.8561 | |||
| PM / Philip Morris International Inc. | 34.33 | -3.22 | 6,252.10 | 11.05 | 4.1054 | -0.0836 | |||
| NVDA / NVIDIA Corporation | 33.21 | 0.73 | 5,247.17 | 46.84 | 3.4455 | 0.7867 | |||
| US14020B1026 / CAPITAL GROUP CENTRAL CASH FUND | 42.45 | -3.74 | 4,245.43 | -3.74 | 2.7877 | -0.4939 | |||
| TDG / TransDigm Group Incorporated | 2.78 | -1.50 | 4,219.94 | 8.28 | 2.7710 | -0.1288 | |||
| AMZN / Amazon.com, Inc. | 17.77 | -19.34 | 3,897.80 | -6.99 | 2.5595 | -0.5588 | |||
| GOOG / Alphabet Inc. | 21.03 | 0.22 | 3,731.01 | 13.79 | 2.4500 | 0.0104 | |||
| META / Meta Platforms, Inc. | 4.90 | -8.46 | 3,620.08 | 17.23 | 2.3771 | 0.0795 | |||
| MU / Micron Technology, Inc. | 23.76 | 14.57 | 2,928.95 | 62.52 | 1.9233 | 0.5824 | |||
| 2330 / Taiwan Semiconductor Manufacturing Company Limited | 68.12 | 0.00 | 2,471.98 | 30.16 | 1.6232 | 0.2102 | |||
| BATS / British American Tobacco p.l.c. | 48.20 | 16.55 | 2,291.38 | 34.39 | 1.5046 | 0.2360 | |||
| V / Visa Inc. | 5.80 | -0.16 | 2,059.00 | 1.15 | 1.3520 | -0.1625 | |||
| LLY / Eli Lilly and Company | 2.60 | 2.53 | 2,025.39 | -3.23 | 1.3300 | -0.2272 | |||
| 000660 / SK hynix Inc. | 8.95 | 0.79 | 1,935.86 | 64.44 | 1.2712 | 0.3953 | |||
| MSTR / Strategy Inc | 4.26 | 0.00 | 1,720.24 | 40.23 | 1.1296 | 0.2168 | |||
| APO / Apollo Global Management, Inc. | 10.89 | 0.00 | 1,544.53 | 3.60 | 1.0142 | -0.0951 | |||
| GE / General Electric Company | 6.00 | -9.80 | 1,544.34 | 16.00 | 1.0141 | 0.0235 | |||
| SHOP / Shopify Inc. | 13.28 | 25.71 | 1,532.13 | 51.87 | 1.0061 | 0.2555 | |||
| MELI / MercadoLibre, Inc. | 0.55 | 7.82 | 1,441.39 | 44.45 | 0.9465 | 0.2040 | |||
| RCL / Royal Caribbean Cruises Ltd. | 4.35 | 6.82 | 1,361.86 | 62.82 | 0.8943 | 0.2719 | |||
| KLAC / KLA Corporation | 1.44 | 92.67 | 1,286.32 | 153.87 | 0.8447 | 0.4677 | |||
| TSM / Taiwan Semiconductor Manufacturing Company Limited - Depositary Receipt (Common Stock) | 5.61 | 0.00 | 1,270.13 | 36.44 | 0.8340 | 0.1414 | |||
| AAPL / Apple Inc. | 6.04 | -34.31 | 1,238.64 | -39.33 | 0.8133 | -0.7057 | |||
| URI / United Rentals, Inc. | 1.63 | 2.39 | 1,229.34 | 23.09 | 0.8072 | 0.0641 | |||
| RTX / RTX Corporation | 8.11 | 2.53 | 1,184.25 | 13.02 | 0.7776 | -0.0020 | |||
| UNH / UnitedHealth Group Incorporated | 3.67 | -21.81 | 1,145.89 | -53.43 | 0.7524 | -1.0782 | |||
| CEG / Constellation Energy Corporation | 3.55 | -15.77 | 1,145.23 | 34.84 | 0.7520 | 0.1201 | |||
| CNQ / Canadian Natural Resources Limited | 35.57 | 0.00 | 1,117.92 | 2.14 | 0.7341 | -0.0802 | |||
| JPM / JPMorgan Chase & Co. | 3.78 | -7.74 | 1,096.81 | 9.04 | 0.7202 | -0.0282 | |||
| WELL / Welltower Inc. | 6.59 | 0.00 | 1,012.40 | 0.34 | 0.6648 | -0.0859 | |||
| RBLX / Roblox Corporation | 8.99 | 218.62 | 945.86 | 475.03 | 0.6211 | 0.4987 | |||
| QSR / Restaurant Brands International Inc. | 14.12 | 0.00 | 936.10 | -0.53 | 0.6147 | -0.0855 | |||
| FI / Fiserv, Inc. | 5.32 | -6.95 | 917.66 | -27.35 | 0.6026 | -0.3372 | |||
| BA / The Boeing Company | 4.38 | -16.06 | 917.58 | 3.13 | 0.6025 | -0.0595 | |||
| CPNG / Coupang, Inc. | 29.79 | 0.00 | 892.53 | 36.62 | 0.5861 | 0.1000 | |||
| RR. / Rolls-Royce Holdings plc | 66.79 | 16.83 | 887.03 | 60.49 | 0.5825 | 0.1712 | |||
| CARR / Carrier Global Corporation | 12.09 | 0.00 | 884.60 | 15.44 | 0.5809 | 0.0107 | |||
| RYAAY / Ryanair Holdings plc - Depositary Receipt (Common Stock) | 15.21 | 0.00 | 877.07 | 36.11 | 0.5759 | 0.0965 | |||
| PFGC / Performance Food Group Company | 10.01 | 0.00 | 875.97 | 11.24 | 0.5752 | -0.0107 | |||
| ITT / ITT Inc. | 5.54 | 0.00 | 868.24 | 21.42 | 0.5701 | 0.0381 | |||
| SBUX / Starbucks Corporation | 9.43 | 13.84 | 863.98 | 6.34 | 0.5673 | -0.0372 | |||
| PWR / Quanta Services, Inc. | 2.28 | 0.00 | 862.48 | 48.74 | 0.5663 | 0.1349 | |||
| PUB / Pancontinental Energy NL | 7.62 | 0.90 | 859.19 | 20.68 | 0.5642 | 0.0345 | |||
| AMGN / Amgen Inc. | 3.05 | 0.00 | 852.84 | -10.38 | 0.5600 | -0.1480 | |||
| FE / FirstEnergy Corp. | 20.88 | 0.00 | 840.58 | -0.40 | 0.5520 | -0.0760 | |||
| VRTX / Vertex Pharmaceuticals Incorporated | 1.78 | 0.00 | 793.66 | -8.17 | 0.5212 | -0.1219 | |||
| CRM / Salesforce, Inc. | 2.90 | 30.55 | 790.72 | 32.65 | 0.5192 | 0.0757 | |||
| MA / Mastercard Incorporated | 1.36 | -2.60 | 763.69 | -0.14 | 0.5015 | -0.0676 | |||
| TMO / Thermo Fisher Scientific Inc. | 1.82 | 0.00 | 738.37 | -18.52 | 0.4848 | -0.1894 | |||
| GEV / GE Vernova Inc. | 1.37 | -38.22 | 726.48 | 7.08 | 0.4770 | -0.0277 | |||
| BN / Brookfield Corporation | 11.65 | 0.00 | 720.82 | 18.01 | 0.4733 | 0.0189 | |||
| NFLX / Netflix, Inc. | 0.52 | 0.00 | 700.37 | 43.60 | 0.4599 | 0.0970 | |||
| NESN / Nestlé S.A. | 7.05 | -9.50 | 700.06 | -11.09 | 0.4597 | -0.1262 | |||
| BKNG / Booking Holdings Inc. | 0.12 | 0.00 | 688.75 | 25.66 | 0.4523 | 0.0445 | |||
| AZN / Astrazeneca plc | 4.95 | 0.00 | 687.31 | -4.95 | 0.4513 | -0.0867 | |||
| EOG / EOG Resources, Inc. | 5.65 | -6.52 | 676.03 | -12.82 | 0.4439 | -0.1330 | |||
| CHTR / Charter Communications, Inc. | 1.61 | 0.00 | 660.09 | 10.93 | 0.4334 | -0.0093 | |||
| IR / Ingersoll Rand Inc. | 7.81 | 0.00 | 649.56 | 3.94 | 0.4265 | -0.0385 | |||
| 4GE / Grupo México, S.A.B. de C.V. | 106.92 | 0.00 | 647.60 | 21.15 | 0.4252 | 0.0275 | |||
| WPM / Wheaton Precious Metals Corp. | 7.10 | -16.73 | 637.80 | -3.68 | 0.4188 | -0.0739 | |||
| ARES / Ares Management Corporation | 3.67 | 0.00 | 635.41 | 18.14 | 0.4172 | 0.0170 | |||
| NET / Cloudflare, Inc. | 3.24 | 6.77 | 633.64 | 85.54 | 0.4161 | 0.1620 | |||
| ABT / Abbott Laboratories | 4.62 | 0.00 | 628.52 | 2.53 | 0.4127 | -0.0434 | |||
| AON / Aon plc | 1.71 | 0.00 | 610.15 | -10.61 | 0.4006 | -0.1072 | |||
| BMY / Bristol-Myers Squibb Company | 13.16 | 0.28 | 609.17 | -23.89 | 0.4000 | -0.1955 | |||
| AJG / Arthur J. Gallagher & Co. | 1.89 | 0.00 | 604.79 | -7.28 | 0.3971 | -0.0882 | |||
| OWL / Blue Owl Capital Inc. | 30.94 | 20.47 | 594.36 | 15.48 | 0.3903 | 0.0073 | |||
| COP / ConocoPhillips | 6.58 | 0.00 | 590.67 | -14.55 | 0.3879 | -0.1265 | |||
| COF / Capital One Financial Corporation | 2.61 | 3,742.19 | 555.88 | 4,484.54 | 0.3650 | 0.3564 | |||
| ICE / Intercontinental Exchange, Inc. | 2.98 | 0.00 | 546.31 | 6.36 | 0.3587 | -0.0234 | |||
| MMC / Marsh & McLennan Companies, Inc. | 2.45 | 0.00 | 536.20 | -10.40 | 0.3521 | -0.0932 | |||
| DAY / Dayforce Inc. | 9.59 | 0.00 | 530.94 | -5.04 | 0.3486 | -0.0674 | |||
| GOOGL / Alphabet Inc. | 3.00 | 12.70 | 528.85 | 28.43 | 0.3473 | 0.0409 | |||
| ALNY / Alnylam Pharmaceuticals, Inc. | 1.60 | 0.00 | 523.10 | 20.77 | 0.3435 | 0.0212 | |||
| HON / Honeywell International Inc. | 2.23 | 9.97 | 519.32 | 20.94 | 0.3410 | 0.0215 | |||
| MOH / Molina Healthcare, Inc. | 1.73 | 0.00 | 516.13 | -9.56 | 0.3389 | -0.0857 | |||
| CVS / CVS Health Corporation | 7.29 | 0.44 | 502.84 | 2.26 | 0.3302 | -0.0357 | |||
| TFC / Truist Financial Corporation | 11.55 | -27.07 | 496.69 | -23.81 | 0.3262 | -0.1589 | |||
| ASML / ASML Holding N.V. - Depositary Receipt (Common Stock) | 0.61 | 0.00 | 488.31 | 20.94 | 0.3206 | 0.0202 | |||
| KKR / KKR & Co. Inc. | 3.67 | 0.00 | 488.19 | 15.07 | 0.3206 | 0.0049 | |||
| NVO / Novo Nordisk A/S - Depositary Receipt (Common Stock) | 7.03 | -7.02 | 488.04 | -6.90 | 0.3205 | -0.0696 | |||
| KDP / Keurig Dr Pepper Inc. | 14.61 | 0.00 | 483.05 | -3.39 | 0.3172 | -0.0548 | |||
| CVE / Cenovus Energy Inc. | 34.84 | -12.33 | 474.06 | -14.16 | 0.3113 | -0.0996 | |||
| CMG / Chipotle Mexican Grill, Inc. | 8.41 | 17.01 | 471.95 | 30.85 | 0.3099 | 0.0416 | |||
| GS / The Goldman Sachs Group, Inc. | 0.64 | 0.00 | 451.44 | 29.56 | 0.2964 | 0.0372 | |||
| NOC / Northrop Grumman Corporation | 0.90 | 26.27 | 451.08 | 23.30 | 0.2962 | 0.0240 | |||
| OMF / OneMain Holdings, Inc. | 7.76 | 0.00 | 442.29 | 16.61 | 0.2904 | 0.0082 | |||
| LIN / Linde plc | 0.92 | 7.99 | 431.50 | 8.81 | 0.2833 | -0.0117 | |||
| AIR / Airbus SE | 2.06 | -42.00 | 431.06 | -31.32 | 0.2831 | -0.1839 | |||
| RRX / Regal Rexnord Corporation | 2.97 | -18.15 | 431.03 | 4.21 | 0.2830 | -0.0247 | |||
| C / Citigroup Inc. | 4.94 | -26.79 | 420.89 | -12.22 | 0.2764 | -0.0804 | |||
| PGR / The Progressive Corporation | 1.57 | 0.00 | 419.68 | -5.71 | 0.2756 | -0.0556 | |||
| SO / The Southern Company | 4.32 | 46.53 | 397.05 | 46.34 | 0.2607 | 0.0588 | |||
| B / Barrick Mining Corporation | 18.84 | 13.15 | 392.28 | 21.19 | 0.2576 | 0.0167 | |||
| WYNN / Wynn Resorts, Limited | 3.93 | 71.07 | 368.55 | 91.90 | 0.2420 | 0.0991 | |||
| 1L30 / Lifco AB (publ) | 8.97 | 0.00 | 362.86 | 14.30 | 0.2383 | 0.0021 | |||
| EXR / Extra Space Storage Inc. | 2.45 | 0.00 | 361.70 | -0.71 | 0.2375 | -0.0335 | |||
| RNR / RenaissanceRe Holdings Ltd. | 1.45 | 0.00 | 351.24 | 1.21 | 0.2306 | -0.0276 | |||
| CH1300646267 / Bunge Global SA | 4.34 | 13.16 | 348.76 | 18.88 | 0.2290 | 0.0107 | |||
| NOW / ServiceNow, Inc. | 0.34 | 0.00 | 344.66 | 29.13 | 0.2263 | 0.0277 | |||
| UAL / United Airlines Holdings, Inc. | 4.24 | -9.60 | 337.38 | 4.25 | 0.2215 | -0.0193 | |||
| TMUS / T-Mobile US, Inc. | 1.40 | 0.00 | 333.01 | -10.67 | 0.2187 | -0.0587 | |||
| EQT / EQT Corporation | 5.70 | 27.21 | 332.52 | 38.86 | 0.2183 | 0.0402 | |||
| UNP / Union Pacific Corporation | 1.43 | 0.00 | 329.08 | -2.61 | 0.2161 | -0.0353 | |||
| MDLZ / Mondelez International, Inc. | 4.88 | 86.56 | 328.97 | 85.44 | 0.2160 | 0.0840 | |||
| CNC / Centene Corporation | 6.04 | 0.00 | 327.95 | -10.59 | 0.2153 | -0.0576 | |||
| VICI / VICI Properties Inc. | 10.04 | 0.00 | 327.19 | -0.06 | 0.2149 | -0.0287 | |||
| DS81 / DSV A/S | 1.35 | -26.95 | 324.68 | -15.41 | 0.2132 | -0.0573 | |||
| ASML / ASML Holding N.V. | 0.41 | 0.00 | 323.45 | 20.63 | 0.2124 | 0.0129 | |||
| KEYS / Keysight Technologies, Inc. | 1.97 | 0.00 | 322.50 | 9.41 | 0.2118 | -0.0076 | |||
| GLEN / Glencore plc | 82.81 | 0.00 | 322.35 | 5.82 | 0.2117 | -0.0150 | |||
| PAYX / Paychex, Inc. | 2.21 | -6.75 | 321.93 | -12.08 | 0.2114 | -0.0610 | |||
| XPO / XPO, Inc. | 2.54 | 0.00 | 320.40 | 17.39 | 0.2104 | 0.0073 | |||
| EFX / Equifax Inc. | 1.23 | 0.00 | 317.91 | 6.49 | 0.2088 | -0.0134 | |||
| BAC / Bank of America Corporation | 6.59 | 0.00 | 311.78 | 13.40 | 0.2047 | 0.0002 | |||
| WCN / Waste Connections, Inc. | 1.65 | 0.00 | 307.36 | -4.34 | 0.2018 | -0.0372 | |||
| FCX / Freeport-McMoRan Inc. | 6.83 | 0.00 | 296.06 | 14.50 | 0.1944 | 0.0020 | |||
| BX / Blackstone Inc. | 1.96 | -48.59 | 292.51 | -44.98 | 0.1921 | -0.2035 | |||
| PCOR / Procore Technologies, Inc. | 4.27 | 4.92 | 291.92 | 8.73 | 0.1917 | -0.0081 | |||
| RGLD / Royal Gold, Inc. | 1.63 | -9.20 | 290.45 | -1.24 | 0.1907 | -0.0281 | |||
| CHD / Church & Dwight Co., Inc. | 2.98 | 5.75 | 286.66 | -7.68 | 0.1882 | -0.0428 | |||
| DHI / D.R. Horton, Inc. | 2.22 | 48.13 | 286.54 | 50.22 | 0.1882 | 0.0462 | |||
| BLK / BlackRock, Inc. | 0.27 | 0.00 | 285.88 | 10.86 | 0.1877 | -0.0042 | |||
| MO / Altria Group, Inc. | 4.83 | -51.75 | 283.45 | -52.87 | 0.1861 | -0.2614 | |||
| HLT / Hilton Worldwide Holdings Inc. | 1.06 | 0.00 | 281.73 | 17.05 | 0.1850 | 0.0059 | |||
| ELV / Elevance Health, Inc. | 0.72 | 0.00 | 280.13 | -10.58 | 0.1839 | -0.0491 | |||
| SYF / Synchrony Financial | 4.18 | 0.00 | 278.90 | 26.07 | 0.1831 | 0.0185 | |||
| BURL / Burlington Stores, Inc. | 1.18 | 117.11 | 274.27 | 111.92 | 0.1801 | 0.0838 | |||
| MSI / Motorola Solutions, Inc. | 0.65 | 0.00 | 271.91 | -3.96 | 0.1785 | -0.0321 | |||
| SBGSY / Schneider Electric S.E. - Depositary Receipt (Common Stock) | 1.00 | 0.00 | 265.51 | 14.90 | 0.1743 | 0.0024 | |||
| IMB / Imperial Brands PLC | 6.51 | 0.00 | 257.08 | 6.79 | 0.1688 | -0.0103 | |||
| FLUT / Flutter Entertainment plc | 0.90 | 0.00 | 256.73 | 28.98 | 0.1686 | 0.0205 | |||
| NCLH / Norwegian Cruise Line Holdings Ltd. | 12.54 | 0.00 | 254.22 | 6.96 | 0.1669 | -0.0099 | |||
| XOM / Exxon Mobil Corporation | 2.35 | -10.27 | 253.80 | -18.67 | 0.1667 | -0.0655 | |||
| ACN / Accenture plc | 0.84 | 251.57 | 0.1652 | 0.1652 | |||||
| AMS / Amadeus IT Group, S.A. | 2.96 | 0.00 | 248.90 | 9.87 | 0.1634 | -0.0051 | |||
| APP / AppLovin Corporation | 0.70 | 245.90 | 0.1615 | 0.1615 | |||||
| STRK / Strategy Inc - Preferred Stock | 2.03 | 9.95 | 245.60 | 58.38 | 0.1613 | 0.0459 | |||
| STRD / Strategy Inc - Preferred Stock | 2.67 | 239.35 | 0.1572 | 0.1572 | |||||
| AMAT / Applied Materials, Inc. | 1.29 | -63.46 | 236.24 | -53.90 | 0.1551 | -0.2262 | |||
| PCG / PG&E Corporation | 16.84 | 0.00 | 234.78 | -18.86 | 0.1542 | -0.0611 | |||
| BIPI / BIP Bermuda Holdings I Limited - Corporate Bond/Note | 6.98 | 0.00 | 233.87 | 12.61 | 0.1536 | -0.0010 | |||
| WFC / Wells Fargo & Company | 2.89 | -15.33 | 231.23 | -5.50 | 0.1518 | -0.0302 | |||
| LYB / LyondellBasell Industries N.V. | 3.92 | 38.66 | 226.92 | 13.96 | 0.1490 | 0.0008 | |||
| FQVLF / First Quantum Minerals Ltd. | 12.39 | 0.00 | 220.03 | 32.11 | 0.1445 | 0.0206 | |||
| E3G1 / Evolution AB (publ) | 2.76 | -44.61 | 219.51 | -41.01 | 0.1441 | -0.1327 | |||
| DHR / Danaher Corporation | 1.11 | 0.00 | 218.56 | -3.64 | 0.1435 | -0.0252 | |||
| JAZZ / Jazz Pharmaceuticals plc | 2.00 | 5.55 | 212.24 | -9.78 | 0.1394 | -0.0357 | |||
| CFR / Compagnie Financière Richemont SA | 1.12 | 0.00 | 211.17 | 7.86 | 0.1387 | -0.0070 | |||
| XP / XP Inc. | 10.33 | 0.00 | 208.61 | 46.91 | 0.1370 | 0.0313 | |||
| REXR / Rexford Industrial Realty, Inc. | 5.80 | 0.00 | 206.39 | -9.14 | 0.1355 | -0.0335 | |||
| EL / EssilorLuxottica Société anonyme | 0.75 | 1.78 | 206.33 | -2.94 | 0.1355 | -0.0227 | |||
| APD / Air Products and Chemicals, Inc. | 0.73 | 25.94 | 205.62 | 20.44 | 0.1350 | 0.0080 | |||
| CFG / Citizens Financial Group, Inc. | 4.59 | 0.00 | 205.32 | 9.23 | 0.1348 | -0.0050 | |||
| DE / Deere & Company | 0.40 | 0.00 | 202.67 | 8.34 | 0.1331 | -0.0061 | |||
| YUM / Yum! Brands, Inc. | 1.36 | 0.00 | 201.77 | -5.83 | 0.1325 | -0.0269 | |||
| FIX / Comfort Systems USA, Inc. | 0.37 | 0.00 | 197.52 | 66.35 | 0.1297 | 0.0414 | |||
| EA / Electronic Arts Inc. | 1.24 | 2.46 | 197.34 | 13.22 | 0.1296 | -0.0001 | |||
| HDFCB / HDFC Bank Ltd | 8.30 | 0.00 | 193.71 | 9.57 | 0.1272 | -0.0043 | |||
| BRO / Brown & Brown, Inc. | 1.75 | 0.00 | 193.49 | -10.88 | 0.1271 | -0.0345 | |||
| CR / Crane Company | 1.02 | 0.00 | 193.15 | 23.97 | 0.1268 | 0.0109 | |||
| MTD / Mettler-Toledo International Inc. | 0.16 | 0.00 | 192.67 | -0.52 | 0.1265 | -0.0176 | |||
| VST / Vistra Corp. | 0.99 | 0.00 | 192.04 | 65.03 | 0.1261 | 0.0395 | |||
| LUNMF / Lundin Mining Corporation | 17.95 | 0.00 | 188.77 | 29.78 | 0.1240 | 0.0157 | |||
| MAA / Mid-America Apartment Communities, Inc. | 1.23 | 0.00 | 181.56 | -11.68 | 0.1192 | -0.0337 | |||
| DLTR / Dollar Tree, Inc. | 1.79 | 0.00 | 177.29 | 31.93 | 0.1164 | 0.0164 | |||
| FTAI / FTAI Aviation Ltd. | 1.54 | 176.98 | 0.1162 | 0.1162 | |||||
| CB / Chubb Limited | 0.61 | 0.00 | 176.09 | -4.06 | 0.1156 | -0.0209 | |||
| NI / NiSource Inc. | 4.20 | 0.00 | 169.60 | 0.62 | 0.1114 | -0.0140 | |||
| ZBH / Zimmer Biomet Holdings, Inc. | 1.85 | 169.08 | 0.1110 | 0.1110 | |||||
| EL / The Estée Lauder Companies Inc. | 2.00 | 161.60 | 0.1061 | 0.1061 | |||||
| HD / The Home Depot, Inc. | 0.43 | 0.00 | 159.15 | 0.04 | 0.1045 | -0.0139 | |||
| CMCSA / Comcast Corporation | 4.45 | -65.55 | 158.93 | -66.68 | 0.1044 | -0.2506 | |||
| FI4000552500 / ORDINARY SHARES | 14.39 | 154.71 | 0.1016 | 0.1016 | |||||
| HDB / HDFC Bank Limited - Depositary Receipt (Common Stock) | 1.97 | 0.00 | 151.40 | 15.40 | 0.0994 | 0.0018 | |||
| BME / B&M European Value Retail S.A. | 40.04 | 31.30 | 149.16 | 45.06 | 0.0979 | 0.0214 | |||
| NUE / Nucor Corporation | 1.15 | 148.96 | 0.0978 | 0.0978 | |||||
| MMM / 3M Company | 0.97 | 47.41 | 148.36 | 52.81 | 0.0974 | 0.0252 | |||
| STRF / Strategy Inc - Preferred Stock | 1.30 | 0.00 | 146.68 | 21.67 | 0.0963 | 0.0066 | |||
| ARE / Alexandria Real Estate Equities, Inc. | 1.98 | 23.18 | 143.87 | -3.29 | 0.0945 | -0.0162 | |||
| PG / The Procter & Gamble Company | 0.86 | 0.00 | 137.22 | -6.51 | 0.0901 | -0.0191 | |||
| ADBE / Adobe Inc. | 0.35 | 0.00 | 135.69 | 0.87 | 0.0891 | -0.0110 | |||
| MTN / Vail Resorts, Inc. | 0.85 | 0.00 | 133.83 | -1.81 | 0.0879 | -0.0135 | |||
| EXAS / Exact Sciences Corporation | 2.49 | 0.00 | 132.49 | 22.75 | 0.0870 | 0.0067 | |||
| CABK / CaixaBank, S.A. | 15.04 | 18.33 | 130.27 | 31.71 | 0.0855 | 0.0119 | |||
| REGN / Regeneron Pharmaceuticals, Inc. | 0.24 | -56.34 | 127.00 | -63.86 | 0.0834 | -0.1781 | |||
| UCG / UniCredit S.p.A. | 1.89 | 27.28 | 126.66 | 52.02 | 0.0832 | 0.0212 | |||
| BSX / Boston Scientific Corporation | 1.16 | 0.00 | 124.79 | 6.47 | 0.0819 | -0.0053 | |||
| SLB / Schlumberger Limited | 3.58 | 0.00 | 121.00 | -19.14 | 0.0795 | -0.0319 | |||
| CZR / Caesars Entertainment, Inc. | 3.99 | 0.00 | 113.21 | 13.56 | 0.0743 | 0.0002 | |||
| ILMN / Illumina, Inc. | 1.17 | -59.09 | 112.08 | -50.81 | 0.0736 | -0.0959 | |||
| FDX / FedEx Corporation | 0.48 | 0.00 | 109.80 | -6.76 | 0.0721 | -0.0155 | |||
| NKE / NIKE, Inc. | 1.53 | -17.30 | 108.42 | -7.45 | 0.0712 | -0.0160 | |||
| CDW / CDW Corporation | 0.60 | 0.00 | 106.77 | 11.44 | 0.0701 | -0.0012 | |||
| MCHPP / Microchip Technology Incorporated - Preferred Stock | 1.60 | 0.00 | 106.62 | 32.41 | 0.0700 | 0.0101 | |||
| MS / Morgan Stanley | 0.74 | 0.00 | 104.21 | 20.73 | 0.0684 | 0.0042 | |||
| ACGL / Arch Capital Group Ltd. | 1.13 | 0.00 | 102.46 | -5.33 | 0.0673 | -0.0133 | |||
| LII / Lennox International Inc. | 0.17 | 0.00 | 99.92 | 2.21 | 0.0656 | -0.0071 | |||
| INTC / Intel Corporation | 4.45 | 0.00 | 99.65 | -1.36 | 0.0654 | -0.0097 | |||
| COO / The Cooper Companies, Inc. | 1.35 | 0.00 | 96.39 | -15.64 | 0.0633 | -0.0217 | |||
| USFD / US Foods Holding Corp. | 1.24 | 95.77 | 0.0629 | 0.0629 | |||||
| SSNC / SS&C Technologies Holdings, Inc. | 1.13 | 0.00 | 93.50 | -0.87 | 0.0614 | -0.0088 | |||
| CNP / CenterPoint Energy, Inc. | 2.45 | 0.00 | 89.88 | 1.41 | 0.0590 | -0.0069 | |||
| RDOR3 / Rede D'Or São Luiz S.A. | 13.70 | -50.16 | 89.33 | -34.26 | 0.0587 | -0.0424 | |||
| VNOM / Viper Energy, Inc. | 2.34 | 89.06 | 0.0585 | 0.0585 | |||||
| FP / TotalEnergies SE | 1.34 | 7.13 | 82.33 | 1.73 | 0.0541 | -0.0062 | |||
| LINE / Lineage, Inc. | 1.65 | 0.00 | 71.75 | -25.77 | 0.0471 | -0.0248 | |||
| XVALO / Vale S.A. | 7.25 | -59.09 | 70.23 | -60.10 | 0.0461 | -0.0849 | |||
| EDEN / Edenred SE | 2.18 | 0.00 | 67.51 | -5.09 | 0.0443 | -0.0086 | |||
| 7974 / Nintendo Co., Ltd. | 0.68 | 65.09 | 0.0427 | 0.0427 | |||||
| DPZ / Domino's Pizza, Inc. | 0.14 | 0.00 | 62.77 | -1.92 | 0.0412 | -0.0064 | |||
| AGL / agilon health, inc. | 26.80 | 7.59 | 61.64 | -42.85 | 0.0405 | -0.0398 | |||
| CXT / Crane NXT, Co. | 1.07 | 0.00 | 57.51 | 4.86 | 0.0378 | -0.0030 | |||
| BN / Danone S.A. | 0.70 | 0.00 | 56.92 | 6.62 | 0.0374 | -0.0023 | |||
| DG / Dollar General Corporation | 0.48 | 0.00 | 55.23 | 30.08 | 0.0363 | 0.0047 | |||
| SCHW / The Charles Schwab Corporation | 0.59 | 0.00 | 53.91 | 16.56 | 0.0354 | 0.0010 | |||
| MCK / McKesson Corporation | 0.07 | 4.53 | 52.10 | 13.81 | 0.0342 | 0.0002 | |||
| TSCO / Tractor Supply Company | 0.92 | 0.00 | 48.71 | -4.23 | 0.0320 | -0.0059 | |||
| FIS / Fidelity National Information Services, Inc. | 0.58 | 0.00 | 46.82 | 9.01 | 0.0307 | -0.0012 | |||
| ABBV / AbbVie Inc. | 0.19 | 0.00 | 34.66 | -11.41 | 0.0228 | -0.0064 | |||
| US8252528851 / Invesco Government & Agency Portfolio, Institutional Class | 30.83 | 181.58 | 0.0202 | 0.0122 | |||||
| RACE / Ferrari N.V. | 0.06 | 0.00 | 28.56 | 14.91 | 0.0188 | 0.0003 | |||
| ATO / Atmos Energy Corporation | 0.17 | 26.12 | 0.0172 | 0.0172 | |||||
| BTI / British American Tobacco p.l.c. - Depositary Receipt (Common Stock) | 0.55 | 0.00 | 25.97 | 14.40 | 0.0171 | 0.0002 | |||
| CHECKOUT PAYMENTS GROUP LTD B PP (PHYSICAL) (NOT LISTED OR TRADING) / EC (N/A) | 0.16 | 14.76 | 0.0097 | 0.0097 |