Statistik Asas
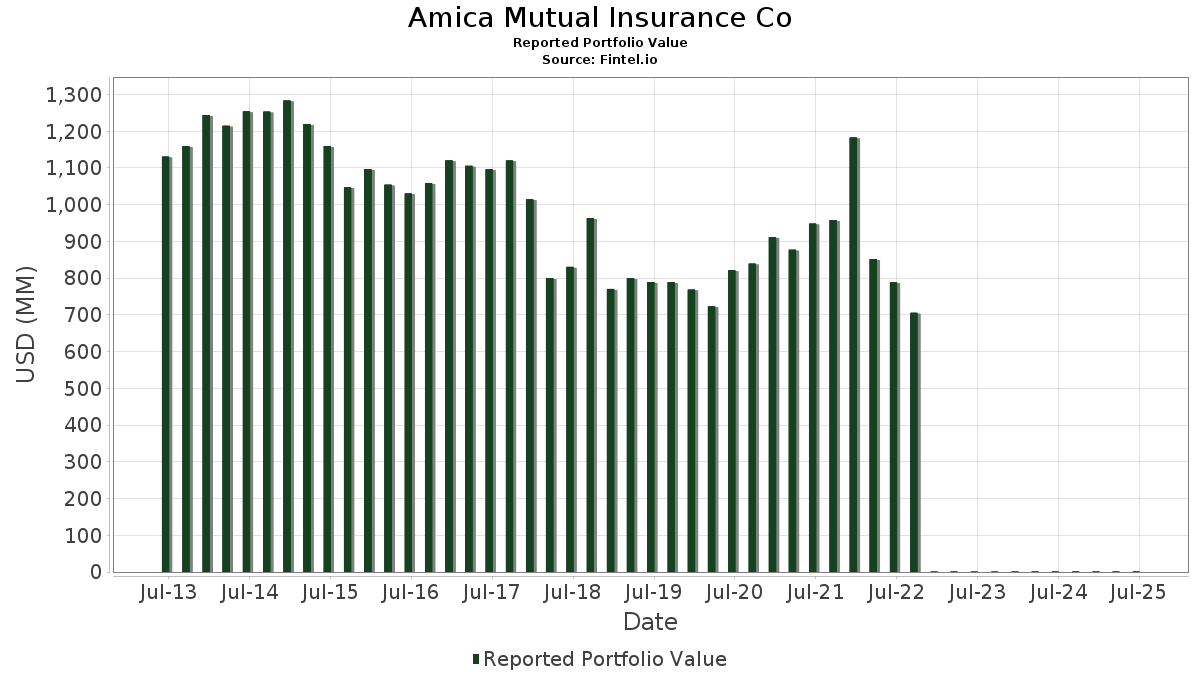
| Nilai Portfolio | $ 1,037,026 |
| Kedudukan Semasa | 139 |
Pegangan Terkini, Prestasi, AUM (dari 13F, 13D)
Amica Mutual Insurance Co telah mendedahkan 139 jumlah pegangan dalam pemfailan SEC terkini mereka. Nilai portfolio terkini dikira sebagai $ 1,037,026 USD. Aset Sebenar Di Bawah Pengurusan (AUM) ialah nilai ini ditambah dengan tunai (yang tidak didedahkan). Pegangan teratas Amica Mutual Insurance Co ialah iShares Trust - iShares Core MSCI Total International Stock ETF (US:IXUS) , Microsoft Corporation (US:MSFT) , NVIDIA Corporation (US:NVDA) , Apple Inc. (US:AAPL) , and Amazon.com, Inc. (US:AMZN) . Kedudukan baharu Amica Mutual Insurance Co termasuk Zoetis Inc. (US:ZTS) , The Cooper Companies, Inc. (US:COO) , UL Solutions Inc. (US:ULS) , United States Lime & Minerals, Inc. (US:USLM) , and .
Kenaikan Teratas Suku Tahun Ini
Kami menggunakan perubahan dalam peruntukan portfolio kerana ini adalah metrik yang paling bermakna. Perubahan boleh disebabkan oleh perdagangan atau perubahan dalam harga saham.
| Sekuriti | Saham (MM) |
Nilai (MM$) |
Portfolio % | ΔPortfolio % |
|---|---|---|---|---|
| 3.39 | 0.26 | 25.3159 | 6.7476 | |
| 0.34 | 0.05 | 5.1998 | 1.0588 | |
| 0.12 | 0.06 | 5.7376 | 0.7231 | |
| 0.02 | 0.00 | 0.3251 | 0.3251 | |
| 0.01 | 0.00 | 0.2078 | 0.2078 | |
| 0.09 | 0.01 | 0.8315 | 0.2009 | |
| 0.03 | 0.01 | 0.7582 | 0.1878 | |
| 0.12 | 0.01 | 0.5584 | 0.1701 | |
| 0.01 | 0.00 | 0.1350 | 0.1350 | |
| 0.04 | 0.01 | 0.9191 | 0.1111 |
Penurunan Teratas Suku Tahun Ini
Kami menggunakan perubahan dalam peruntukan portfolio kerana ini adalah metrik yang paling bermakna. Perubahan boleh disebabkan oleh perdagangan atau perubahan dalam harga saham.
| Sekuriti | Saham (MM) |
Nilai (MM$) |
Portfolio % | ΔPortfolio % |
|---|---|---|---|---|
| 0.19 | 0.04 | 3.7354 | -1.3349 | |
| 0.02 | 0.01 | 0.7453 | -0.6834 | |
| 0.03 | 0.02 | 1.6082 | -0.4052 | |
| 0.04 | 0.00 | 0.3653 | -0.3764 | |
| 0.05 | 0.02 | 1.5812 | -0.3200 | |
| 0.10 | 0.01 | 1.0363 | -0.2869 | |
| 0.03 | 0.01 | 1.4191 | -0.2787 | |
| 0.01 | 0.00 | 0.3090 | -0.2601 | |
| 0.04 | 0.01 | 0.6302 | -0.2571 | |
| 0.09 | 0.01 | 0.9081 | -0.2358 |
13F dan Pemfailan Dana
Borang ini telah difailkan pada 2025-08-07 untuk tempoh pelaporan 2025-06-30. Klik ikon pautan untuk melihat sejarah transaksi penuh.
Tingkatkan untuk membuka data premium dan eksport ke Excel ![]() .
.
| Sekuriti | Jenis | Purata Harga Saham | Saham (MM) |
ΔSaham (%) |
ΔSaham (%) |
Nilai ($MM) |
Portfolio (%) |
ΔPortfolio (%) |
|
|---|---|---|---|---|---|---|---|---|---|
| IXUS / iShares Trust - iShares Core MSCI Total International Stock ETF | 3.39 | 40.59 | 0.26 | 55.95 | 25.3159 | 6.7476 | |||
| MSFT / Microsoft Corporation | 0.12 | -1.40 | 0.06 | 31.11 | 5.7376 | 0.7231 | |||
| NVDA / NVIDIA Corporation | 0.34 | -1.64 | 0.05 | 43.24 | 5.1998 | 1.0588 | |||
| AAPL / Apple Inc. | 0.19 | -8.93 | 0.04 | -17.39 | 3.7354 | -1.3349 | |||
| AMZN / Amazon.com, Inc. | 0.16 | -3.49 | 0.04 | 12.90 | 3.3933 | -0.0882 | |||
| META / Meta Platforms, Inc. | 0.04 | -11.47 | 0.03 | 16.00 | 2.7994 | -0.0202 | |||
| GOOGL / Alphabet Inc. | 0.11 | 0.00 | 0.02 | 18.75 | 1.8617 | -0.0037 | |||
| BRK.A / Berkshire Hathaway Inc. | 0.03 | 0.00 | 0.02 | -11.11 | 1.6082 | -0.4052 | |||
| V / Visa Inc. | 0.05 | -6.26 | 0.02 | -5.88 | 1.5812 | -0.3200 | |||
| PM / Philip Morris International Inc. | 0.08 | -9.87 | 0.02 | 7.14 | 1.4645 | -0.1524 | |||
| MA / Mastercard Incorporated | 0.03 | -6.91 | 0.01 | -6.67 | 1.4191 | -0.2787 | |||
| PH / Parker-Hannifin Corporation | 0.02 | 0.00 | 0.01 | 16.67 | 1.3897 | 0.0088 | |||
| UNP / Union Pacific Corporation | 0.05 | 0.00 | 0.01 | 0.00 | 1.1759 | -0.2028 | |||
| XLRE / The Select Sector SPDR Trust - The Real Estate Select Sector SPDR Fund | 0.29 | 0.00 | 0.01 | 0.00 | 1.1700 | -0.1788 | |||
| LLY / Eli Lilly and Company | 0.01 | 0.00 | 0.01 | 0.00 | 1.0639 | -0.2232 | |||
| BJ / BJ's Wholesale Club Holdings, Inc. | 0.10 | -5.38 | 0.01 | -16.67 | 1.0363 | -0.2869 | |||
| TXN / Texas Instruments Incorporated | 0.05 | 8.13 | 0.01 | 25.00 | 1.0169 | 0.0874 | |||
| CRM / Salesforce, Inc. | 0.04 | 0.00 | 0.01 | 0.00 | 1.0033 | -0.1240 | |||
| CCK / Crown Holdings, Inc. | 0.10 | -3.46 | 0.01 | 11.11 | 0.9829 | -0.0247 | |||
| PB / Prosperity Bancshares, Inc. | 0.14 | 0.00 | 0.01 | -10.00 | 0.9575 | -0.1533 | |||
| PG / The Procter & Gamble Company | 0.06 | 0.00 | 0.01 | -10.00 | 0.9194 | -0.2035 | |||
| TSM / Taiwan Semiconductor Manufacturing Company Limited - Depositary Receipt (Common Stock) | 0.04 | -4.80 | 0.01 | 28.57 | 0.9191 | 0.1111 | |||
| INTU / Intuit Inc. | 0.01 | 0.00 | 0.01 | 28.57 | 0.9115 | 0.1002 | |||
| XOM / Exxon Mobil Corporation | 0.09 | 0.00 | 0.01 | -10.00 | 0.9081 | -0.2358 | |||
| BLK / BlackRock, Inc. | 0.01 | 7.23 | 0.01 | 28.57 | 0.9007 | 0.0354 | |||
| GD / General Dynamics Corporation | 0.03 | 0.00 | 0.01 | 12.50 | 0.8893 | -0.0597 | |||
| CHTR / Charter Communications, Inc. | 0.02 | -7.28 | 0.01 | 0.00 | 0.8331 | -0.0917 | |||
| APH / Amphenol Corporation | 0.09 | 0.00 | 0.01 | 60.00 | 0.8315 | 0.2009 | |||
| RTX / RTX Corporation | 0.06 | 0.00 | 0.01 | 14.29 | 0.7904 | -0.0283 | |||
| JPM / JPMorgan Chase & Co. | 0.03 | 28.41 | 0.01 | 40.00 | 0.7582 | 0.1878 | |||
| UNH / UnitedHealth Group Incorporated | 0.02 | 0.00 | 0.01 | -41.67 | 0.7453 | -0.6834 | |||
| ENTG / Entegris, Inc. | 0.09 | 0.00 | 0.01 | -12.50 | 0.7144 | -0.1704 | |||
| LRCX / Lam Research Corporation | 0.08 | 0.00 | 0.01 | 40.00 | 0.7085 | 0.1043 | |||
| KLAC / KLA Corporation | 0.01 | -9.91 | 0.01 | 20.00 | 0.6736 | 0.0257 | |||
| STE / STERIS plc | 0.03 | -19.20 | 0.01 | -14.29 | 0.6599 | -0.2200 | |||
| ACN / Accenture plc | 0.02 | 0.00 | 0.01 | -14.29 | 0.6580 | -0.1264 | |||
| NEE / NextEra Energy, Inc. | 0.10 | 0.00 | 0.01 | 0.00 | 0.6462 | -0.1073 | |||
| OTIS / Otis Worldwide Corporation | 0.07 | 0.00 | 0.01 | 0.00 | 0.6396 | -0.1216 | |||
| JNJ / Johnson & Johnson | 0.04 | -11.95 | 0.01 | -25.00 | 0.6302 | -0.2571 | |||
| APD / Air Products and Chemicals, Inc. | 0.02 | 0.00 | 0.01 | 0.00 | 0.6187 | -0.1199 | |||
| CVX / Chevron Corporation | 0.04 | 0.00 | 0.01 | -14.29 | 0.5976 | -0.1996 | |||
| MCD / McDonald's Corporation | 0.02 | 0.00 | 0.01 | 0.00 | 0.5933 | -0.1311 | |||
| SPGI / S&P Global Inc. | 0.01 | 0.00 | 0.01 | 20.00 | 0.5870 | -0.0588 | |||
| TMO / Thermo Fisher Scientific Inc. | 0.01 | 0.00 | 0.01 | -28.57 | 0.5762 | -0.2312 | |||
| LAZ / Lazard, Inc. | 0.12 | 48.21 | 0.01 | 66.67 | 0.5584 | 0.1701 | |||
| JKHY / Jack Henry & Associates, Inc. | 0.03 | 0.00 | 0.01 | 0.00 | 0.5262 | -0.0827 | |||
| GOOG / Alphabet Inc. | 0.03 | -20.91 | 0.01 | -16.67 | 0.5255 | -0.1427 | |||
| MS / Morgan Stanley | 0.04 | -10.58 | 0.01 | 25.00 | 0.5201 | -0.0300 | |||
| AXP / American Express Company | 0.02 | -10.98 | 0.01 | 0.00 | 0.5197 | -0.0427 | |||
| TYL / Tyler Technologies, Inc. | 0.01 | 0.00 | 0.01 | 25.00 | 0.4893 | -0.0586 | |||
| GOLF / Acushnet Holdings Corp. | 0.07 | 0.00 | 0.01 | 25.00 | 0.4832 | -0.0370 | |||
| ABBV / AbbVie Inc. | 0.03 | 0.00 | 0.00 | -20.00 | 0.4776 | -0.1380 | |||
| CLH / Clean Harbors, Inc. | 0.02 | 0.00 | 0.00 | 0.00 | 0.4641 | 0.0122 | |||
| ABNB / Airbnb, Inc. | 0.04 | 0.00 | 0.00 | 0.00 | 0.4589 | -0.0141 | |||
| DPZ / Domino's Pizza, Inc. | 0.01 | -16.43 | 0.00 | -20.00 | 0.4506 | -0.1769 | |||
| WM / Waste Management, Inc. | 0.02 | 0.00 | 0.00 | 0.00 | 0.4169 | -0.0647 | |||
| HD / The Home Depot, Inc. | 0.01 | 0.00 | 0.00 | 0.00 | 0.4097 | -0.0579 | |||
| XLU / The Select Sector SPDR Trust - The Utilities Select Sector SPDR Fund | 0.05 | 0.00 | 0.00 | 0.00 | 0.4089 | -0.0419 | |||
| AMT / American Tower Corporation | 0.02 | 0.00 | 0.00 | 0.00 | 0.3843 | -0.0477 | |||
| ABT / Abbott Laboratories | 0.03 | 0.00 | 0.00 | 0.00 | 0.3710 | -0.0422 | |||
| AWK / American Water Works Company, Inc. | 0.03 | 0.00 | 0.00 | -25.00 | 0.3681 | -0.0776 | |||
| PFE / Pfizer Inc. | 0.16 | 0.00 | 0.00 | 0.00 | 0.3671 | -0.0711 | |||
| DHR / Danaher Corporation | 0.02 | 0.00 | 0.00 | 0.00 | 0.3670 | -0.0678 | |||
| IEO / iShares Trust - iShares U.S. Oil & Gas Exploration & Production ETF | 0.04 | -39.97 | 0.00 | -50.00 | 0.3653 | -0.3764 | |||
| ALC / Alcon Inc. | 0.04 | 0.00 | 0.00 | -25.00 | 0.3590 | -0.0819 | |||
| ZTS / Zoetis Inc. | 0.02 | 0.00 | 0.3251 | 0.3251 | |||||
| CRL / Charles River Laboratories International, Inc. | 0.02 | 0.00 | 0.00 | 0.00 | 0.3243 | -0.0430 | |||
| UBER / Uber Technologies, Inc. | 0.03 | 0.00 | 0.00 | 50.00 | 0.3100 | 0.0335 | |||
| MLM / Martin Marietta Materials, Inc. | 0.01 | -46.00 | 0.00 | -40.00 | 0.3090 | -0.2601 | |||
| APTV / Aptiv PLC | 0.04 | -17.79 | 0.00 | -33.33 | 0.2849 | -0.0602 | |||
| NKE / NIKE, Inc. | 0.04 | 0.00 | 0.00 | 0.00 | 0.2839 | -0.0058 | |||
| HSY / The Hershey Company | 0.02 | 0.00 | 0.00 | 0.00 | 0.2733 | -0.0482 | |||
| XOP / SPDR Series Trust - SPDR S&P Oil & Gas Exploration & Production ETF | 0.02 | 0.00 | 0.00 | 0.00 | 0.2378 | -0.0465 | |||
| IEZ / iShares Trust - iShares U.S. Oil Equipment & Services ETF | 0.14 | -14.49 | 0.00 | -33.33 | 0.2261 | -0.1208 | |||
| MO / Altria Group, Inc. | 0.04 | 0.00 | 0.00 | 0.00 | 0.2255 | -0.0382 | |||
| TJX / The TJX Companies, Inc. | 0.02 | 0.00 | 0.00 | 0.00 | 0.2123 | -0.0268 | |||
| KIE / SPDR Series Trust - SPDR S&P Insurance ETF | 0.04 | 0.00 | 0.00 | 0.00 | 0.2099 | -0.0331 | |||
| HII / Huntington Ingalls Industries, Inc. | 0.01 | 0.00 | 0.2078 | 0.2078 | |||||
| TSLA / Tesla, Inc. | 0.01 | -22.89 | 0.00 | 0.00 | 0.2057 | -0.0428 | |||
| ORLY / O'Reilly Automotive, Inc. | 0.02 | 1,400.00 | 0.00 | -50.00 | 0.1855 | -0.0390 | |||
| SYBT / Stock Yards Bancorp, Inc. | 0.02 | -17.18 | 0.00 | 0.00 | 0.1718 | -0.0354 | |||
| GWRE / Guidewire Software, Inc. | 0.01 | 0.00 | 0.00 | 0.00 | 0.1604 | 0.0146 | |||
| CG / The Carlyle Group Inc. | 0.03 | -9.88 | 0.00 | 0.00 | 0.1575 | -0.0118 | |||
| SCI / Service Corporation International | 0.02 | 0.00 | 0.00 | 0.00 | 0.1570 | -0.0196 | |||
| IWM / iShares Trust - iShares Russell 2000 ETF | 0.01 | 0.00 | 0.00 | 0.00 | 0.1533 | -0.0085 | |||
| BFB / Brown-Forman Corp. - Class B | 0.06 | 0.00 | 0.00 | 0.00 | 0.1515 | -0.0666 | |||
| ALLE / Allegion plc | 0.01 | 0.00 | 0.00 | 0.00 | 0.1504 | -0.0050 | |||
| TXT / Textron Inc. | 0.02 | 0.00 | 0.00 | 0.00 | 0.1457 | -0.0040 | |||
| FSV / FirstService Corporation | 0.01 | 0.00 | 0.00 | 0.00 | 0.1370 | -0.0116 | |||
| TEX / Terex Corporation | 0.03 | 0.00 | 0.00 | 0.00 | 0.1369 | 0.0104 | |||
| PEP / PepsiCo, Inc. | 0.01 | 0.00 | 0.1350 | 0.1350 | |||||
| DKNG / DraftKings Inc. | 0.03 | 0.00 | 0.00 | 0.00 | 0.1323 | 0.0154 | |||
| GTM / ZoomInfo Technologies Inc. | 0.13 | 0.00 | 0.00 | 0.00 | 0.1279 | -0.0164 | |||
| OSK / Oshkosh Corporation | 0.01 | 0.00 | 0.00 | 0.00 | 0.1209 | 0.0065 | |||
| CHE / Chemed Corporation | 0.00 | 0.00 | 0.00 | 0.00 | 0.1207 | -0.0535 | |||
| HQY / HealthEquity, Inc. | 0.01 | -24.38 | 0.00 | 0.00 | 0.1193 | -0.0327 | |||
| CELH / Celsius Holdings, Inc. | 0.03 | 0.00 | 0.00 | 0.1174 | 0.0144 | ||||
| GGG / Graco Inc. | 0.01 | -10.92 | 0.00 | 0.00 | 0.1151 | -0.0283 | |||
| ELS / Equity LifeStyle Properties, Inc. | 0.02 | 0.00 | 0.00 | 0.00 | 0.1148 | -0.0270 | |||
| TKR / The Timken Company | 0.02 | 0.00 | 0.00 | 0.00 | 0.1138 | -0.0149 | |||
| XBI / SPDR Series Trust - SPDR S&P Biotech ETF | 0.01 | 0.00 | 0.00 | 0.00 | 0.1130 | -0.0132 | |||
| TRU / TransUnion | 0.01 | 0.00 | 0.00 | 0.00 | 0.1094 | -0.0085 | |||
| WMG / Warner Music Group Corp. | 0.04 | 0.00 | 0.00 | 0.00 | 0.1044 | -0.0329 | |||
| INVH / Invitation Homes Inc. | 0.03 | 0.00 | 0.00 | 0.00 | 0.1038 | -0.0221 | |||
| SITM / SiTime Corporation | 0.01 | -14.15 | 0.00 | 0.1030 | 0.0048 | ||||
| COO / The Cooper Companies, Inc. | 0.01 | 0.00 | 0.1022 | 0.1022 | |||||
| 4RH / Ryman Hospitality Properties, Inc. | 0.01 | 0.00 | 0.00 | 0.0998 | -0.0058 | ||||
| MTN / Vail Resorts, Inc. | 0.01 | 0.00 | 0.00 | 0.00 | 0.0967 | -0.0157 | |||
| SPSC / SPS Commerce, Inc. | 0.01 | 20.06 | 0.00 | 0.0948 | 0.0068 | ||||
| REGN / Regeneron Pharmaceuticals, Inc. | 0.00 | 0.00 | 0.00 | -100.00 | 0.0927 | -0.0352 | |||
| JBI / Janus International Group, Inc. | 0.11 | 0.00 | 0.00 | 0.0863 | -0.0008 | ||||
| AVY / Avery Dennison Corporation | 0.00 | 0.00 | 0.00 | 0.0824 | -0.0130 | ||||
| JBSS / John B. Sanfilippo & Son, Inc. | 0.01 | 0.00 | 0.00 | 0.0781 | -0.0218 | ||||
| SNPS / Synopsys, Inc. | 0.00 | 0.00 | 0.0717 | 0.0717 | |||||
| CDNS / Cadence Design Systems, Inc. | 0.00 | 0.00 | 0.0691 | 0.0691 | |||||
| XRT / SPDR Series Trust - SPDR S&P Retail ETF | 0.01 | 0.00 | 0.00 | 0.0684 | -0.0017 | ||||
| EVRG / Evergy, Inc. | 0.01 | 0.00 | 0.00 | 0.0678 | -0.0096 | ||||
| SDRL / Seadrill Limited | 0.03 | 0.00 | 0.00 | 0.0652 | -0.0057 | ||||
| NATH / Nathan's Famous, Inc. | 0.01 | 0.00 | 0.00 | 0.0639 | 0.0003 | ||||
| PBH / Prestige Consumer Healthcare Inc. | 0.01 | -34.67 | 0.00 | -100.00 | 0.0629 | -0.0555 | |||
| NI / NiSource Inc. | 0.02 | 0.00 | 0.00 | 0.0626 | -0.0084 | ||||
| ES / Eversource Energy | 0.01 | 0.00 | 0.00 | 0.0609 | -0.0070 | ||||
| CMS / CMS Energy Corporation | 0.01 | 0.00 | 0.00 | 0.0602 | -0.0143 | ||||
| HUBG / Hub Group, Inc. | 0.02 | 0.00 | 0.00 | 0.0590 | -0.0160 | ||||
| SAM / The Boston Beer Company, Inc. | 0.00 | 0.00 | 0.00 | 0.0590 | -0.0253 | ||||
| EL / The Estée Lauder Companies Inc. | 0.01 | 0.00 | 0.00 | 0.0584 | 0.0039 | ||||
| CMP / Compass Minerals International, Inc. | 0.03 | -37.45 | 0.00 | 0.0572 | 0.0090 | ||||
| XSW / SPDR Series Trust - SPDR S&P Software & Services ETF | 0.00 | -19.55 | 0.00 | 0.0554 | -0.0108 | ||||
| CROX / Crocs, Inc. | 0.00 | 0.00 | 0.00 | 0.0462 | -0.0091 | ||||
| TW / Tradeweb Markets Inc. | 0.00 | 0.00 | 0.00 | 0.0423 | -0.0067 | ||||
| XME / SPDR Series Trust - SPDR S&P Metals & Mining ETF | 0.01 | 0.00 | 0.00 | 0.0421 | 0.0022 | ||||
| MKTX / MarketAxess Holdings Inc. | 0.00 | 0.00 | 0.00 | 0.0420 | -0.0044 | ||||
| KLC / KinderCare Learning Companies, Inc. | 0.03 | 91.15 | 0.00 | 0.0335 | 0.0106 | ||||
| HWKN / Hawkins, Inc. | 0.00 | 0.00 | 0.00 | 0.0317 | 0.0047 | ||||
| MAN / ManpowerGroup Inc. | 0.01 | 0.00 | 0.00 | 0.0250 | -0.0159 | ||||
| SPRY / ARS Pharmaceuticals, Inc. | 0.01 | 0.00 | 0.00 | 0.0241 | 0.0042 | ||||
| ADMA / ADMA Biologics, Inc. | 0.01 | 0.00 | 0.00 | 0.0187 | -0.0045 | ||||
| ULS / UL Solutions Inc. | 0.00 | 0.00 | 0.0069 | 0.0069 | |||||
| USLM / United States Lime & Minerals, Inc. | 0.00 | 0.00 | 0.0065 | 0.0065 | |||||
| KO / The Coca-Cola Company | 0.00 | -100.00 | 0.00 | 0.0000 | |||||
| NEOG / Neogen Corporation | 0.00 | -100.00 | 0.00 | 0.0000 | |||||
| SKX / Skechers U.S.A., Inc. | 0.00 | -100.00 | 0.00 | 0.0000 | |||||
| BMY / Bristol-Myers Squibb Company | 0.00 | -100.00 | 0.00 | 0.0000 |