Statistik Asas
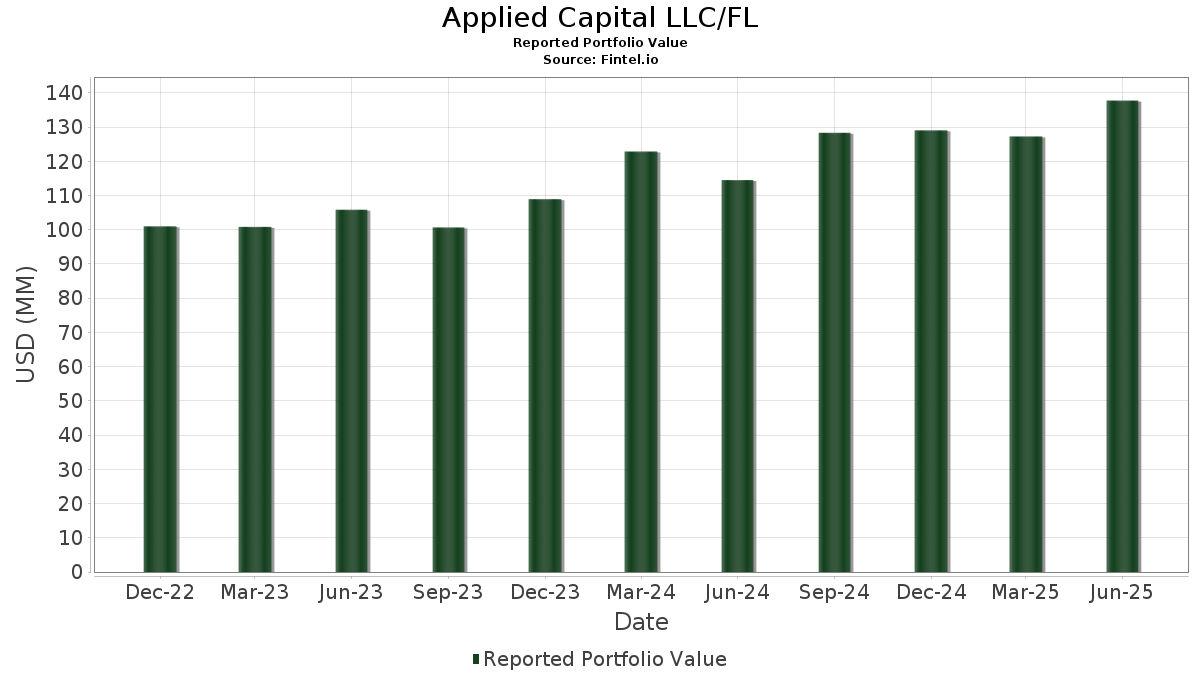
| Nilai Portfolio | $ 137,728,693 |
| Kedudukan Semasa | 84 |
Pegangan Terkini, Prestasi, AUM (dari 13F, 13D)
Applied Capital LLC/FL telah mendedahkan 84 jumlah pegangan dalam pemfailan SEC terkini mereka. Nilai portfolio terkini dikira sebagai $ 137,728,693 USD. Aset Sebenar Di Bawah Pengurusan (AUM) ialah nilai ini ditambah dengan tunai (yang tidak didedahkan). Pegangan teratas Applied Capital LLC/FL ialah Microsoft Corporation (US:MSFT) , Meta Platforms, Inc. (US:META) , Caterpillar Inc. (US:CAT) , Alphabet Inc. (US:GOOG) , and Parker-Hannifin Corporation (US:PH) . Kedudukan baharu Applied Capital LLC/FL termasuk Comfort Systems USA, Inc. (US:FIX) , Chevron Corporation (US:CVX) , .
Kenaikan Teratas Suku Tahun Ini
Kami menggunakan perubahan dalam peruntukan portfolio kerana ini adalah metrik yang paling bermakna. Perubahan boleh disebabkan oleh perdagangan atau perubahan dalam harga saham.
| Sekuriti | Saham (MM) |
Nilai (MM$) |
Portfolio % | ΔPortfolio % |
|---|---|---|---|---|
| 0.01 | 1.75 | 1.2700 | 1.2700 | |
| 0.00 | 1.30 | 0.9464 | 0.9464 | |
| 0.01 | 6.23 | 4.5202 | 0.8307 | |
| 0.01 | 5.52 | 4.0101 | 0.6469 | |
| 0.02 | 4.17 | 3.0244 | 0.3371 | |
| 0.00 | 0.70 | 0.5090 | 0.3185 | |
| 0.01 | 3.40 | 2.4673 | 0.2692 | |
| 0.00 | 0.37 | 0.2656 | 0.2656 | |
| 0.01 | 4.62 | 3.3556 | 0.2640 | |
| 0.01 | 2.93 | 2.1270 | 0.1870 |
Penurunan Teratas Suku Tahun Ini
Kami menggunakan perubahan dalam peruntukan portfolio kerana ini adalah metrik yang paling bermakna. Perubahan boleh disebabkan oleh perdagangan atau perubahan dalam harga saham.
| Sekuriti | Saham (MM) |
Nilai (MM$) |
Portfolio % | ΔPortfolio % |
|---|---|---|---|---|
| 0.00 | 1.54 | 1.1162 | -0.7319 | |
| 0.01 | 3.07 | 2.2307 | -0.5244 | |
| 0.03 | 1.45 | 1.0521 | -0.2631 | |
| 0.07 | 2.06 | 1.4940 | -0.2383 | |
| 0.01 | 1.80 | 1.3073 | -0.2290 | |
| 0.01 | 1.87 | 1.3564 | -0.2221 | |
| 0.02 | 4.31 | 3.1267 | -0.2193 | |
| 0.03 | 2.42 | 1.7535 | -0.1756 | |
| 0.01 | 3.35 | 2.4320 | -0.1606 | |
| 0.03 | 1.61 | 1.1704 | -0.1482 |
13F dan Pemfailan Dana
Borang ini telah difailkan pada 2025-07-24 untuk tempoh pelaporan 2025-06-30. Klik ikon pautan untuk melihat sejarah transaksi penuh.
Tingkatkan untuk membuka data premium dan eksport ke Excel ![]() .
.
| Sekuriti | Jenis | Purata Harga Saham | Saham (MM) |
ΔSaham (%) |
ΔSaham (%) |
Nilai ($MM) |
Portfolio (%) |
ΔPortfolio (%) |
|
|---|---|---|---|---|---|---|---|---|---|
| MSFT / Microsoft Corporation | 0.01 | 0.08 | 6.23 | 32.62 | 4.5202 | 0.8307 | |||
| META / Meta Platforms, Inc. | 0.01 | 0.78 | 5.52 | 29.07 | 4.0101 | 0.6469 | |||
| CAT / Caterpillar Inc. | 0.01 | -0.19 | 4.62 | 17.49 | 3.3556 | 0.2640 | |||
| GOOG / Alphabet Inc. | 0.03 | 0.93 | 4.53 | 14.60 | 3.2878 | 0.1823 | |||
| PH / Parker-Hannifin Corporation | 0.01 | -0.72 | 4.34 | 14.07 | 3.1493 | 0.1612 | |||
| TRV / The Travelers Companies, Inc. | 0.02 | -0.02 | 4.31 | 1.15 | 3.1267 | -0.2193 | |||
| PAG / Penske Automotive Group, Inc. | 0.02 | 2.09 | 4.17 | 21.82 | 3.0244 | 0.3371 | |||
| SPY / SPDR S&P 500 ETF | Call | 0.01 | 10.00 | 3.40 | 21.53 | 2.4673 | 0.2692 | ||
| MA / Mastercard Incorporated | 0.01 | 0.15 | 3.39 | 2.66 | 2.4631 | -0.1335 | |||
| V / Visa Inc. | 0.01 | 0.22 | 3.35 | 1.55 | 2.4320 | -0.1606 | |||
| PM / Philip Morris International Inc. | 0.02 | 0.10 | 3.22 | 14.83 | 2.3393 | 0.1348 | |||
| WSO / Watsco, Inc. | 0.01 | 0.87 | 3.07 | -12.35 | 2.2307 | -0.5244 | |||
| JPM / JPMorgan Chase & Co. | 0.01 | 0.07 | 2.99 | 18.26 | 2.1725 | 0.1842 | |||
| AXP / American Express Company | 0.01 | 0.10 | 2.93 | 18.68 | 2.1270 | 0.1870 | |||
| MCO / Moody's Corporation | 0.01 | -0.05 | 2.91 | 7.65 | 2.1148 | -0.0116 | |||
| NDAQ / Nasdaq, Inc. | 0.03 | -0.02 | 2.84 | 17.87 | 2.0592 | 0.1680 | |||
| WFC / Wells Fargo & Company | 0.03 | 0.05 | 2.52 | 11.65 | 1.8298 | 0.0560 | |||
| PCAR / PACCAR Inc | 0.03 | 0.78 | 2.42 | -1.59 | 1.7535 | -0.1756 | |||
| RY / Royal Bank of Canada | 0.02 | -0.62 | 2.21 | 15.99 | 1.6074 | 0.1073 | |||
| WRB / W. R. Berkley Corporation | 0.03 | 0.04 | 2.16 | 3.25 | 1.5682 | -0.0752 | |||
| CMI / Cummins Inc. | 0.01 | -0.02 | 2.13 | 4.47 | 1.5463 | -0.0558 | |||
| EPD / Enterprise Products Partners L.P. - Limited Partnership | 0.07 | 2.78 | 2.06 | -6.67 | 1.4940 | -0.2383 | |||
| ITW / Illinois Tool Works Inc. | 0.01 | -0.04 | 2.01 | -0.35 | 1.4611 | -0.1259 | |||
| PG / The Procter & Gamble Company | 0.01 | -0.51 | 1.87 | -6.97 | 1.3564 | -0.2221 | |||
| JNJ / Johnson & Johnson | 0.01 | 0.00 | 1.80 | -7.88 | 1.3073 | -0.2290 | |||
| FERG / Ferguson Enterprises Inc. | 0.01 | 1.75 | 1.2700 | 1.2700 | |||||
| TD / The Toronto-Dominion Bank | 0.02 | -0.41 | 1.75 | 22.03 | 1.2671 | 0.1432 | |||
| CINF / Cincinnati Financial Corporation | 0.01 | -0.03 | 1.74 | 0.75 | 1.2604 | -0.0932 | |||
| BA / The Boeing Company | 0.01 | 0.04 | 1.70 | 22.88 | 1.2327 | 0.1470 | |||
| FITB / Fifth Third Bancorp | 0.04 | -0.04 | 1.66 | 4.92 | 1.2085 | -0.0387 | |||
| CME / CME Group Inc. | 0.01 | 0.76 | 1.65 | 4.69 | 1.1991 | -0.0408 | |||
| MO / Altria Group, Inc. | 0.03 | -1.65 | 1.61 | -3.94 | 1.1704 | -0.1482 | |||
| GPC / Genuine Parts Company | 0.01 | 0.58 | 1.58 | 2.47 | 1.1436 | -0.0651 | |||
| CCI / Crown Castle Inc. | 0.02 | -0.01 | 1.55 | -1.46 | 1.1285 | -0.1110 | |||
| UNH / UnitedHealth Group Incorporated | 0.00 | 9.76 | 1.54 | -34.62 | 1.1162 | -0.7319 | |||
| ADP / Automatic Data Processing, Inc. | 0.00 | -0.06 | 1.50 | 0.87 | 1.0923 | -0.0797 | |||
| EBGEF / Enbridge Inc. - Preferred Stock | 0.03 | 0.18 | 1.47 | 2.51 | 1.0673 | -0.0602 | |||
| FNF / Fidelity National Financial, Inc. | 0.03 | 0.52 | 1.45 | -13.39 | 1.0521 | -0.2631 | |||
| ORI / Old Republic International Corporation | 0.04 | 9.13 | 1.40 | 6.97 | 1.0144 | -0.0121 | |||
| USB / U.S. Bancorp | 0.03 | -0.21 | 1.39 | 6.92 | 1.0105 | -0.0122 | |||
| MMM / 3M Company | 0.01 | 0.00 | 1.39 | 3.67 | 1.0059 | -0.0444 | |||
| CNH / CNH Industrial N.V. | 0.11 | -0.89 | 1.37 | 4.59 | 0.9932 | -0.0346 | |||
| TFC / Truist Financial Corporation | 0.03 | -0.48 | 1.35 | 4.01 | 0.9789 | -0.0402 | |||
| GD / General Dynamics Corporation | 0.00 | -0.51 | 1.30 | 6.45 | 0.9466 | -0.0159 | |||
| FIX / Comfort Systems USA, Inc. | 0.00 | 1.30 | 0.9464 | 0.9464 | |||||
| RTX / RTX Corporation | 0.01 | 0.02 | 1.30 | 10.25 | 0.9457 | 0.0173 | |||
| O / Realty Income Corporation | 0.02 | 0.32 | 1.27 | -0.39 | 0.9209 | -0.0796 | |||
| AGM / Federal Agricultural Mortgage Corporation | 0.01 | 0.42 | 1.26 | 4.05 | 0.9152 | -0.0369 | |||
| CB / Chubb Limited | 0.00 | 0.00 | 1.25 | -4.06 | 0.9106 | -0.1168 | |||
| APD / Air Products and Chemicals, Inc. | 0.00 | -0.07 | 1.21 | -4.42 | 0.8802 | -0.1166 | |||
| LHX / L3Harris Technologies, Inc. | 0.00 | 0.00 | 1.13 | 19.81 | 0.8174 | 0.0791 | |||
| BTI / British American Tobacco p.l.c. - Depositary Receipt (Common Stock) | 0.02 | -0.04 | 1.10 | 14.33 | 0.7998 | 0.0428 | |||
| MPLX / MPLX LP - Limited Partnership | 0.02 | 20.38 | 1.09 | 15.85 | 0.7910 | 0.0520 | |||
| AMT / American Tower Corporation | 0.00 | 2.94 | 1.05 | 4.57 | 0.7640 | -0.0269 | |||
| AOS / A. O. Smith Corporation | 0.01 | -0.62 | 0.95 | -0.31 | 0.6907 | -0.0592 | |||
| CRH / CRH plc | 0.01 | 1.59 | 0.95 | 5.92 | 0.6890 | -0.0145 | |||
| UPS / United Parcel Service, Inc. | 0.01 | -0.80 | 0.87 | -8.98 | 0.6335 | -0.1197 | |||
| GWW / W.W. Grainger, Inc. | 0.00 | 0.00 | 0.85 | 5.19 | 0.6193 | -0.0173 | |||
| ADC / Agree Realty Corporation | 0.01 | -0.14 | 0.81 | -5.46 | 0.5913 | -0.0859 | |||
| ADM / Archer-Daniels-Midland Company | 0.01 | 10.27 | 0.79 | 21.30 | 0.5707 | 0.0611 | |||
| PPG / PPG Industries, Inc. | 0.01 | -0.14 | 0.72 | 3.88 | 0.5254 | -0.0221 | |||
| ADBE / Adobe Inc. | 0.00 | 186.71 | 0.70 | 189.67 | 0.5090 | 0.3185 | |||
| SWK / Stanley Black & Decker, Inc. | 0.01 | 0.21 | 0.66 | -11.71 | 0.4764 | -0.1075 | |||
| WPC / W. P. Carey Inc. | 0.01 | 9.37 | 0.65 | 8.15 | 0.4723 | -0.0006 | |||
| ICE / Intercontinental Exchange, Inc. | 0.00 | 0.00 | 0.61 | 6.43 | 0.4445 | -0.0079 | |||
| CPRT / Copart, Inc. | 0.01 | 0.83 | 0.60 | -12.50 | 0.4374 | -0.1041 | |||
| AFG / American Financial Group, Inc. | 0.00 | 25.01 | 0.57 | 20.13 | 0.4123 | 0.0408 | |||
| SPGI / S&P Global Inc. | 0.00 | 0.00 | 0.54 | 3.88 | 0.3894 | -0.0168 | |||
| MDT / Medtronic plc | 0.01 | 0.00 | 0.51 | -2.88 | 0.3668 | -0.0425 | |||
| KMI / Kinder Morgan, Inc. | 0.01 | 17.19 | 0.44 | 20.60 | 0.3192 | 0.0331 | |||
| INTC / Intel Corporation | 0.02 | 0.23 | 0.44 | -1.14 | 0.3160 | -0.0300 | |||
| CVX / Chevron Corporation | 0.00 | 0.37 | 0.2656 | 0.2656 | |||||
| WBA / Walgreens Boots Alliance, Inc. | 0.03 | 0.00 | 0.36 | 2.54 | 0.2643 | -0.0141 | |||
| C / Citigroup Inc. | 0.00 | -0.47 | 0.36 | 19.60 | 0.2617 | 0.0243 | |||
| PLD / Prologis, Inc. | 0.00 | 9.43 | 0.34 | 2.69 | 0.2497 | -0.0130 | |||
| PYPL / PayPal Holdings, Inc. | 0.00 | 0.00 | 0.34 | 13.67 | 0.2482 | 0.0123 | |||
| CASY / Casey's General Stores, Inc. | 0.00 | 0.00 | 0.34 | 17.48 | 0.2442 | 0.0194 | |||
| ALL / The Allstate Corporation | 0.00 | -4.70 | 0.33 | -7.39 | 0.2369 | -0.0399 | |||
| BNS / The Bank of Nova Scotia | 0.01 | 0.00 | 0.31 | 16.54 | 0.2254 | 0.0160 | |||
| CNI / Canadian National Railway Company | 0.00 | 0.00 | 0.31 | 6.64 | 0.2219 | -0.0031 | |||
| BAC / Bank of America Corporation | 0.01 | 0.99 | 0.24 | 14.22 | 0.1756 | 0.0096 | |||
| MTB / M&T Bank Corporation | 0.00 | 0.00 | 0.23 | 8.10 | 0.1655 | 0.0004 | |||
| MUSA / Murphy USA Inc. | 0.00 | 0.00 | 0.23 | -13.41 | 0.1645 | -0.0411 | |||
| LEG / Leggett & Platt, Incorporated | 0.02 | -2.83 | 0.22 | 9.45 | 0.1601 | 0.0020 | |||
| FLG / Flagstar Financial, Inc. | 0.00 | -100.00 | 0.00 | 0.0000 | |||||
| SYY / Sysco Corporation | 0.00 | -100.00 | 0.00 | 0.0000 | |||||
| YUMC / Yum China Holdings, Inc. | 0.00 | -100.00 | 0.00 | 0.0000 | |||||
| SYK / Stryker Corporation | 0.00 | -100.00 | 0.00 | 0.0000 | |||||
| BABA / Alibaba Group Holding Limited - Depositary Receipt (Common Stock) | 0.00 | -100.00 | 0.00 | 0.0000 |