Statistik Asas
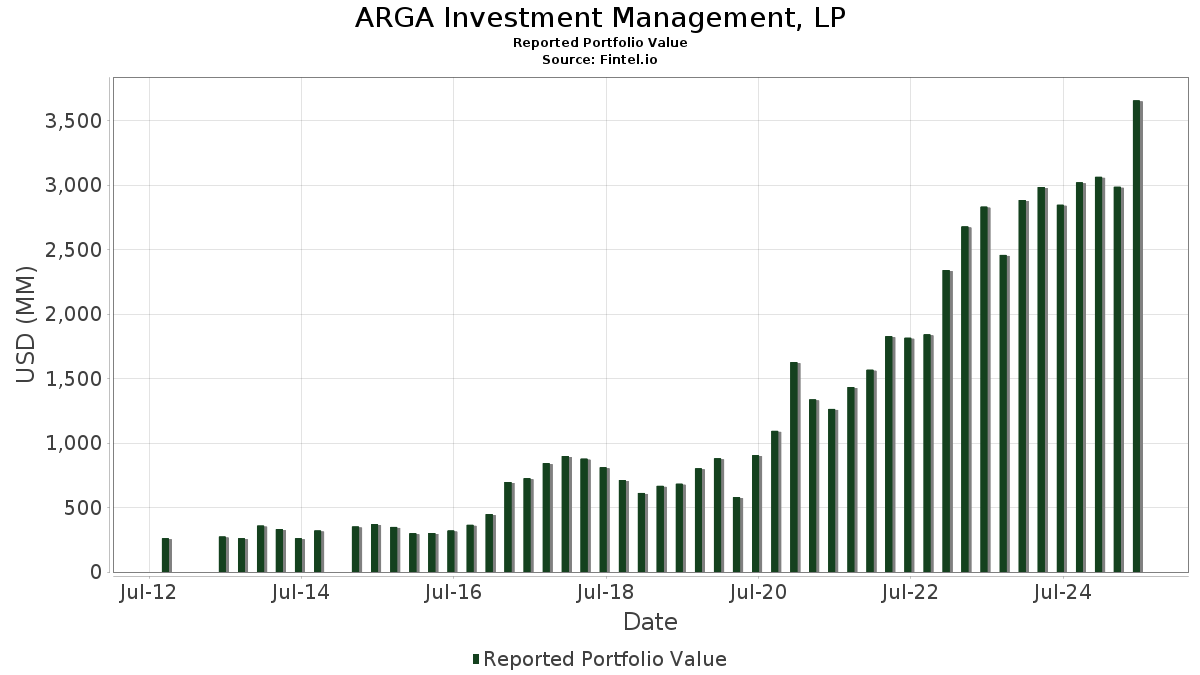
| Nilai Portfolio | $ 3,655,543,581 |
| Kedudukan Semasa | 123 |
Pegangan Terkini, Prestasi, AUM (dari 13F, 13D)
ARGA Investment Management, LP telah mendedahkan 123 jumlah pegangan dalam pemfailan SEC terkini mereka. Nilai portfolio terkini dikira sebagai $ 3,655,543,581 USD. Aset Sebenar Di Bawah Pengurusan (AUM) ialah nilai ini ditambah dengan tunai (yang tidak didedahkan). Pegangan teratas ARGA Investment Management, LP ialah Las Vegas Sands Corp. (US:LVS) , Banco Bradesco S.A. - Depositary Receipt (Common Stock) (US:BBD) , Nutrien Ltd. (US:NTR) , Trip.com Group Limited - Depositary Receipt (Common Stock) (US:TCOM) , and UBS Group AG (US:UBS) . Kedudukan baharu ARGA Investment Management, LP termasuk EPAM Systems, Inc. (US:EPAM) , Humana Inc. (US:HUM) , Royal Bank of Canada (MX:RY N) , Synchrony Financial (US:SYF) , and Globant S.A. (US:GLOB) .
Kenaikan Teratas Suku Tahun Ini
Kami menggunakan perubahan dalam peruntukan portfolio kerana ini adalah metrik yang paling bermakna. Perubahan boleh disebabkan oleh perdagangan atau perubahan dalam harga saham.
| Sekuriti | Saham (MM) |
Nilai (MM$) |
Portfolio % | ΔPortfolio % |
|---|---|---|---|---|
| 10.04 | 436.88 | 11.9512 | 2.4532 | |
| 0.48 | 84.46 | 2.3104 | 2.3104 | |
| 0.28 | 61.98 | 1.6955 | 1.4387 | |
| 126.82 | 391.86 | 10.7196 | 1.2566 | |
| 0.48 | 46.05 | 1.2596 | 1.2221 | |
| 0.50 | 42.84 | 1.1718 | 1.1439 | |
| 0.42 | 38.70 | 1.0586 | 0.9751 | |
| 0.57 | 72.84 | 1.9927 | 0.9721 | |
| 0.52 | 41.47 | 1.1345 | 0.7493 | |
| 29.81 | 215.55 | 5.8966 | 0.6447 |
Penurunan Teratas Suku Tahun Ini
Kami menggunakan perubahan dalam peruntukan portfolio kerana ini adalah metrik yang paling bermakna. Perubahan boleh disebabkan oleh perdagangan atau perubahan dalam harga saham.
| Sekuriti | Saham (MM) |
Nilai (MM$) |
Portfolio % | ΔPortfolio % |
|---|---|---|---|---|
| 0.29 | 19.89 | 0.5441 | -4.7220 | |
| 11.04 | 138.06 | 3.7768 | -1.5226 | |
| 13.24 | 78.50 | 2.1475 | -1.3715 | |
| 1.02 | 78.45 | 2.1460 | -1.3113 | |
| 0.80 | 24.18 | 0.6614 | -0.8607 | |
| 0.45 | 51.36 | 1.4049 | -0.6769 | |
| 7.29 | 246.68 | 6.7480 | -0.5967 | |
| 3.02 | 89.08 | 2.4370 | -0.5610 | |
| 0.62 | 24.92 | 0.6817 | -0.4561 | |
| 0.60 | 57.34 | 1.5687 | -0.3613 |
13F dan Pemfailan Dana
Borang ini telah difailkan pada 2025-07-31 untuk tempoh pelaporan 2025-06-30. Klik ikon pautan untuk melihat sejarah transaksi penuh.
Tingkatkan untuk membuka data premium dan eksport ke Excel ![]() .
.
| Sekuriti | Jenis | Purata Harga Saham | Saham (MM) |
ΔSaham (%) |
ΔSaham (%) |
Nilai ($MM) |
Portfolio (%) |
ΔPortfolio (%) |
|
|---|---|---|---|---|---|---|---|---|---|
| LVS / Las Vegas Sands Corp. | 10.04 | 36.75 | 436.88 | 54.03 | 11.9512 | 2.4532 | |||
| BBD / Banco Bradesco S.A. - Depositary Receipt (Common Stock) | 126.82 | 0.07 | 391.86 | 38.66 | 10.7196 | 1.2566 | |||
| NTR / Nutrien Ltd. | 6.59 | 1.25 | 384.06 | 18.86 | 10.5063 | -0.3140 | |||
| TCOM / Trip.com Group Limited - Depositary Receipt (Common Stock) | 6.04 | 41.20 | 354.43 | 30.23 | 9.6956 | 0.5822 | |||
| UBS / UBS Group AG | 7.29 | 0.95 | 246.68 | 12.46 | 6.7480 | -0.5967 | |||
| MLCO / Melco Resorts & Entertainment Limited - Depositary Receipt (Common Stock) | 29.81 | 0.18 | 215.55 | 37.43 | 5.8966 | 0.6447 | |||
| BAP / Credicorp Ltd. | 0.69 | -4.35 | 154.12 | 14.85 | 4.2160 | -0.2776 | |||
| TSM / Taiwan Semiconductor Manufacturing Company Limited - Depositary Receipt (Common Stock) | 0.67 | -1.08 | 151.34 | 34.96 | 4.1399 | 0.3851 | |||
| PBR / Petróleo Brasileiro S.A. - Petrobras - Depositary Receipt (Common Stock) | 11.04 | 0.00 | 138.06 | -12.76 | 3.7768 | -1.5226 | |||
| MGA / Magna International Inc. | 3.11 | 3.89 | 120.37 | 18.13 | 3.2927 | -0.1192 | |||
| AA / Alcoa Corporation | 3.02 | 2.84 | 89.08 | -0.50 | 2.4370 | -0.5610 | |||
| EPAM / EPAM Systems, Inc. | 0.48 | 84.46 | 2.3104 | 2.3104 | |||||
| PTEN / Patterson-UTI Energy, Inc. | 13.24 | 3.55 | 78.50 | -25.30 | 2.1475 | -1.3715 | |||
| HDB / HDFC Bank Limited - Depositary Receipt (Common Stock) | 1.02 | -34.16 | 78.45 | -24.02 | 2.1460 | -1.3113 | |||
| ARW / Arrow Electronics, Inc. | 0.57 | 94.73 | 72.84 | 138.99 | 1.9927 | 0.9721 | |||
| NXPI / NXP Semiconductors N.V. | 0.28 | 602.85 | 61.98 | 707.98 | 1.6955 | 1.4387 | |||
| LEA / Lear Corporation | 0.60 | -7.59 | 57.34 | -0.50 | 1.5687 | -0.3613 | |||
| ALK / Alaska Air Group, Inc. | 1.10 | 7.23 | 54.39 | 7.80 | 1.4878 | -0.2016 | |||
| BABA / Alibaba Group Holding Limited - Depositary Receipt (Common Stock) | 0.45 | -3.69 | 51.36 | -17.39 | 1.4049 | -0.6769 | |||
| TROW / T. Rowe Price Group, Inc. | 0.48 | 3,807.31 | 46.05 | 4,007.58 | 1.2596 | 1.2221 | |||
| C / Citigroup Inc. | 0.50 | 4,188.35 | 42.84 | 5,042.26 | 1.1718 | 1.1439 | |||
| MRK / Merck & Co., Inc. | 0.52 | 308.80 | 41.47 | 260.54 | 1.1345 | 0.7493 | |||
| LCII / LCI Industries | 0.42 | 1,386.79 | 38.70 | 1,451.02 | 1.0586 | 0.9751 | |||
| QCOM / QUALCOMM Incorporated | 0.17 | 3.93 | 27.63 | 7.75 | 0.7558 | -0.1028 | |||
| MAN / ManpowerGroup Inc. | 0.62 | 5.07 | 24.92 | -26.66 | 0.6817 | -0.4561 | |||
| BAX / Baxter International Inc. | 0.80 | -39.87 | 24.18 | -46.81 | 0.6614 | -0.8607 | |||
| CVS / CVS Health Corporation | 0.29 | -87.58 | 19.89 | -87.35 | 0.5441 | -4.7220 | |||
| BAC / Bank of America Corporation | 0.37 | 8.78 | 17.66 | 23.34 | 0.4832 | 0.0037 | |||
| LBTYB / Liberty Global Ltd. | 1.51 | 10.63 | 15.08 | -3.79 | 0.4126 | -0.1123 | |||
| HUM / Humana Inc. | 0.05 | 13.20 | 0.3611 | 0.3611 | |||||
| CTSH / Cognizant Technology Solutions Corporation | 0.13 | 13.42 | 10.10 | 15.69 | 0.2762 | -0.0160 | |||
| TGT / Target Corporation | 0.07 | 7.23 | 0.1977 | 0.1977 | |||||
| WCC / WESCO International, Inc. | 0.03 | 125.45 | 4.66 | 168.92 | 0.1274 | 0.0694 | |||
| RY N / Royal Bank of Canada | 0.03 | 4.17 | 0.1142 | 0.1142 | |||||
| CPRI / Capri Holdings Limited | 0.22 | -5.56 | 3.81 | -15.28 | 0.1042 | -0.0464 | |||
| MHK / Mohawk Industries, Inc. | 0.03 | 95.23 | 3.19 | 79.29 | 0.0872 | 0.0276 | |||
| WYNN / Wynn Resorts, Limited | 0.03 | -23.54 | 2.39 | -14.25 | 0.0654 | -0.0279 | |||
| UGI / UGI Corporation | 0.07 | -33.38 | 2.37 | -26.64 | 0.0649 | -0.0434 | |||
| COLB / Columbia Banking System, Inc. | 0.09 | 0.00 | 2.11 | -6.24 | 0.0576 | -0.0176 | |||
| FAF / First American Financial Corporation | 0.03 | 0.00 | 2.10 | -6.47 | 0.0574 | -0.0177 | |||
| JPM / JPMorgan Chase & Co. | 0.01 | 0.00 | 2.01 | 18.19 | 0.0551 | -0.0020 | |||
| TEL / TE Connectivity plc | 0.01 | -0.78 | 2.00 | 18.39 | 0.0546 | -0.0018 | |||
| KFY / Korn Ferry | 0.03 | 0.00 | 1.96 | 8.15 | 0.0537 | -0.0071 | |||
| BRK.B / Berkshire Hathaway Inc. | 0.00 | -18.86 | 1.93 | -25.99 | 0.0528 | -0.0345 | |||
| AWK / American Water Works Company, Inc. | 0.01 | 0.00 | 1.82 | -5.70 | 0.0498 | -0.0149 | |||
| MU / Micron Technology, Inc. | 0.01 | 71.07 | 1.76 | 142.76 | 0.0482 | 0.0239 | |||
| PBF / PBF Energy Inc. | 0.08 | 63.04 | 1.73 | 85.09 | 0.0472 | 0.0160 | |||
| CRC / California Resources Corporation | 0.04 | 0.00 | 1.71 | 3.88 | 0.0469 | -0.0084 | |||
| IPGP / IPG Photonics Corporation | 0.02 | 0.00 | 1.65 | 8.77 | 0.0451 | -0.0057 | |||
| IVZ / Invesco Ltd. | 0.10 | 4.96 | 1.64 | 9.12 | 0.0449 | -0.0055 | |||
| VSCO / Victoria's Secret & Co. | 0.09 | 0.00 | 1.62 | -0.31 | 0.0444 | -0.0101 | |||
| SYF / Synchrony Financial | 0.02 | 1.61 | 0.0442 | 0.0442 | |||||
| CZR / Caesars Entertainment, Inc. | 0.06 | 0.00 | 1.61 | 13.51 | 0.0439 | -0.0034 | |||
| PII / Polaris Inc. | 0.04 | 0.00 | 1.59 | -0.69 | 0.0436 | -0.0101 | |||
| GILD / Gilead Sciences, Inc. | 0.01 | -20.49 | 1.55 | -21.33 | 0.0425 | -0.0236 | |||
| AMAT / Applied Materials, Inc. | 0.01 | 92.30 | 1.52 | 142.90 | 0.0417 | 0.0206 | |||
| RNR / RenaissanceRe Holdings Ltd. | 0.01 | -75.36 | 1.44 | -75.07 | 0.0394 | -0.1542 | |||
| CSCO / Cisco Systems, Inc. | 0.02 | -1.28 | 1.44 | 11.03 | 0.0394 | -0.0041 | |||
| CMCSA / Comcast Corporation | 0.04 | 1.40 | 0.0384 | 0.0384 | |||||
| EOG / EOG Resources, Inc. | 0.01 | -14.01 | 1.38 | -19.79 | 0.0378 | -0.0199 | |||
| DOW / Dow Inc. | 0.05 | 33.31 | 1.34 | 1.06 | 0.0366 | -0.0077 | |||
| DG / Dollar General Corporation | 0.01 | -67.94 | 1.33 | -58.31 | 0.0363 | -0.0702 | |||
| GLOB / Globant S.A. | 0.01 | 1.32 | 0.0361 | 0.0361 | |||||
| ACLS / Axcelis Technologies, Inc. | 0.02 | 1.29 | 0.0353 | 0.0353 | |||||
| COP / ConocoPhillips | 0.01 | -16.59 | 1.28 | -28.70 | 0.0351 | -0.0252 | |||
| THO / THOR Industries, Inc. | 0.01 | 0.00 | 1.28 | 17.11 | 0.0350 | -0.0016 | |||
| KELYA / Kelly Services, Inc. | 0.11 | 0.00 | 1.25 | -11.13 | 0.0341 | -0.0128 | |||
| JHG / Janus Henderson Group plc | 0.03 | -0.15 | 1.25 | 7.33 | 0.0341 | -0.0048 | |||
| ONTO / Onto Innovation Inc. | 0.01 | 1.24 | 0.0339 | 0.0339 | |||||
| REZI / Resideo Technologies, Inc. | 0.06 | -52.90 | 1.23 | -41.32 | 0.0338 | -0.0367 | |||
| RTX / RTX Corporation | 0.01 | -32.84 | 1.23 | -25.98 | 0.0336 | -0.0220 | |||
| OLN / Olin Corporation | 0.06 | 0.00 | 1.20 | -17.12 | 0.0329 | -0.0157 | |||
| JBL / Jabil Inc. | 0.01 | -42.75 | 1.19 | -8.21 | 0.0324 | -0.0108 | |||
| AER / AerCap Holdings N.V. | 0.01 | -29.76 | 1.17 | -19.56 | 0.0321 | -0.0167 | |||
| RHI / Robert Half Inc. | 0.03 | 19.77 | 1.17 | -9.88 | 0.0320 | -0.0114 | |||
| CHRD / Chord Energy Corporation | 0.01 | -1.81 | 1.15 | -15.67 | 0.0315 | -0.0142 | |||
| ABT / Abbott Laboratories | 0.01 | 0.00 | 1.15 | 2.58 | 0.0315 | -0.0061 | |||
| BEN / Franklin Resources, Inc. | 0.05 | 0.00 | 1.11 | 23.86 | 0.0304 | 0.0004 | |||
| NWL / Newell Brands Inc. | 0.20 | -1.10 | 1.08 | -13.84 | 0.0295 | -0.0124 | |||
| JAZZ / Jazz Pharmaceuticals plc | 0.01 | 0.00 | 1.06 | -14.47 | 0.0291 | -0.0126 | |||
| AL / Air Lease Corporation | 0.02 | 0.00 | 1.04 | 21.02 | 0.0285 | -0.0003 | |||
| ICHR / Ichor Holdings, Ltd. | 0.05 | 0.00 | 0.96 | -13.16 | 0.0262 | -0.0107 | |||
| KLIC / Kulicke and Soffa Industries, Inc. | 0.03 | 0.91 | 0.0250 | 0.0250 | |||||
| DOX / Amdocs Limited | 0.01 | -41.58 | 0.91 | -41.78 | 0.0248 | -0.0274 | |||
| ETR / Entergy Corporation | 0.01 | -30.76 | 0.90 | -32.73 | 0.0246 | -0.0201 | |||
| CI / The Cigna Group | 0.00 | 0.00 | 0.89 | 0.56 | 0.0244 | -0.0053 | |||
| CC / The Chemours Company | 0.08 | -48.31 | 0.88 | -56.27 | 0.0241 | -0.0433 | |||
| SHG / Shinhan Financial Group Co., Ltd. - Depositary Receipt (Common Stock) | 0.02 | 0.00 | 0.73 | 40.85 | 0.0200 | 0.0026 | |||
| TPR / Tapestry, Inc. | 0.01 | -35.00 | 0.71 | -18.94 | 0.0193 | -0.0099 | |||
| NAVI / Navient Corporation | 0.05 | 0.00 | 0.69 | 11.65 | 0.0189 | -0.0018 | |||
| LYB / LyondellBasell Industries N.V. | 0.01 | 26.92 | 0.68 | 4.27 | 0.0187 | -0.0032 | |||
| GGB / Gerdau S.A. - Depositary Receipt (Common Stock) | 0.23 | 0.46 | 0.66 | 3.28 | 0.0181 | -0.0033 | |||
| ATKR / Atkore Inc. | 0.01 | 0.61 | 0.0167 | 0.0167 | |||||
| AGO / Assured Guaranty Ltd. | 0.01 | 0.00 | 0.60 | -1.16 | 0.0163 | -0.0039 | |||
| SLM / SLM Corporation | 0.02 | 0.00 | 0.59 | 11.65 | 0.0162 | -0.0016 | |||
| BIIB / Biogen Inc. | 0.00 | 0.00 | 0.52 | -8.14 | 0.0142 | -0.0047 | |||
| REYN / Reynolds Consumer Products Inc. | 0.02 | 0.00 | 0.52 | -10.26 | 0.0141 | -0.0051 | |||
| WD / Walker & Dunlop, Inc. | 0.01 | 0.00 | 0.51 | -17.56 | 0.0139 | -0.0067 | |||
| KAR / OPENLANE, Inc. | 0.02 | 0.00 | 0.49 | 26.94 | 0.0134 | 0.0005 | |||
| ABCB / Ameris Bancorp | 0.01 | 0.00 | 0.49 | 12.47 | 0.0133 | -0.0012 | |||
| PLOW / Douglas Dynamics, Inc. | 0.02 | 0.00 | 0.48 | 26.84 | 0.0132 | 0.0005 | |||
| GSL / Global Ship Lease, Inc. | 0.02 | -6.36 | 0.48 | 7.83 | 0.0132 | -0.0018 | |||
| CRI / Carter's, Inc. | 0.02 | 0.00 | 0.47 | -26.46 | 0.0128 | -0.0085 | |||
| AVT / Avnet, Inc. | 0.01 | 0.00 | 0.46 | 10.21 | 0.0127 | -0.0014 | |||
| INMD / InMode Ltd. | 0.03 | 0.46 | 0.0125 | 0.0125 | |||||
| ASB / Associated Banc-Corp | 0.02 | 0.00 | 0.42 | 8.18 | 0.0116 | -0.0015 | |||
| VSH / Vishay Intertechnology, Inc. | 0.03 | 0.00 | 0.41 | -0.25 | 0.0111 | -0.0025 | |||
| APAM / Artisan Partners Asset Management Inc. | 0.01 | 0.00 | 0.39 | 13.26 | 0.0108 | -0.0009 | |||
| AMWD / American Woodmark Corporation | 0.01 | 0.00 | 0.39 | -9.26 | 0.0107 | -0.0037 | |||
| TRS / TriMas Corporation | 0.01 | 0.00 | 0.39 | 22.12 | 0.0107 | -0.0000 | |||
| HLX / Helix Energy Solutions Group, Inc. | 0.06 | 0.00 | 0.38 | -24.85 | 0.0103 | -0.0065 | |||
| CNXC / Concentrix Corporation | 0.01 | 0.00 | 0.36 | -5.03 | 0.0098 | -0.0028 | |||
| SKM / SK Telecom Co., Ltd. - Depositary Receipt (Common Stock) | 0.01 | 0.00 | 0.33 | 9.80 | 0.0089 | -0.0010 | |||
| STC / Stewart Information Services Corporation | 0.00 | 0.00 | 0.33 | -8.71 | 0.0089 | -0.0030 | |||
| VET / Vermilion Energy Inc. | 0.04 | 0.00 | 0.32 | -9.83 | 0.0088 | -0.0032 | |||
| SIG / Signet Jewelers Limited | 0.00 | 0.00 | 0.29 | 37.14 | 0.0079 | 0.0008 | |||
| KMT / Kennametal Inc. | 0.01 | 0.00 | 0.28 | 7.66 | 0.0077 | -0.0010 | |||
| HCC / Warrior Met Coal, Inc. | 0.01 | 0.00 | 0.28 | -3.85 | 0.0075 | -0.0021 | |||
| LZB / La-Z-Boy Incorporated | 0.01 | 0.00 | 0.25 | -4.87 | 0.0070 | -0.0020 | |||
| PVH / PVH Corp. | 0.00 | 0.00 | 0.25 | 6.44 | 0.0068 | -0.0010 | |||
| HMN / Horace Mann Educators Corporation | 0.01 | 0.00 | 0.25 | 0.41 | 0.0068 | -0.0015 | |||
| ON / ON Semiconductor Corporation | 0.00 | 0.23 | 0.0063 | 0.0063 | |||||
| SCS / Steelcase Inc. | 0.02 | 0.00 | 0.16 | -5.20 | 0.0045 | -0.0013 | |||
| ALIT / Alight, Inc. | 0.00 | -100.00 | 0.00 | 0.0000 | |||||
| BIDU / Baidu, Inc. - Depositary Receipt (Common Stock) | 0.00 | -100.00 | 0.00 | 0.0000 | |||||
| DLTR / Dollar Tree, Inc. | 0.00 | -100.00 | 0.00 | 0.0000 | |||||
| FMC / FMC Corporation | 0.00 | -100.00 | 0.00 | 0.0000 | |||||
| BG / Bunge Global SA | 0.00 | -100.00 | 0.00 | 0.0000 | |||||
| SNRE / Sunrise Communications AG - Depositary Receipt (Common Stock) | 0.00 | -100.00 | 0.00 | 0.0000 | |||||
| JNPR / Juniper Networks, Inc. | 0.00 | -100.00 | 0.00 | 0.0000 | |||||
| IFF / International Flavors & Fragrances Inc. | 0.00 | -100.00 | 0.00 | 0.0000 | |||||
| SW / Smurfit Westrock Plc | 0.00 | -100.00 | 0.00 | 0.0000 | |||||
| JD / JD.com, Inc. - Depositary Receipt (Common Stock) | 0.00 | -100.00 | 0.00 | 0.0000 | |||||
| BERY / Berry Global Group, Inc. | 0.00 | -100.00 | 0.00 | 0.0000 |