Statistik Asas
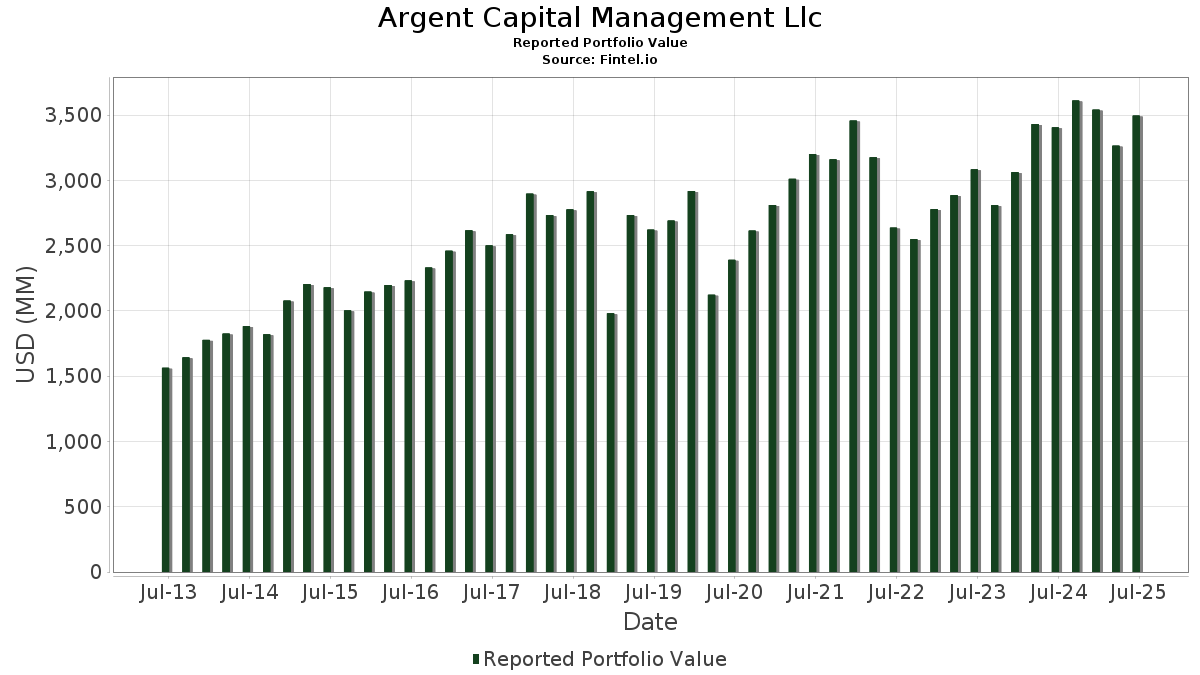
| Nilai Portfolio | $ 3,496,256,589 |
| Kedudukan Semasa | 154 |
Pegangan Terkini, Prestasi, AUM (dari 13F, 13D)
Argent Capital Management Llc telah mendedahkan 154 jumlah pegangan dalam pemfailan SEC terkini mereka. Nilai portfolio terkini dikira sebagai $ 3,496,256,589 USD. Aset Sebenar Di Bawah Pengurusan (AUM) ialah nilai ini ditambah dengan tunai (yang tidak didedahkan). Pegangan teratas Argent Capital Management Llc ialah Microsoft Corporation (US:MSFT) , Amazon.com, Inc. (US:AMZN) , NVIDIA Corporation (US:NVDA) , Mastercard Incorporated (US:MA) , and Alphabet Inc. (US:GOOGL) . Kedudukan baharu Argent Capital Management Llc termasuk Intuit Inc. (US:INTU) , MSA Safety Incorporated (US:MSA) , Badger Meter, Inc. (US:BMI) , UL Solutions Inc. (US:ULS) , and Casella Waste Systems, Inc. (US:CWST) .
Kenaikan Teratas Suku Tahun Ini
Kami menggunakan perubahan dalam peruntukan portfolio kerana ini adalah metrik yang paling bermakna. Perubahan boleh disebabkan oleh perdagangan atau perubahan dalam harga saham.
| Sekuriti | Saham (MM) |
Nilai (MM$) |
Portfolio % | ΔPortfolio % |
|---|---|---|---|---|
| 0.49 | 244.04 | 6.9801 | 1.3231 | |
| 0.11 | 80.25 | 2.2952 | 1.1074 | |
| 0.38 | 104.62 | 2.9922 | 1.0532 | |
| 0.87 | 137.66 | 3.9372 | 1.0341 | |
| 0.04 | 33.82 | 0.9673 | 0.9673 | |
| 0.06 | 66.30 | 1.8962 | 0.6048 | |
| 0.07 | 102.70 | 2.9374 | 0.5048 | |
| 0.10 | 17.18 | 0.4914 | 0.4914 | |
| 0.10 | 60.96 | 1.7436 | 0.4114 | |
| 0.11 | 21.47 | 0.6142 | 0.4047 |
Penurunan Teratas Suku Tahun Ini
Kami menggunakan perubahan dalam peruntukan portfolio kerana ini adalah metrik yang paling bermakna. Perubahan boleh disebabkan oleh perdagangan atau perubahan dalam harga saham.
| Sekuriti | Saham (MM) |
Nilai (MM$) |
Portfolio % | ΔPortfolio % |
|---|---|---|---|---|
| 0.00 | 0.25 | 0.0071 | -3.3038 | |
| 0.41 | 84.25 | 2.4097 | -2.0056 | |
| 0.00 | 6.85 | 0.1960 | -1.2456 | |
| 0.00 | 0.35 | 0.0100 | -0.6811 | |
| 0.00 | 0.00 | -0.5289 | ||
| 1.43 | 69.94 | 2.0004 | -0.4885 | |
| 0.34 | 91.35 | 2.6127 | -0.3792 | |
| 0.66 | 71.60 | 2.0478 | -0.3704 | |
| 0.09 | 35.56 | 1.0172 | -0.3007 | |
| 0.00 | 0.00 | -0.2553 |
13F dan Pemfailan Dana
Borang ini telah difailkan pada 2025-07-14 untuk tempoh pelaporan 2025-06-30. Klik ikon pautan untuk melihat sejarah transaksi penuh.
Tingkatkan untuk membuka data premium dan eksport ke Excel ![]() .
.
| Sekuriti | Jenis | Purata Harga Saham | Saham (MM) |
ΔSaham (%) |
ΔSaham (%) |
Nilai ($MM) |
Portfolio (%) |
ΔPortfolio (%) |
|
|---|---|---|---|---|---|---|---|---|---|
| MSFT / Microsoft Corporation | 0.49 | -0.31 | 244.04 | 32.09 | 6.9801 | 1.3231 | |||
| AMZN / Amazon.com, Inc. | 0.98 | -0.84 | 214.99 | 14.34 | 6.1492 | 0.3916 | |||
| NVDA / NVIDIA Corporation | 0.87 | -0.40 | 137.66 | 45.19 | 3.9372 | 1.0341 | |||
| MA / Mastercard Incorporated | 0.22 | -0.79 | 125.95 | 1.72 | 3.6024 | -0.1891 | |||
| GOOGL / Alphabet Inc. | 0.71 | -0.87 | 124.39 | 12.97 | 3.5577 | 0.1863 | |||
| AVGO / Broadcom Inc. | 0.38 | 0.35 | 104.62 | 65.20 | 2.9922 | 1.0532 | |||
| TDG / TransDigm Group Incorporated | 0.07 | 17.59 | 102.70 | 29.27 | 2.9374 | 0.5048 | |||
| PGR / The Progressive Corporation | 0.34 | -0.86 | 91.35 | -6.51 | 2.6127 | -0.3792 | |||
| AMAT / Applied Materials, Inc. | 0.50 | -0.46 | 91.03 | 25.57 | 2.6037 | 0.3838 | |||
| V / Visa Inc. | 0.26 | -1.05 | 90.99 | 0.24 | 2.6024 | -0.1768 | |||
| URI / United Rentals, Inc. | 0.12 | 1.98 | 90.50 | 22.60 | 2.5885 | 0.3282 | |||
| HCA / HCA Healthcare, Inc. | 0.23 | 1.25 | 88.27 | 12.25 | 2.5248 | 0.1169 | |||
| AAPL / Apple Inc. | 0.41 | -36.74 | 84.25 | -41.57 | 2.4097 | -2.0056 | |||
| BX / Blackstone Inc. | 0.55 | 0.58 | 82.63 | 7.63 | 2.3633 | 0.0127 | |||
| BAH / Booz Allen Hamilton Holding Corporation | 0.77 | 0.93 | 80.51 | 0.49 | 2.3027 | -0.1504 | |||
| META / Meta Platforms, Inc. | 0.11 | 61.54 | 80.25 | 106.87 | 2.2952 | 1.1074 | |||
| DHR / Danaher Corporation | 0.37 | -0.49 | 72.54 | -4.11 | 2.0749 | -0.2415 | |||
| XOM / Exxon Mobil Corporation | 0.66 | 0.02 | 71.60 | -9.34 | 2.0478 | -0.3704 | |||
| DHI / D.R. Horton, Inc. | 0.55 | 0.38 | 70.35 | 1.79 | 2.0120 | -0.1041 | |||
| CPRT / Copart, Inc. | 1.43 | -0.77 | 69.94 | -13.96 | 2.0004 | -0.4885 | |||
| JPM / JPMorgan Chase & Co. | 0.23 | 2.88 | 67.93 | 21.59 | 1.9430 | 0.2322 | |||
| NOW / ServiceNow, Inc. | 0.06 | 21.73 | 66.30 | 57.19 | 1.8962 | 0.6048 | |||
| WCN / Waste Connections, Inc. | 0.35 | -1.07 | 65.90 | -5.37 | 1.8849 | -0.2474 | |||
| FTNT / Fortinet, Inc. | 0.61 | -0.20 | 64.83 | 9.60 | 1.8542 | 0.0431 | |||
| TYL / Tyler Technologies, Inc. | 0.10 | 37.41 | 60.96 | 40.12 | 1.7436 | 0.4114 | |||
| ORLY / O'Reilly Automotive, Inc. | 0.61 | 1,379.22 | 54.72 | -6.94 | 1.5651 | -0.2353 | |||
| OMF / OneMain Holdings, Inc. | 0.82 | 2.72 | 47.00 | 19.78 | 1.3443 | 0.1428 | |||
| APO / Apollo Global Management, Inc. | 0.32 | 41.41 | 45.62 | 46.50 | 1.3048 | 0.3513 | |||
| ETN / Eaton Corporation plc | 0.13 | 4.29 | 45.14 | 36.96 | 1.2912 | 0.2819 | |||
| HLI / Houlihan Lokey, Inc. | 0.24 | 2.55 | 43.47 | 14.27 | 1.2434 | 0.0785 | |||
| NEE / NextEra Energy, Inc. | 0.59 | 0.14 | 40.91 | -1.94 | 1.1702 | -0.1073 | |||
| MUSA / Murphy USA Inc. | 0.09 | -4.57 | 35.56 | -17.37 | 1.0172 | -0.3007 | |||
| ORCL / Oracle Corporation | 0.16 | 2.69 | 34.41 | 60.58 | 0.9842 | 0.3281 | |||
| INTU / Intuit Inc. | 0.04 | 33.82 | 0.9673 | 0.9673 | |||||
| FERG / Ferguson Enterprises Inc. | 0.16 | 1.27 | 33.77 | 37.62 | 0.9660 | 0.2145 | |||
| CG / The Carlyle Group Inc. | 0.63 | -9.00 | 32.17 | 7.31 | 0.9200 | 0.0022 | |||
| ADP / Automatic Data Processing, Inc. | 0.10 | 2.72 | 30.15 | 3.68 | 0.8623 | -0.0280 | |||
| RLI / RLI Corp. | 0.39 | 52.70 | 27.83 | 37.28 | 0.7959 | 0.1752 | |||
| RSG / Republic Services, Inc. | 0.11 | 2.90 | 27.11 | 4.79 | 0.7755 | -0.0168 | |||
| MEDP / Medpace Holdings, Inc. | 0.08 | -7.09 | 25.19 | -4.29 | 0.7204 | -0.0854 | |||
| HD / The Home Depot, Inc. | 0.07 | 2.33 | 24.15 | 2.37 | 0.6909 | -0.0316 | |||
| AMGN / Amgen Inc. | 0.09 | 2.98 | 24.12 | -7.71 | 0.6898 | -0.1103 | |||
| ACN / Accenture plc | 0.08 | 2.68 | 24.02 | -1.65 | 0.6870 | -0.0608 | |||
| CVX / Chevron Corporation | 0.17 | 3.29 | 23.72 | -11.59 | 0.6784 | -0.1431 | |||
| TSCO / Tractor Supply Company | 0.45 | 2.87 | 23.67 | -1.48 | 0.6771 | -0.0587 | |||
| ALGN / Align Technology, Inc. | 0.11 | 163.31 | 21.47 | 213.84 | 0.6142 | 0.4047 | |||
| PATK / Patrick Industries, Inc. | 0.22 | 2.46 | 20.67 | 11.80 | 0.5912 | 0.0251 | |||
| TRI / Thomson Reuters Corporation | 0.10 | 3.09 | 19.94 | 20.01 | 0.5704 | 0.0616 | |||
| GRMN / Garmin Ltd. | 0.09 | 2.45 | 19.53 | -1.52 | 0.5586 | -0.0487 | |||
| TXN / Texas Instruments Incorporated | 0.09 | 2.67 | 19.18 | 18.62 | 0.5487 | 0.0535 | |||
| EXR / Extra Space Storage Inc. | 0.13 | 2.82 | 18.46 | 2.10 | 0.5280 | -0.0257 | |||
| PEP / PepsiCo, Inc. | 0.14 | 2.27 | 18.10 | -9.95 | 0.5177 | -0.0977 | |||
| MSA / MSA Safety Incorporated | 0.10 | 17.18 | 0.4914 | 0.4914 | |||||
| TMO / Thermo Fisher Scientific Inc. | 0.04 | 2.71 | 14.71 | -16.31 | 0.4208 | -0.1175 | |||
| TFII / TFI International Inc. | 0.14 | 303.42 | 12.81 | 367.18 | 0.3664 | 0.2824 | |||
| EMR / Emerson Electric Co. | 0.07 | 1,087.03 | 9.56 | 1,343.66 | 0.2734 | 0.2531 | |||
| VCTR / Victory Capital Holdings, Inc. | 0.12 | 1.17 | 7.72 | 11.31 | 0.2209 | 0.0084 | |||
| LPLA / LPL Financial Holdings Inc. | 0.02 | -0.09 | 7.21 | 14.52 | 0.2062 | 0.0134 | |||
| FICO / Fair Isaac Corporation | 0.00 | -85.32 | 6.85 | -85.44 | 0.1960 | -1.2456 | |||
| CBZ / CBIZ, Inc. | 0.09 | 0.78 | 6.43 | -4.74 | 0.1839 | -0.0228 | |||
| DSGX / The Descartes Systems Group Inc. | 0.06 | 1.34 | 5.99 | 2.17 | 0.1713 | -0.0082 | |||
| CIGI / Colliers International Group Inc. | 0.05 | 8.96 | 5.90 | 17.27 | 0.1688 | 0.0147 | |||
| FSV / FirstService Corporation | 0.03 | 1.24 | 5.90 | 6.54 | 0.1688 | -0.0008 | |||
| ADUS / Addus HomeCare Corporation | 0.05 | 1.54 | 5.30 | 18.28 | 0.1516 | 0.0144 | |||
| FIX / Comfort Systems USA, Inc. | 0.01 | 162.53 | 5.21 | 336.80 | 0.1491 | 0.1125 | |||
| HLNE / Hamilton Lane Incorporated | 0.04 | 207.05 | 5.19 | 193.60 | 0.1484 | 0.0943 | |||
| CTAS / Cintas Corporation | 0.02 | -0.46 | 5.09 | 7.95 | 0.1457 | 0.0012 | |||
| IT / Gartner, Inc. | 0.01 | 0.06 | 4.40 | -3.64 | 0.1258 | -0.0140 | |||
| GDDY / GoDaddy Inc. | 0.02 | -0.21 | 4.26 | -0.23 | 0.1218 | -0.0089 | |||
| SGI / Somnigroup International Inc. | 0.06 | -18.14 | 4.19 | -6.97 | 0.1199 | -0.0181 | |||
| AME / AMETEK, Inc. | 0.02 | -0.47 | 4.08 | 4.64 | 0.1167 | -0.0027 | |||
| ICFI / ICF International, Inc. | 0.05 | 26.45 | 4.06 | 26.08 | 0.1162 | 0.0175 | |||
| A / Agilent Technologies, Inc. | 0.03 | 0.25 | 3.89 | 1.15 | 0.1112 | -0.0065 | |||
| SCI / Service Corporation International | 0.05 | -0.19 | 3.85 | 1.29 | 0.1101 | -0.0063 | |||
| LNG / Cheniere Energy, Inc. | 0.02 | -0.03 | 3.77 | 5.22 | 0.1079 | -0.0019 | |||
| BLD / TopBuild Corp. | 0.01 | -9.33 | 3.76 | -3.76 | 0.1077 | -0.0121 | |||
| MANH / Manhattan Associates, Inc. | 0.02 | 91.32 | 3.68 | 118.41 | 0.1052 | 0.0536 | |||
| BLDR / Builders FirstSource, Inc. | 0.03 | -14.70 | 3.52 | -20.33 | 0.1008 | -0.0346 | |||
| WMT / Walmart Inc. | 0.03 | 0.00 | 3.10 | 11.38 | 0.0888 | 0.0034 | |||
| AX / Axos Financial, Inc. | 0.04 | 0.95 | 2.99 | 18.96 | 0.0854 | 0.0086 | |||
| GOOG / Alphabet Inc. | 0.02 | 0.00 | 2.89 | 13.53 | 0.0826 | 0.0047 | |||
| BMI / Badger Meter, Inc. | 0.01 | 2.79 | 0.0797 | 0.0797 | |||||
| COST / Costco Wholesale Corporation | 0.00 | 0.00 | 2.68 | 4.65 | 0.0766 | -0.0017 | |||
| ULS / UL Solutions Inc. | 0.04 | 2.61 | 0.0747 | 0.0747 | |||||
| ENTG / Entegris, Inc. | 0.03 | 0.01 | 2.53 | -7.77 | 0.0723 | -0.0117 | |||
| TT / Trane Technologies plc | 0.01 | 0.00 | 2.40 | 29.84 | 0.0687 | 0.0121 | |||
| TTEK / Tetra Tech, Inc. | 0.06 | 216.08 | 2.25 | 288.93 | 0.0643 | 0.0466 | |||
| CHDN / Churchill Downs Incorporated | 0.02 | 169.40 | 2.15 | 144.99 | 0.0615 | 0.0346 | |||
| FSS / Federal Signal Corporation | 0.02 | 0.38 | 2.01 | 45.21 | 0.0576 | 0.0151 | |||
| KNSL / Kinsale Capital Group, Inc. | 0.00 | 133.17 | 1.82 | 131.72 | 0.0521 | 0.0280 | |||
| RBC / RBC Bearings Incorporated | 0.00 | 4.61 | 1.78 | 25.14 | 0.0510 | 0.0074 | |||
| GRBK / Green Brick Partners, Inc. | 0.03 | 4.47 | 1.70 | 12.64 | 0.0487 | 0.0024 | |||
| PLUS / ePlus inc. | 0.02 | 5.58 | 1.48 | 24.75 | 0.0424 | 0.0060 | |||
| PG / The Procter & Gamble Company | 0.01 | 0.00 | 1.35 | -6.50 | 0.0387 | -0.0056 | |||
| BRBR / BellRing Brands, Inc. | 0.02 | -8.84 | 1.27 | -29.09 | 0.0363 | -0.0185 | |||
| UFPI / UFP Industries, Inc. | 0.01 | 4.96 | 1.26 | -2.56 | 0.0359 | -0.0036 | |||
| MGY / Magnolia Oil & Gas Corporation | 0.05 | 5.11 | 1.23 | -6.46 | 0.0352 | -0.0051 | |||
| ICE / Intercontinental Exchange, Inc. | 0.01 | 0.00 | 1.19 | 6.33 | 0.0341 | -0.0002 | |||
| EW / Edwards Lifesciences Corporation | 0.01 | 0.00 | 1.10 | 7.94 | 0.0315 | 0.0002 | |||
| HON / Honeywell International Inc. | 0.00 | 0.00 | 1.09 | 9.98 | 0.0312 | 0.0008 | |||
| SKY / Champion Homes, Inc. | 0.02 | 4.23 | 1.08 | -31.13 | 0.0308 | -0.0171 | |||
| NPO / Enpro Inc. | 0.01 | 5.59 | 1.07 | 25.03 | 0.0307 | 0.0044 | |||
| ABG / Asbury Automotive Group, Inc. | 0.00 | -71.82 | 1.04 | -69.56 | 0.0296 | -0.0745 | |||
| MRVL / Marvell Technology, Inc. | 0.01 | -28.49 | 1.02 | -10.17 | 0.0291 | -0.0056 | |||
| BCPC / Balchem Corporation | 0.01 | 5.80 | 0.95 | 1.50 | 0.0271 | -0.0015 | |||
| ALG / Alamo Group Inc. | 0.00 | 5.59 | 0.94 | 29.30 | 0.0269 | 0.0046 | |||
| HRI / Herc Holdings Inc. | 0.01 | 5.41 | 0.93 | 3.46 | 0.0265 | -0.0009 | |||
| FDS / FactSet Research Systems Inc. | 0.00 | 0.00 | 0.87 | -1.58 | 0.0250 | -0.0022 | |||
| SEM / Select Medical Holdings Corporation | 0.06 | 4.59 | 0.86 | -4.98 | 0.0246 | -0.0031 | |||
| BRK.B / Berkshire Hathaway Inc. | 0.00 | -0.72 | 0.81 | -9.45 | 0.0230 | -0.0042 | |||
| CPK / Chesapeake Utilities Corporation | 0.01 | 5.49 | 0.80 | -1.24 | 0.0228 | -0.0019 | |||
| GBCI / Glacier Bancorp, Inc. | 0.02 | 5.45 | 0.76 | 2.83 | 0.0218 | -0.0009 | |||
| PANW / Palo Alto Networks, Inc. | 0.00 | 0.00 | 0.74 | 19.90 | 0.0212 | 0.0023 | |||
| KO / The Coca-Cola Company | 0.01 | 0.00 | 0.73 | -1.22 | 0.0209 | -0.0017 | |||
| BRK.A / Berkshire Hathaway Inc. | 0.00 | 0.00 | 0.73 | -8.77 | 0.0208 | -0.0036 | |||
| IVV / iShares Trust - iShares Core S&P 500 ETF | 0.00 | 0.00 | 0.70 | 10.46 | 0.0200 | 0.0006 | |||
| CON / Concentra Group Holdings Parent, Inc. | 0.03 | 4.33 | 0.69 | -1.00 | 0.0198 | -0.0016 | |||
| NOVT / Novanta Inc. | 0.01 | 4.91 | 0.68 | 5.91 | 0.0195 | -0.0002 | |||
| QLYS / Qualys, Inc. | 0.00 | 4.71 | 0.66 | 18.78 | 0.0190 | 0.0019 | |||
| HALO / Halozyme Therapeutics, Inc. | 0.01 | 5.03 | 0.66 | -14.38 | 0.0189 | -0.0047 | |||
| MSGS / Madison Square Garden Sports Corp. | 0.00 | 5.81 | 0.65 | 13.53 | 0.0185 | 0.0011 | |||
| CWST / Casella Waste Systems, Inc. | 0.01 | 0.64 | 0.0183 | 0.0183 | |||||
| IIIV / i3 Verticals, Inc. | 0.02 | 5.46 | 0.63 | 17.45 | 0.0179 | 0.0016 | |||
| CSW / CSW Industrials, Inc. | 0.00 | 5.62 | 0.63 | 3.99 | 0.0179 | -0.0005 | |||
| CRMT / America's Car-Mart, Inc. | 0.01 | 5.52 | 0.61 | 30.36 | 0.0176 | 0.0031 | |||
| BK / The Bank of New York Mellon Corporation | 0.01 | 0.00 | 0.61 | 8.73 | 0.0175 | 0.0003 | |||
| ONTO / Onto Innovation Inc. | 0.01 | 5.48 | 0.58 | -12.18 | 0.0167 | -0.0037 | |||
| DIS / The Walt Disney Company | 0.00 | 0.00 | 0.49 | 25.71 | 0.0140 | 0.0021 | |||
| CARR / Carrier Global Corporation | 0.01 | 0.00 | 0.49 | 15.40 | 0.0139 | 0.0010 | |||
| UFPT / UFP Technologies, Inc. | 0.00 | 12.07 | 0.47 | 35.94 | 0.0134 | 0.0028 | |||
| HWKN / Hawkins, Inc. | 0.00 | 0.44 | 0.0125 | 0.0125 | |||||
| ALRM / Alarm.com Holdings, Inc. | 0.01 | 5.52 | 0.41 | 7.11 | 0.0117 | 0.0000 | |||
| AMID / EA Series Trust - Argent Mid Cap ETF | 0.01 | 0.00 | 0.40 | 5.60 | 0.0113 | -0.0002 | |||
| ADI / Analog Devices, Inc. | 0.00 | 0.00 | 0.39 | 18.18 | 0.0112 | 0.0010 | |||
| ABBV / AbbVie Inc. | 0.00 | -1.31 | 0.36 | -12.77 | 0.0104 | -0.0023 | |||
| AMP / Ameriprise Financial, Inc. | 0.00 | -98.60 | 0.35 | -98.46 | 0.0100 | -0.6811 | |||
| TJX / The TJX Companies, Inc. | 0.00 | 0.00 | 0.33 | 1.52 | 0.0095 | -0.0005 | |||
| SBUX / Starbucks Corporation | 0.00 | 0.00 | 0.33 | -6.46 | 0.0095 | -0.0014 | |||
| CSCO / Cisco Systems, Inc. | 0.00 | 0.00 | 0.33 | 12.29 | 0.0094 | 0.0005 | |||
| BLK / BlackRock, Inc. | 0.00 | 0.00 | 0.30 | 11.07 | 0.0086 | 0.0003 | |||
| ADBE / Adobe Inc. | 0.00 | 0.00 | 0.30 | 0.68 | 0.0085 | -0.0005 | |||
| ABT / Abbott Laboratories | 0.00 | 0.00 | 0.29 | 2.48 | 0.0083 | -0.0004 | |||
| JNJ / Johnson & Johnson | 0.00 | 0.00 | 0.28 | -7.92 | 0.0080 | -0.0013 | |||
| MRK / Merck & Co., Inc. | 0.00 | 0.00 | 0.28 | -11.58 | 0.0079 | -0.0017 | |||
| SPY / SPDR S&P 500 ETF | 0.00 | 0.27 | 0.0077 | 0.0077 | |||||
| IBM / International Business Machines Corporation | 0.00 | 0.00 | 0.27 | 18.67 | 0.0076 | 0.0007 | |||
| UNH / UnitedHealth Group Incorporated | 0.00 | -99.62 | 0.25 | -99.77 | 0.0071 | -3.3038 | |||
| IEFA / iShares Trust - iShares Core MSCI EAFE ETF | 0.00 | -5.87 | 0.24 | 3.83 | 0.0070 | -0.0002 | |||
| POST / Post Holdings, Inc. | 0.00 | 0.00 | 0.24 | -6.15 | 0.0070 | -0.0010 | |||
| CAH / Cardinal Health, Inc. | 0.00 | 0.23 | 0.0065 | 0.0065 | |||||
| PM / Philip Morris International Inc. | 0.00 | 0.23 | 0.0065 | 0.0065 | |||||
| PKG / Packaging Corporation of America | 0.00 | 0.00 | 0.22 | -5.15 | 0.0063 | -0.0008 | |||
| MOH / Molina Healthcare, Inc. | 0.00 | -0.27 | 0.22 | -9.92 | 0.0062 | -0.0012 | |||
| LMT / Lockheed Martin Corporation | 0.00 | 0.00 | 0.21 | 3.90 | 0.0061 | -0.0002 | |||
| DFSV / Dimensional ETF Trust - Dimensional US Small Cap Value ETF | 0.00 | -100.00 | 0.00 | -100.00 | -0.0152 | ||||
| GIS / General Mills, Inc. | 0.00 | -100.00 | 0.00 | -100.00 | -0.0070 | ||||
| IWB / iShares Trust - iShares Russell 1000 ETF | 0.00 | -100.00 | 0.00 | -100.00 | -0.5289 | ||||
| IWR / iShares Trust - iShares Russell Mid-Cap ETF | 0.00 | -100.00 | 0.00 | -100.00 | -0.2208 | ||||
| SDY / SPDR Series Trust - SPDR S&P Dividend ETF | 0.00 | -100.00 | 0.00 | -100.00 | -0.2553 | ||||
| LOW / Lowe's Companies, Inc. | 0.00 | -100.00 | 0.00 | -100.00 | -0.0064 | ||||
| SCHM / Schwab Strategic Trust - Schwab U.S. Mid-Cap ETF | 0.00 | -100.00 | 0.00 | -100.00 | -0.0083 | ||||
| EXPO / Exponent, Inc. | 0.00 | -100.00 | 0.00 | -100.00 | -0.0227 | ||||
| SCHD / Schwab Strategic Trust - Schwab U.S. Dividend Equity ETF | 0.00 | -100.00 | 0.00 | -100.00 | -0.0458 | ||||
| SCHX / Schwab Strategic Trust - Schwab U.S. Large-Cap ETF | 0.00 | -100.00 | 0.00 | -100.00 | -0.0878 | ||||
| CDW / CDW Corporation | 0.00 | -100.00 | 0.00 | -100.00 | -0.0093 |