Statistik Asas
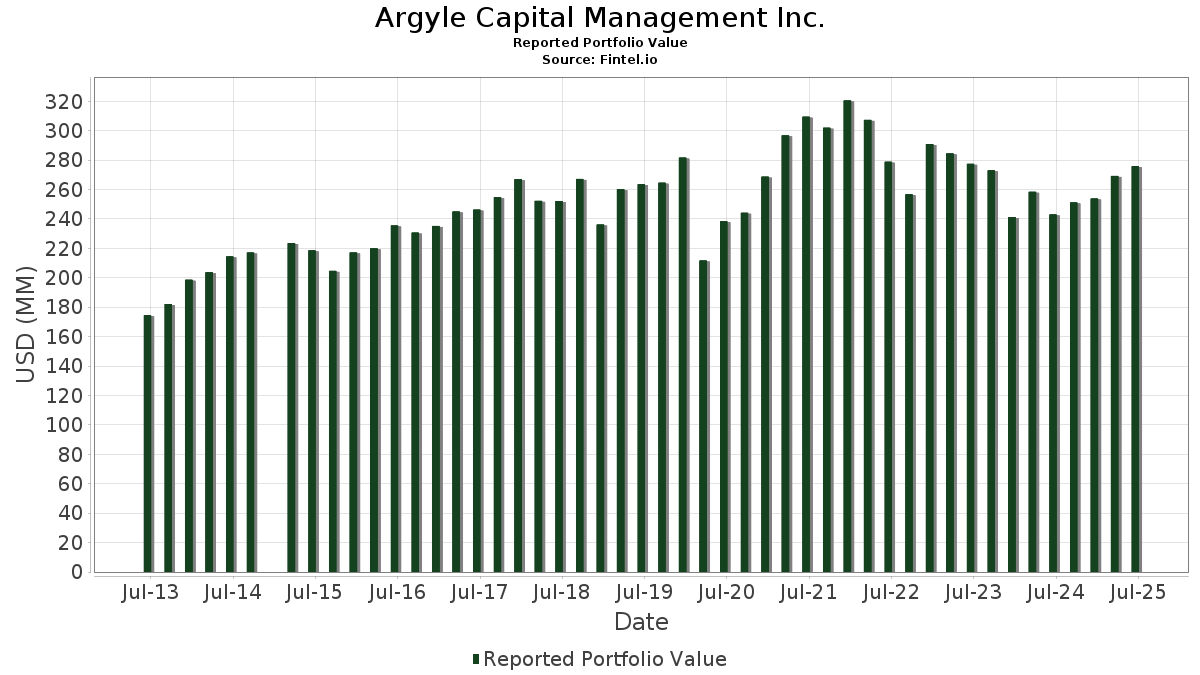
| Nilai Portfolio | $ 275,809,595 |
| Kedudukan Semasa | 132 |
Pegangan Terkini, Prestasi, AUM (dari 13F, 13D)
Argyle Capital Management Inc. telah mendedahkan 132 jumlah pegangan dalam pemfailan SEC terkini mereka. Nilai portfolio terkini dikira sebagai $ 275,809,595 USD. Aset Sebenar Di Bawah Pengurusan (AUM) ialah nilai ini ditambah dengan tunai (yang tidak didedahkan). Pegangan teratas Argyle Capital Management Inc. ialah Microsoft Corporation (US:MSFT) , Eli Lilly and Company (US:LLY) , JPMorgan Chase & Co. (US:JPM) , McKesson Corporation (US:MCK) , and International Business Machines Corporation (US:IBM) . Kedudukan baharu Argyle Capital Management Inc. termasuk Palantir Technologies Inc. (US:PLTR) , .
Kenaikan Teratas Suku Tahun Ini
Kami menggunakan perubahan dalam peruntukan portfolio kerana ini adalah metrik yang paling bermakna. Perubahan boleh disebabkan oleh perdagangan atau perubahan dalam harga saham.
| Sekuriti | Saham (MM) |
Nilai (MM$) |
Portfolio % | ΔPortfolio % |
|---|---|---|---|---|
| 0.03 | 13.83 | 5.0138 | 1.0614 | |
| 0.03 | 5.55 | 2.0111 | 0.7169 | |
| 0.03 | 8.63 | 3.1301 | 0.4442 | |
| 0.02 | 6.94 | 2.5154 | 0.3047 | |
| 0.01 | 2.29 | 0.8288 | 0.2984 | |
| 0.15 | 3.08 | 1.1173 | 0.2703 | |
| 0.03 | 4.49 | 1.6266 | 0.2563 | |
| 0.02 | 2.44 | 0.8844 | 0.2264 | |
| 0.01 | 1.48 | 0.5355 | 0.2023 | |
| 0.01 | 4.49 | 1.6284 | 0.1867 |
Penurunan Teratas Suku Tahun Ini
Kami menggunakan perubahan dalam peruntukan portfolio kerana ini adalah metrik yang paling bermakna. Perubahan boleh disebabkan oleh perdagangan atau perubahan dalam harga saham.
| Sekuriti | Saham (MM) |
Nilai (MM$) |
Portfolio % | ΔPortfolio % |
|---|---|---|---|---|
| 0.07 | 3.19 | 1.1556 | -0.4018 | |
| 0.01 | 8.67 | 3.1449 | -0.3883 | |
| 0.02 | 2.74 | 0.9935 | -0.3191 | |
| 0.02 | 5.41 | 1.9610 | -0.3038 | |
| 0.03 | 3.77 | 1.3663 | -0.2877 | |
| 0.06 | 4.69 | 1.7020 | -0.2851 | |
| 0.04 | 3.37 | 1.2233 | -0.2613 | |
| 0.01 | 7.84 | 2.8439 | -0.2393 | |
| 0.06 | 1.58 | 0.5730 | -0.1972 | |
| 0.03 | 4.68 | 1.6950 | -0.1829 |
13F dan Pemfailan Dana
Borang ini telah difailkan pada 2025-07-24 untuk tempoh pelaporan 2025-06-30. Klik ikon pautan untuk melihat sejarah transaksi penuh.
Tingkatkan untuk membuka data premium dan eksport ke Excel ![]() .
.
| Sekuriti | Jenis | Purata Harga Saham | Saham (MM) |
ΔSaham (%) |
ΔSaham (%) |
Nilai ($MM) |
Portfolio (%) |
ΔPortfolio (%) |
|
|---|---|---|---|---|---|---|---|---|---|
| MSFT / Microsoft Corporation | 0.03 | -1.92 | 13.83 | 29.96 | 5.0138 | 1.0614 | |||
| LLY / Eli Lilly and Company | 0.01 | -3.39 | 8.67 | -8.82 | 3.1449 | -0.3883 | |||
| JPM / JPMorgan Chase & Co. | 0.03 | 1.02 | 8.63 | 19.39 | 3.1301 | 0.4442 | |||
| MCK / McKesson Corporation | 0.01 | -13.22 | 7.84 | -5.51 | 2.8439 | -0.2393 | |||
| IBM / International Business Machines Corporation | 0.02 | -1.67 | 6.94 | 16.57 | 2.5154 | 0.3047 | |||
| PNC / The PNC Financial Services Group, Inc. | 0.03 | 1.21 | 6.25 | 7.35 | 2.2677 | 0.1034 | |||
| RTX / RTX Corporation | 0.04 | -1.89 | 6.16 | 8.16 | 2.2349 | 0.1178 | |||
| ORCL / Oracle Corporation | 0.03 | 1.81 | 5.55 | 59.18 | 2.0111 | 0.7169 | |||
| DE / Deere & Company | 0.01 | -2.69 | 5.52 | 5.43 | 2.0009 | 0.0565 | |||
| AMGN / Amgen Inc. | 0.02 | -1.02 | 5.41 | -11.30 | 1.9610 | -0.3038 | |||
| CSCO / Cisco Systems, Inc. | 0.08 | -1.04 | 5.39 | 11.27 | 1.9544 | 0.1548 | |||
| MRK / Merck & Co., Inc. | 0.06 | -0.50 | 4.69 | -12.25 | 1.7020 | -0.2851 | |||
| PAYX / Paychex, Inc. | 0.03 | -1.92 | 4.68 | -7.52 | 1.6950 | -0.1829 | |||
| CAT / Caterpillar Inc. | 0.01 | -1.70 | 4.49 | 15.72 | 1.6284 | 0.1867 | |||
| EMR / Emerson Electric Co. | 0.03 | 0.00 | 4.49 | 21.60 | 1.6266 | 0.2563 | |||
| T / AT&T Inc. | 0.15 | -1.25 | 4.40 | 1.06 | 1.5941 | -0.0219 | |||
| BAC / Bank of America Corporation | 0.09 | -1.39 | 4.38 | 11.82 | 1.5877 | 0.1332 | |||
| PHM / PulteGroup, Inc. | 0.04 | -2.37 | 4.34 | 0.16 | 1.5750 | -0.0360 | |||
| JNJ / Johnson & Johnson | 0.03 | -0.38 | 3.96 | -8.26 | 1.4346 | -0.1672 | |||
| CVX / Chevron Corporation | 0.03 | -1.13 | 3.77 | -15.36 | 1.3663 | -0.2877 | |||
| KO / The Coca-Cola Company | 0.05 | -2.69 | 3.70 | -3.87 | 1.3408 | -0.0881 | |||
| DUK / Duke Energy Corporation | 0.03 | -1.56 | 3.59 | -4.75 | 1.3003 | -0.0984 | |||
| VZ / Verizon Communications Inc. | 0.08 | -0.62 | 3.58 | -5.19 | 1.2984 | -0.1048 | |||
| ENB / Enbridge Inc. | 0.08 | -1.71 | 3.57 | 0.54 | 1.2926 | -0.0246 | |||
| GPC / Genuine Parts Company | 0.03 | -1.04 | 3.46 | 0.76 | 1.2540 | -0.0210 | |||
| COP / ConocoPhillips | 0.04 | -1.21 | 3.37 | -15.59 | 1.2233 | -0.2613 | |||
| WFC / Wells Fargo & Company | 0.04 | -2.01 | 3.36 | 9.34 | 1.2182 | 0.0770 | |||
| PFE / Pfizer Inc. | 0.14 | -0.36 | 3.35 | -4.67 | 1.2146 | -0.0909 | |||
| MDT / Medtronic plc | 0.04 | 0.41 | 3.23 | -2.59 | 1.1713 | -0.0607 | |||
| BMY / Bristol-Myers Squibb Company | 0.07 | 0.15 | 3.19 | -23.97 | 1.1556 | -0.4018 | |||
| ALL / The Allstate Corporation | 0.02 | -1.53 | 3.18 | -4.28 | 1.1525 | -0.0808 | |||
| HPE / Hewlett Packard Enterprise Company | 0.15 | 1.96 | 3.08 | 35.13 | 1.1173 | 0.2703 | |||
| MMM / 3M Company | 0.02 | -1.96 | 3.05 | 1.67 | 1.1066 | -0.0088 | |||
| MET / MetLife, Inc. | 0.04 | 1.21 | 3.03 | 1.37 | 1.0979 | -0.0116 | |||
| CB / Chubb Limited | 0.01 | -2.40 | 2.90 | -6.37 | 1.0502 | -0.0989 | |||
| GM / General Motors Company | 0.06 | -1.23 | 2.77 | 3.36 | 1.0048 | 0.0088 | |||
| UPS / United Parcel Service, Inc. | 0.03 | 0.00 | 2.77 | -8.23 | 1.0030 | -0.1167 | |||
| FI / Fiserv, Inc. | 0.02 | -0.68 | 2.74 | -22.45 | 0.9935 | -0.3191 | |||
| INTC / Intel Corporation | 0.12 | -0.17 | 2.64 | -1.56 | 0.9590 | -0.0387 | |||
| WAT / Waters Corporation | 0.01 | -2.58 | 2.64 | -7.74 | 0.9555 | -0.1055 | |||
| WM / Waste Management, Inc. | 0.01 | -1.73 | 2.60 | -2.87 | 0.9439 | -0.0517 | |||
| PSX / Phillips 66 | 0.02 | 2.20 | 2.49 | -1.27 | 0.9026 | -0.0338 | |||
| DELL / Dell Technologies Inc. | 0.02 | 2.37 | 2.44 | 37.72 | 0.8844 | 0.2264 | |||
| SO / The Southern Company | 0.03 | 0.00 | 2.41 | -0.12 | 0.8747 | -0.0226 | |||
| PPL / PPL Corporation | 0.07 | -1.53 | 2.40 | -7.59 | 0.8701 | -0.0944 | |||
| CEG / Constellation Energy Corporation | 0.01 | 0.00 | 2.29 | 60.13 | 0.8288 | 0.2984 | |||
| HSY / The Hershey Company | 0.01 | 0.00 | 2.24 | -2.94 | 0.8129 | -0.0454 | |||
| CMCSA / Comcast Corporation | 0.06 | 0.49 | 2.18 | -2.80 | 0.7918 | -0.0428 | |||
| VRSN / VeriSign, Inc. | 0.01 | -1.33 | 2.15 | 12.24 | 0.7784 | 0.0680 | |||
| TFC / Truist Financial Corporation | 0.05 | 5.11 | 2.12 | 9.83 | 0.7695 | 0.0516 | |||
| CVS / CVS Health Corporation | 0.03 | 0.66 | 2.10 | 2.49 | 0.7607 | 0.0003 | |||
| DD / DuPont de Nemours, Inc. | 0.03 | 1.38 | 2.00 | -6.88 | 0.7261 | -0.0728 | |||
| GJR / Strats Trust For Procter & Gambel Security - Preferred Security | 0.01 | 0.00 | 1.93 | -6.52 | 0.7014 | -0.0672 | |||
| CTVA / Corteva, Inc. | 0.03 | -1.62 | 1.93 | 16.53 | 0.7006 | 0.0846 | |||
| WY / Weyerhaeuser Company | 0.07 | -0.75 | 1.88 | -12.94 | 0.6809 | -0.1201 | |||
| BAX / Baxter International Inc. | 0.06 | 0.17 | 1.76 | -11.40 | 0.6398 | -0.0999 | |||
| GE / General Electric Company | 0.01 | 0.00 | 1.61 | 28.61 | 0.5853 | 0.1190 | |||
| DOW / Dow Inc. | 0.06 | 0.51 | 1.58 | -23.78 | 0.5730 | -0.1972 | |||
| SLB / Schlumberger Limited | 0.05 | 2.42 | 1.58 | -17.19 | 0.5713 | -0.1354 | |||
| FITB / Fifth Third Bancorp | 0.04 | 4.64 | 1.58 | 9.83 | 0.5711 | 0.0382 | |||
| FCX / Freeport-McMoRan Inc. | 0.04 | 1.42 | 1.55 | 16.15 | 0.5606 | 0.0661 | |||
| AVGO / Broadcom Inc. | 0.01 | 0.00 | 1.48 | 64.55 | 0.5355 | 0.2023 | |||
| APD / Air Products and Chemicals, Inc. | 0.01 | 0.00 | 1.47 | -4.37 | 0.5317 | -0.0378 | |||
| GPN / Global Payments Inc. | 0.02 | -0.55 | 1.46 | -18.69 | 0.5283 | -0.1375 | |||
| SON / Sonoco Products Company | 0.03 | -2.10 | 1.42 | -9.74 | 0.5142 | -0.0694 | |||
| EXC / Exelon Corporation | 0.03 | 1.25 | 1.40 | -4.55 | 0.5092 | -0.0376 | |||
| FOUR / Shift4 Payments, Inc. | 0.01 | 7.14 | 1.34 | 29.93 | 0.4851 | 0.1027 | |||
| F / Ford Motor Company | 0.12 | -3.15 | 1.33 | 4.80 | 0.4831 | 0.0107 | |||
| UGI / UGI Corporation | 0.04 | 1.53 | 1.33 | 11.78 | 0.4816 | 0.0404 | |||
| GEHC / GE HealthCare Technologies Inc. | 0.02 | 8.47 | 1.33 | -0.45 | 0.4813 | -0.0140 | |||
| TT / Trane Technologies plc | 0.00 | 0.00 | 1.31 | 29.90 | 0.4758 | 0.1003 | |||
| HRB / H&R Block, Inc. | 0.02 | 0.00 | 1.28 | 0.00 | 0.4624 | -0.0115 | |||
| XOM / Exxon Mobil Corporation | 0.01 | 0.00 | 1.25 | -9.38 | 0.4520 | -0.0589 | |||
| HAL / Halliburton Company | 0.06 | 0.00 | 1.22 | -19.66 | 0.4432 | -0.1220 | |||
| GEV / GE Vernova Inc. | 0.00 | 0.00 | 1.21 | 73.28 | 0.4376 | 0.1790 | |||
| NXPI / NXP Semiconductors N.V. | 0.01 | 8.28 | 1.16 | 24.41 | 0.4198 | 0.0743 | |||
| FLO / Flowers Foods, Inc. | 0.07 | 0.00 | 1.13 | -16.00 | 0.4115 | -0.0900 | |||
| ADM / Archer-Daniels-Midland Company | 0.02 | 0.98 | 1.09 | 10.94 | 0.3937 | 0.0304 | |||
| BRK.B / Berkshire Hathaway Inc. | 0.00 | 0.00 | 1.08 | -8.78 | 0.3921 | -0.0483 | |||
| HPQ / HP Inc. | 0.04 | 4.02 | 1.01 | -8.08 | 0.3669 | -0.0422 | |||
| TRP / TC Energy Corporation | 0.02 | -0.80 | 1.00 | 2.57 | 0.3615 | 0.0003 | |||
| AAPL / Apple Inc. | 0.00 | 0.00 | 0.97 | -7.69 | 0.3530 | -0.0385 | |||
| PEP / PepsiCo, Inc. | 0.01 | 3.03 | 0.90 | -9.30 | 0.3255 | -0.0420 | |||
| MKC / McCormick & Company, Incorporated | 0.01 | 0.00 | 0.80 | -7.95 | 0.2900 | -0.0325 | |||
| TXN / Texas Instruments Incorporated | 0.00 | 0.00 | 0.77 | 15.66 | 0.2785 | 0.0316 | |||
| ADP / Automatic Data Processing, Inc. | 0.00 | 0.00 | 0.77 | 0.92 | 0.2781 | -0.0042 | |||
| BP / BP p.l.c. - Depositary Receipt (Common Stock) | 0.03 | 0.00 | 0.76 | -11.42 | 0.2757 | -0.0432 | |||
| VLO / Valero Energy Corporation | 0.01 | 0.00 | 0.74 | 1.79 | 0.2681 | -0.0018 | |||
| CAG / Conagra Brands, Inc. | 0.04 | 0.57 | 0.72 | -22.81 | 0.2616 | -0.0856 | |||
| MSI / Motorola Solutions, Inc. | 0.00 | 0.00 | 0.71 | -3.90 | 0.2590 | -0.0173 | |||
| MCO / Moody's Corporation | 0.00 | 0.00 | 0.70 | 7.83 | 0.2546 | 0.0124 | |||
| GLW / Corning Incorporated | 0.01 | 0.00 | 0.70 | 14.83 | 0.2530 | 0.0274 | |||
| GWW / W.W. Grainger, Inc. | 0.00 | 0.00 | 0.69 | 5.34 | 0.2508 | 0.0068 | |||
| AEP / American Electric Power Company, Inc. | 0.01 | 0.00 | 0.68 | -5.13 | 0.2483 | -0.0196 | |||
| QCOM / QUALCOMM Incorporated | 0.00 | 4.99 | 0.67 | 8.94 | 0.2430 | 0.0143 | |||
| KHC / The Kraft Heinz Company | 0.03 | 3.23 | 0.66 | -12.37 | 0.2391 | -0.0405 | |||
| ABBV / AbbVie Inc. | 0.00 | 0.00 | 0.65 | -11.46 | 0.2356 | -0.0368 | |||
| NSC / Norfolk Southern Corporation | 0.00 | 0.00 | 0.63 | 8.06 | 0.2285 | 0.0119 | |||
| AMCR / Amcor plc | 0.07 | 0.00 | 0.62 | -5.34 | 0.2253 | -0.0183 | |||
| ITW / Illinois Tool Works Inc. | 0.00 | 0.00 | 0.62 | -0.32 | 0.2232 | -0.0062 | |||
| DXC / DXC Technology Company | 0.04 | -9.08 | 0.61 | -18.51 | 0.2221 | -0.0570 | |||
| TTE / TotalEnergies SE - Depositary Receipt (Common Stock) | 0.01 | 0.00 | 0.60 | -5.06 | 0.2181 | -0.0173 | |||
| KMB / Kimberly-Clark Corporation | 0.00 | 0.00 | 0.60 | -9.27 | 0.2166 | -0.0282 | |||
| NVDA / NVIDIA Corporation | 0.00 | 0.00 | 0.55 | 45.65 | 0.2005 | 0.0596 | |||
| ABT / Abbott Laboratories | 0.00 | 0.00 | 0.53 | 2.71 | 0.1926 | 0.0002 | |||
| MGA / Magna International Inc. | 0.01 | 1.61 | 0.49 | 15.44 | 0.1764 | 0.0198 | |||
| SIGI / Selective Insurance Group, Inc. | 0.01 | 0.00 | 0.47 | -5.39 | 0.1720 | -0.0142 | |||
| CHTR / Charter Communications, Inc. | 0.00 | -3.98 | 0.47 | 6.31 | 0.1715 | 0.0065 | |||
| PEG / Public Service Enterprise Group Incorporated | 0.01 | 18.78 | 0.45 | 21.51 | 0.1641 | 0.0257 | |||
| SWK / Stanley Black & Decker, Inc. | 0.01 | 1.52 | 0.45 | -10.50 | 0.1640 | -0.0238 | |||
| NEE / NextEra Energy, Inc. | 0.01 | 0.00 | 0.45 | -1.97 | 0.1628 | -0.0075 | |||
| LW / Lamb Weston Holdings, Inc. | 0.01 | -4.19 | 0.39 | -6.86 | 0.1430 | -0.0142 | |||
| PNR / Pentair plc | 0.00 | 0.00 | 0.39 | 17.33 | 0.1402 | 0.0178 | |||
| AMZN / Amazon.com, Inc. | 0.00 | 0.00 | 0.38 | 15.45 | 0.1383 | 0.0154 | |||
| PTC / PTC Inc. | 0.00 | 0.00 | 0.36 | 11.49 | 0.1302 | 0.0103 | |||
| CR / Crane Company | 0.00 | 0.00 | 0.34 | 24.19 | 0.1248 | 0.0217 | |||
| EMN / Eastman Chemical Company | 0.00 | 28.86 | 0.33 | 9.18 | 0.1209 | 0.0075 | |||
| CNP / CenterPoint Energy, Inc. | 0.01 | 0.00 | 0.32 | 1.29 | 0.1146 | -0.0012 | |||
| NVT / nVent Electric plc | 0.00 | 0.00 | 0.29 | 39.81 | 0.1044 | 0.0279 | |||
| NVS / Novartis AG - Depositary Receipt (Common Stock) | 0.00 | 0.00 | 0.29 | 8.71 | 0.1042 | 0.0059 | |||
| SOLV / Solventum Corporation | 0.00 | -9.74 | 0.28 | -10.13 | 0.1031 | -0.0142 | |||
| BIL / SPDR Series Trust - SPDR Bloomberg 1-3 Month T-Bill ETF | 0.00 | -1.94 | 0.27 | -2.15 | 0.0993 | -0.0044 | |||
| PLTR / Palantir Technologies Inc. | 0.00 | 0.27 | 0.0989 | 0.0989 | |||||
| TEVA / Teva Pharmaceutical Industries Limited - Depositary Receipt (Common Stock) | 0.02 | 0.00 | 0.27 | 9.27 | 0.0984 | 0.0060 | |||
| AFL / Aflac Incorporated | 0.00 | 0.00 | 0.22 | -5.11 | 0.0811 | -0.0065 | |||
| HSBC / HSBC Holdings plc - Depositary Receipt (Common Stock) | 0.00 | 0.00 | 0.22 | 5.74 | 0.0804 | 0.0026 | |||
| IR / Ingersoll Rand Inc. | 0.00 | 0.00 | 0.22 | 4.27 | 0.0798 | 0.0011 | |||
| DVN / Devon Energy Corporation | 0.01 | 0.00 | 0.22 | -14.90 | 0.0788 | -0.0161 | |||
| MA / Mastercard Incorporated | 0.00 | 0.00 | 0.22 | 2.87 | 0.0780 | 0.0001 | |||
| Labcorp Holdings Inc. / (50540R409) | 0.00 | 0.20 | 0.0000 | ||||||
| WBD / Warner Bros. Discovery, Inc. | 0.01 | 0.00 | 0.12 | 6.48 | 0.0418 | 0.0017 | |||
| NWL / Newell Brands Inc. | 0.01 | 0.00 | 0.06 | -12.68 | 0.0227 | -0.0040 |