Statistik Asas
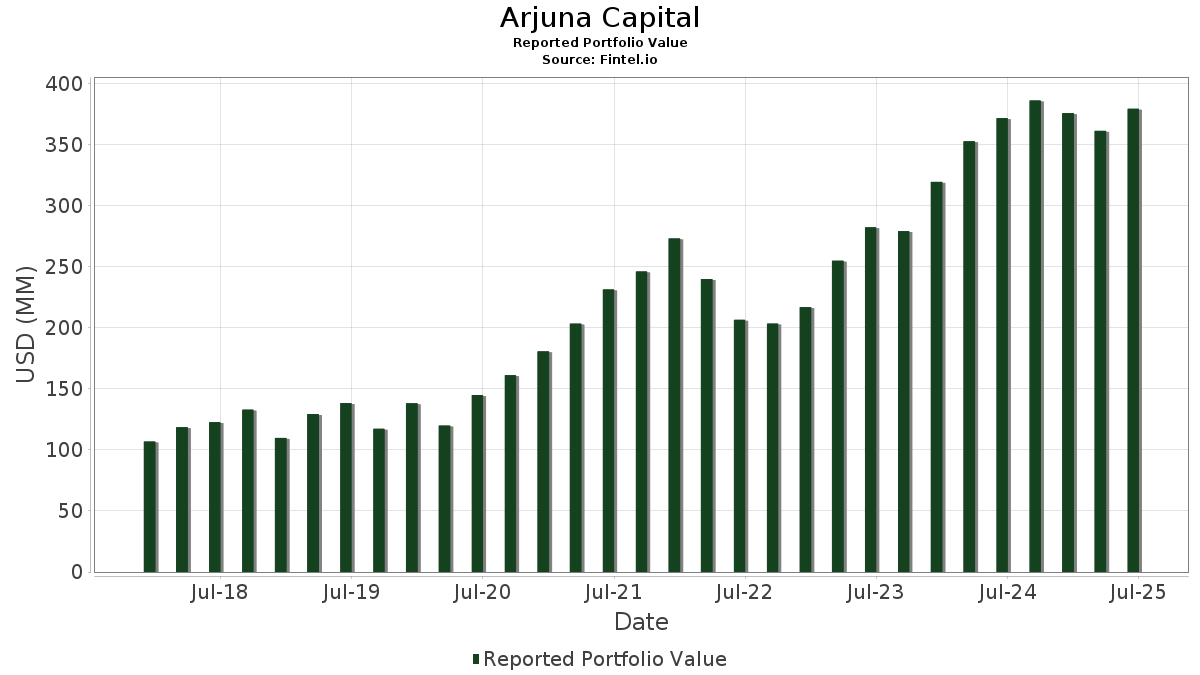
| Nilai Portfolio | $ 379,364,322 |
| Kedudukan Semasa | 117 |
Pegangan Terkini, Prestasi, AUM (dari 13F, 13D)
Arjuna Capital telah mendedahkan 117 jumlah pegangan dalam pemfailan SEC terkini mereka. Nilai portfolio terkini dikira sebagai $ 379,364,322 USD. Aset Sebenar Di Bawah Pengurusan (AUM) ialah nilai ini ditambah dengan tunai (yang tidak didedahkan). Pegangan teratas Arjuna Capital ialah iShares Trust - iShares 0-3 Month Treasury Bond ETF (US:SGOV) , Microsoft Corporation (US:MSFT) , Apple Inc. (US:AAPL) , NVIDIA Corporation (US:NVDA) , and Alphabet Inc. (US:GOOGL) . Kedudukan baharu Arjuna Capital termasuk Takeda Pharmaceutical Company Limited - Depositary Receipt (Common Stock) (US:TAK) , Kyndryl Holdings, Inc. (US:KD) , Eli Lilly and Company (US:LLY) , Aon plc (US:AON) , and Albertsons Companies, Inc. (US:ACI) .
Kenaikan Teratas Suku Tahun Ini
Kami menggunakan perubahan dalam peruntukan portfolio kerana ini adalah metrik yang paling bermakna. Perubahan boleh disebabkan oleh perdagangan atau perubahan dalam harga saham.
| Sekuriti | Saham (MM) |
Nilai (MM$) |
Portfolio % | ΔPortfolio % |
|---|---|---|---|---|
| 0.14 | 22.47 | 5.9222 | 1.4445 | |
| 0.05 | 24.46 | 6.4487 | 1.0885 | |
| 0.55 | 55.47 | 14.6208 | 1.0843 | |
| 0.02 | 6.61 | 1.7413 | 0.5759 | |
| 0.03 | 2.97 | 0.7820 | 0.3483 | |
| 0.00 | 4.66 | 1.2295 | 0.2742 | |
| 0.06 | 0.85 | 0.2250 | 0.2250 | |
| 0.02 | 0.84 | 0.2217 | 0.2217 | |
| 0.09 | 15.99 | 4.2162 | 0.2171 | |
| 0.01 | 0.65 | 0.1715 | 0.1715 |
Penurunan Teratas Suku Tahun Ini
Kami menggunakan perubahan dalam peruntukan portfolio kerana ini adalah metrik yang paling bermakna. Perubahan boleh disebabkan oleh perdagangan atau perubahan dalam harga saham.
| Sekuriti | Saham (MM) |
Nilai (MM$) |
Portfolio % | ΔPortfolio % |
|---|---|---|---|---|
| 0.12 | 23.69 | 6.2446 | -1.1501 | |
| 0.01 | 3.32 | 0.8752 | -0.5507 | |
| 0.01 | 2.47 | 0.6500 | -0.5498 | |
| 0.10 | 2.98 | 0.7854 | -0.3973 | |
| 0.02 | 6.21 | 1.6359 | -0.2428 | |
| 0.01 | 1.80 | 0.4756 | -0.2179 | |
| 0.02 | 1.82 | 0.4786 | -0.1963 | |
| 0.02 | 7.07 | 1.8628 | -0.1772 | |
| 0.47 | 13.62 | 3.5898 | -0.1760 | |
| 0.02 | 3.77 | 0.9948 | -0.1742 |
13F dan Pemfailan Dana
Borang ini telah difailkan pada 2025-08-13 untuk tempoh pelaporan 2025-06-30. Klik ikon pautan untuk melihat sejarah transaksi penuh.
Tingkatkan untuk membuka data premium dan eksport ke Excel ![]() .
.
| Sekuriti | Jenis | Purata Harga Saham | Saham (MM) |
ΔSaham (%) |
ΔSaham (%) |
Nilai ($MM) |
Portfolio (%) |
ΔPortfolio (%) |
|
|---|---|---|---|---|---|---|---|---|---|
| SGOV / iShares Trust - iShares 0-3 Month Treasury Bond ETF | 0.55 | 13.39 | 55.47 | 13.41 | 14.6208 | 1.0843 | |||
| MSFT / Microsoft Corporation | 0.05 | -4.66 | 24.46 | 26.33 | 6.4487 | 1.0885 | |||
| AAPL / Apple Inc. | 0.12 | -4.00 | 23.69 | -11.33 | 6.2446 | -1.1501 | |||
| NVDA / NVIDIA Corporation | 0.14 | -4.73 | 22.47 | 38.88 | 5.9222 | 1.4445 | |||
| GOOGL / Alphabet Inc. | 0.09 | -2.86 | 15.99 | 10.70 | 4.2162 | 0.2171 | |||
| SPTI / SPDR Series Trust - SPDR Portfolio Intermediate Term Treasury ETF | 0.47 | -0.57 | 13.62 | 0.10 | 3.5898 | -0.1760 | |||
| AMZN / Amazon.com, Inc. | 0.04 | -4.35 | 9.64 | 10.28 | 2.5418 | 0.1218 | |||
| JPM / JPMorgan Chase & Co. | 0.03 | -4.53 | 9.28 | 12.84 | 2.4470 | 0.1699 | |||
| HD / The Home Depot, Inc. | 0.02 | -4.16 | 7.07 | -4.12 | 1.8628 | -0.1772 | |||
| AVGO / Broadcom Inc. | 0.02 | -4.70 | 6.61 | 56.89 | 1.7413 | 0.5759 | |||
| ACN / Accenture plc | 0.02 | -4.54 | 6.21 | -8.56 | 1.6359 | -0.2428 | |||
| WM / Waste Management, Inc. | 0.03 | -2.97 | 6.04 | -4.09 | 1.5930 | -0.1512 | |||
| AMP / Ameriprise Financial, Inc. | 0.01 | -4.90 | 5.87 | 4.84 | 1.5480 | -0.0023 | |||
| KR / The Kroger Co. | 0.08 | -4.08 | 5.82 | 1.64 | 1.5347 | -0.0508 | |||
| COST / Costco Wholesale Corporation | 0.01 | -4.30 | 4.98 | 0.18 | 1.3128 | -0.0634 | |||
| GWW / W.W. Grainger, Inc. | 0.00 | -4.38 | 4.77 | 0.70 | 1.2583 | -0.0538 | |||
| TRV / The Travelers Companies, Inc. | 0.02 | -4.36 | 4.73 | -3.24 | 1.2456 | -0.1062 | |||
| NFLX / Netflix, Inc. | 0.00 | -5.89 | 4.66 | 35.15 | 1.2295 | 0.2742 | |||
| GSK / GSK plc - Depositary Receipt (Common Stock) | 0.12 | -5.00 | 4.50 | -5.84 | 1.1859 | -0.1365 | |||
| V / Visa Inc. | 0.01 | -8.39 | 4.23 | -7.19 | 1.1154 | -0.1466 | |||
| MET / MetLife, Inc. | 0.05 | 22.87 | 4.16 | 23.07 | 1.0969 | 0.1610 | |||
| SFM / Sprouts Farmers Market, Inc. | 0.02 | -17.16 | 3.77 | -10.63 | 0.9948 | -0.1742 | |||
| MA / Mastercard Incorporated | 0.01 | -5.00 | 3.45 | -2.60 | 0.9086 | -0.0710 | |||
| PSA / Public Storage | 0.01 | -4.69 | 3.38 | -6.55 | 0.8920 | -0.1103 | |||
| CMCSA / Comcast Corporation | 0.09 | -5.16 | 3.35 | -8.28 | 0.8823 | -0.1277 | |||
| TMO / Thermo Fisher Scientific Inc. | 0.01 | -20.90 | 3.32 | -35.55 | 0.8752 | -0.5507 | |||
| TJX / The TJX Companies, Inc. | 0.03 | -4.17 | 3.19 | -2.83 | 0.8412 | -0.0679 | |||
| CSCO / Cisco Systems, Inc. | 0.05 | -4.64 | 3.16 | 7.24 | 0.8317 | 0.0171 | |||
| IBM / International Business Machines Corporation | 0.01 | -4.77 | 3.08 | 12.90 | 0.8122 | 0.0567 | |||
| ITW / Illinois Tool Works Inc. | 0.01 | -4.38 | 3.03 | -4.65 | 0.7998 | -0.0812 | |||
| AMAL / Amalgamated Financial Corp. | 0.10 | -35.75 | 2.98 | -30.28 | 0.7854 | -0.3973 | |||
| JCI / Johnson Controls International plc | 0.03 | 43.60 | 2.97 | 89.28 | 0.7820 | 0.3483 | |||
| CWT / California Water Service Group | 0.06 | -4.21 | 2.88 | -10.09 | 0.7584 | -0.1274 | |||
| BEPC / Brookfield Renewable Corporation | 0.09 | -4.24 | 2.87 | 12.42 | 0.7568 | 0.0500 | |||
| PGR / The Progressive Corporation | 0.01 | -4.36 | 2.85 | -9.83 | 0.7524 | -0.1237 | |||
| MCK / McKesson Corporation | 0.00 | -4.15 | 2.79 | 4.38 | 0.7356 | -0.0045 | |||
| LOW / Lowe's Companies, Inc. | 0.01 | -4.25 | 2.63 | -8.92 | 0.6942 | -0.1061 | |||
| WSM / Williams-Sonoma, Inc. | 0.02 | 19.07 | 2.50 | 23.05 | 0.6587 | 0.0966 | |||
| UNH / UnitedHealth Group Incorporated | 0.01 | -4.49 | 2.47 | -43.12 | 0.6500 | -0.5498 | |||
| ADP / Automatic Data Processing, Inc. | 0.01 | -4.16 | 2.40 | -3.27 | 0.6325 | -0.0541 | |||
| NVO / Novo Nordisk A/S - Depositary Receipt (Common Stock) | 0.03 | -3.36 | 2.38 | -3.92 | 0.6266 | -0.0583 | |||
| APH / Amphenol Corporation | 0.02 | -5.56 | 2.28 | 42.22 | 0.6022 | 0.1575 | |||
| AXP / American Express Company | 0.01 | -5.19 | 2.27 | 12.42 | 0.5989 | 0.0394 | |||
| ORCL / Oracle Corporation | 0.01 | -4.66 | 2.15 | 49.07 | 0.5679 | 0.1679 | |||
| VZ / Verizon Communications Inc. | 0.05 | -4.54 | 2.15 | -8.93 | 0.5670 | -0.0868 | |||
| AMGN / Amgen Inc. | 0.01 | -3.48 | 2.03 | -13.51 | 0.5351 | -0.1144 | |||
| EXPD / Expeditors International of Washington, Inc. | 0.02 | -3.96 | 2.00 | -8.77 | 0.5269 | -0.0795 | |||
| SBUX / Starbucks Corporation | 0.02 | -20.28 | 1.82 | -25.55 | 0.4786 | -0.1963 | |||
| BDX / Becton, Dickinson and Company | 0.01 | -4.23 | 1.80 | -27.98 | 0.4756 | -0.2179 | |||
| AMAT / Applied Materials, Inc. | 0.01 | -4.35 | 1.72 | 20.69 | 0.4522 | 0.0587 | |||
| ESGV / Vanguard World Fund - Vanguard ESG U.S. Stock ETF | 0.02 | -3.57 | 1.71 | 7.95 | 0.4511 | 0.0123 | |||
| CAH / Cardinal Health, Inc. | 0.01 | -4.48 | 1.68 | 16.52 | 0.4426 | 0.0436 | |||
| TGT / Target Corporation | 0.02 | -3.82 | 1.68 | -9.06 | 0.4421 | -0.0685 | |||
| BKNG / Booking Holdings Inc. | 0.00 | -4.01 | 1.66 | 20.62 | 0.4380 | 0.0567 | |||
| SCHW / The Charles Schwab Corporation | 0.02 | -5.07 | 1.63 | 10.64 | 0.4306 | 0.0220 | |||
| DGX / Quest Diagnostics Incorporated | 0.01 | -7.36 | 1.55 | -1.65 | 0.4093 | -0.0277 | |||
| CB / Chubb Limited | 0.01 | -14.01 | 1.53 | -17.50 | 0.4039 | -0.1102 | |||
| DIS / The Walt Disney Company | 0.01 | -5.18 | 1.50 | 19.21 | 0.3960 | 0.0470 | |||
| HPQ / HP Inc. | 0.06 | -4.17 | 1.45 | -15.34 | 0.3829 | -0.0920 | |||
| NVS / Novartis AG - Depositary Receipt (Common Stock) | 0.01 | -4.46 | 1.44 | 3.75 | 0.3793 | -0.0047 | |||
| COR / Cencora, Inc. | 0.00 | -4.42 | 1.43 | 3.03 | 0.3761 | -0.0071 | |||
| SNY / Sanofi - Depositary Receipt (Common Stock) | 0.03 | -3.59 | 1.41 | -16.04 | 0.3713 | -0.0930 | |||
| C / Citigroup Inc. | 0.02 | -6.10 | 1.40 | 12.61 | 0.3697 | 0.0249 | |||
| BBY / Best Buy Co., Inc. | 0.02 | -4.25 | 1.39 | -12.69 | 0.3665 | -0.0742 | |||
| VRTX / Vertex Pharmaceuticals Incorporated | 0.00 | -22.25 | 1.38 | -28.62 | 0.3650 | -0.1718 | |||
| BK / The Bank of New York Mellon Corporation | 0.02 | -5.04 | 1.37 | 3.17 | 0.3609 | -0.0065 | |||
| NUE / Nucor Corporation | 0.01 | -4.58 | 1.36 | 2.72 | 0.3582 | -0.0080 | |||
| LECO / Lincoln Electric Holdings, Inc. | 0.01 | -4.70 | 1.32 | 4.44 | 0.3471 | -0.0018 | |||
| STT / State Street Corporation | 0.01 | -0.68 | 1.29 | 17.98 | 0.3392 | 0.0373 | |||
| RGA / Reinsurance Group of America, Incorporated | 0.01 | -5.04 | 1.28 | -4.32 | 0.3386 | -0.0331 | |||
| SYY / Sysco Corporation | 0.02 | -4.51 | 1.24 | -3.65 | 0.3268 | -0.0292 | |||
| PG / The Procter & Gamble Company | 0.01 | -4.18 | 1.24 | -10.42 | 0.3264 | -0.0562 | |||
| VMI / Valmont Industries, Inc. | 0.00 | -4.41 | 1.21 | 9.39 | 0.3194 | 0.0128 | |||
| CTSH / Cognizant Technology Solutions Corporation | 0.02 | -4.65 | 1.18 | -2.72 | 0.3114 | -0.0248 | |||
| CRM / Salesforce, Inc. | 0.00 | -4.68 | 1.17 | -3.14 | 0.3091 | -0.0260 | |||
| BXP / Boston Properties, Inc. | 0.02 | -5.13 | 1.17 | -4.72 | 0.3086 | -0.0315 | |||
| DVA / DaVita Inc. | 0.01 | -3.75 | 1.14 | -10.40 | 0.2998 | -0.0514 | |||
| EQIX / Equinix, Inc. | 0.00 | -3.75 | 1.12 | -6.02 | 0.2963 | -0.0350 | |||
| A / Agilent Technologies, Inc. | 0.01 | -4.21 | 1.12 | -3.37 | 0.2950 | -0.0256 | |||
| UL / Unilever PLC - Depositary Receipt (Common Stock) | 0.02 | 1.31 | 1.11 | 4.02 | 0.2936 | -0.0026 | |||
| MWA / Mueller Water Products, Inc. | 0.05 | -4.72 | 1.08 | -9.91 | 0.2854 | -0.0472 | |||
| DLX / Deluxe Corporation | 0.07 | -4.57 | 1.08 | -4.00 | 0.2851 | -0.0266 | |||
| NTRS / Northern Trust Corporation | 0.01 | -4.82 | 0.96 | 22.35 | 0.2525 | 0.0358 | |||
| BMI / Badger Meter, Inc. | 0.00 | -0.51 | 0.90 | 28.05 | 0.2385 | 0.0430 | |||
| TAK / Takeda Pharmaceutical Company Limited - Depositary Receipt (Common Stock) | 0.06 | 0.85 | 0.2250 | 0.2250 | |||||
| KD / Kyndryl Holdings, Inc. | 0.02 | 0.84 | 0.2217 | 0.2217 | |||||
| GAP / The Gap, Inc. | 0.04 | 0.75 | 0.83 | 6.67 | 0.2194 | 0.0033 | |||
| CNI / Canadian National Railway Company | 0.01 | -0.06 | 0.75 | 6.70 | 0.1973 | 0.0031 | |||
| FITB / Fifth Third Bancorp | 0.02 | -1.26 | 0.69 | 3.60 | 0.1820 | -0.0025 | |||
| DMXF / iShares Trust - iShares ESG Advanced MSCI EAFE ETF | 0.01 | 0.65 | 0.1715 | 0.1715 | |||||
| WLY / John Wiley & Sons, Inc. | 0.01 | -26.79 | 0.56 | -26.60 | 0.1484 | -0.0641 | |||
| GOOG / Alphabet Inc. | 0.00 | 0.00 | 0.49 | 13.36 | 0.1299 | 0.0098 | |||
| LLY / Eli Lilly and Company | 0.00 | 0.48 | 0.1253 | 0.1253 | |||||
| DOV / Dover Corporation | 0.00 | -1.43 | 0.47 | 2.65 | 0.1228 | -0.0026 | |||
| AON / Aon plc | 0.00 | 0.46 | 0.1217 | 0.1217 | |||||
| TILE / Interface, Inc. | 0.02 | -2.19 | 0.44 | 3.07 | 0.1151 | -0.0020 | |||
| EBAY / eBay Inc. | 0.01 | -0.14 | 0.41 | 9.81 | 0.1092 | 0.0047 | |||
| WAT / Waters Corporation | 0.00 | -2.40 | 0.40 | -7.67 | 0.1048 | -0.0143 | |||
| SCS / Steelcase Inc. | 0.04 | -1.15 | 0.39 | -5.98 | 0.1037 | -0.0121 | |||
| ACI / Albertsons Companies, Inc. | 0.02 | 0.38 | 0.1006 | 0.1006 | |||||
| CHGX / EA Series Trust - Stance Sustainable Beta ETF | 0.01 | 0.34 | 0.0890 | 0.0890 | |||||
| NKE / NIKE, Inc. | 0.00 | -32.65 | 0.33 | -24.77 | 0.0866 | -0.0341 | |||
| CDNS / Cadence Design Systems, Inc. | 0.00 | 8.37 | 0.28 | 31.63 | 0.0746 | 0.0150 | |||
| VTI / Vanguard Index Funds - Vanguard Total Stock Market ETF | 0.00 | 0.00 | 0.25 | 10.43 | 0.0671 | 0.0034 | |||
| UNP / Union Pacific Corporation | 0.00 | 0.25 | 0.0670 | 0.0670 | |||||
| ADBE / Adobe Inc. | 0.00 | -41.49 | 0.25 | -41.12 | 0.0666 | -0.0519 | |||
| VNO / Vornado Realty Trust | 0.01 | -48.93 | 0.25 | -47.27 | 0.0664 | -0.0656 | |||
| LII / Lennox International Inc. | 0.00 | 0.47 | 0.25 | 2.49 | 0.0653 | -0.0015 | |||
| DOC / Healthpeak Properties, Inc. | 0.01 | 0.25 | 0.0650 | 0.0650 | |||||
| VIG / Vanguard Specialized Funds - Vanguard Dividend Appreciation ETF | 0.00 | 0.21 | 0.0555 | 0.0555 | |||||
| IWF / iShares Trust - iShares Russell 1000 Growth ETF | 0.00 | 0.00 | 0.18 | 17.42 | 0.0482 | 0.0052 | |||
| IVV / iShares Trust - iShares Core S&P 500 ETF | 0.00 | 0.00 | 0.16 | 10.56 | 0.0416 | 0.0021 | |||
| IWM / iShares Trust - iShares Russell 2000 ETF | 0.00 | 0.00 | 0.04 | 10.53 | 0.0111 | 0.0003 | |||
| VO / Vanguard Index Funds - Vanguard Mid-Cap ETF | 0.00 | 0.00 | 0.04 | 8.57 | 0.0102 | 0.0003 | |||
| VTV / Vanguard Index Funds - Vanguard Value ETF | 0.00 | 0.00 | 0.02 | 6.25 | 0.0046 | -0.0001 | |||
| VB / Vanguard Index Funds - Vanguard Small-Cap ETF | 0.00 | -98.32 | 0.00 | -100.00 | 0.0001 | -0.0072 | |||
| VNQ / Vanguard Specialized Funds - Vanguard Real Estate ETF | 0.00 | 0.00 | 0.00 | 0.0000 | -0.0000 | ||||
| APOG / Apogee Enterprises, Inc. | 0.00 | -100.00 | 0.00 | 0.0000 | |||||
| JLL / Jones Lang LaSalle Incorporated | 0.00 | -100.00 | 0.00 | 0.0000 | |||||
| DELL / Dell Technologies Inc. | 0.00 | -100.00 | 0.00 | 0.0000 | |||||
| AKAM / Akamai Technologies, Inc. | 0.00 | -100.00 | 0.00 | 0.0000 | |||||
| AOS / A. O. Smith Corporation | 0.00 | -100.00 | 0.00 | 0.0000 | |||||
| UPS / United Parcel Service, Inc. | 0.00 | -100.00 | 0.00 | 0.0000 |