Statistik Asas
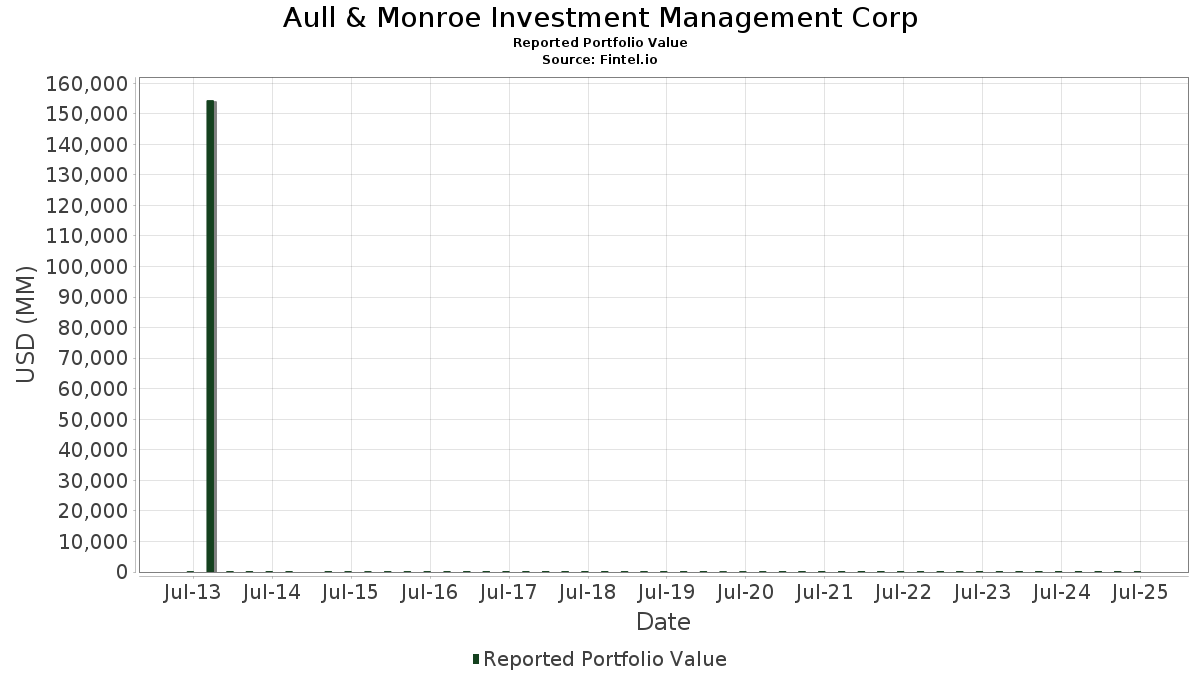
| Nilai Portfolio | $ 186,386,944 |
| Kedudukan Semasa | 123 |
Pegangan Terkini, Prestasi, AUM (dari 13F, 13D)
Aull & Monroe Investment Management Corp telah mendedahkan 123 jumlah pegangan dalam pemfailan SEC terkini mereka. Nilai portfolio terkini dikira sebagai $ 186,386,944 USD. Aset Sebenar Di Bawah Pengurusan (AUM) ialah nilai ini ditambah dengan tunai (yang tidak didedahkan). Pegangan teratas Aull & Monroe Investment Management Corp ialah Eli Lilly and Company (US:LLY) , Caterpillar Inc. (US:CAT) , The Southern Company (US:SO) , Deere & Company (US:DE) , and CME Group Inc. (US:CME) . Kedudukan baharu Aull & Monroe Investment Management Corp termasuk GE Vernova Inc. (US:GEV) , Moody's Corporation (US:MCO) , .
Kenaikan Teratas Suku Tahun Ini
Kami menggunakan perubahan dalam peruntukan portfolio kerana ini adalah metrik yang paling bermakna. Perubahan boleh disebabkan oleh perdagangan atau perubahan dalam harga saham.
| Sekuriti | Saham (MM) |
Nilai (MM$) |
Portfolio % | ΔPortfolio % |
|---|---|---|---|---|
| 0.01 | 4.88 | 2.6183 | 0.5751 | |
| 0.02 | 6.20 | 3.3279 | 0.3582 | |
| 0.02 | 7.12 | 3.8186 | 0.3549 | |
| 0.01 | 1.67 | 0.8959 | 0.2761 | |
| 0.01 | 2.56 | 1.3750 | 0.2691 | |
| 0.01 | 3.82 | 2.0488 | 0.2651 | |
| 0.02 | 4.38 | 2.3490 | 0.2359 | |
| 0.00 | 2.67 | 1.4334 | 0.2302 | |
| 0.00 | 0.90 | 0.4814 | 0.1960 | |
| 0.00 | 0.28 | 0.1510 | 0.1510 |
Penurunan Teratas Suku Tahun Ini
Kami menggunakan perubahan dalam peruntukan portfolio kerana ini adalah metrik yang paling bermakna. Perubahan boleh disebabkan oleh perdagangan atau perubahan dalam harga saham.
| Sekuriti | Saham (MM) |
Nilai (MM$) |
Portfolio % | ΔPortfolio % |
|---|---|---|---|---|
| 0.02 | 2.79 | 1.4983 | -0.4287 | |
| 0.01 | 3.01 | 1.6151 | -0.3932 | |
| 0.02 | 4.83 | 2.5901 | -0.3557 | |
| 0.02 | 3.39 | 1.8204 | -0.3410 | |
| 0.03 | 4.42 | 2.3698 | -0.3341 | |
| 0.02 | 1.98 | 1.0630 | -0.2519 | |
| 0.01 | 2.59 | 1.3908 | -0.2231 | |
| 0.03 | 4.45 | 2.3900 | -0.2224 | |
| 0.02 | 1.55 | 0.8308 | -0.2132 | |
| 0.01 | 4.24 | 2.2744 | -0.2034 |
13F dan Pemfailan Dana
Borang ini telah difailkan pada 2025-07-29 untuk tempoh pelaporan 2025-06-30. Klik ikon pautan untuk melihat sejarah transaksi penuh.
Tingkatkan untuk membuka data premium dan eksport ke Excel ![]() .
.
| Sekuriti | Jenis | Purata Harga Saham | Saham (MM) |
ΔSaham (%) |
ΔSaham (%) |
Nilai ($MM) |
Portfolio (%) |
ΔPortfolio (%) |
|
|---|---|---|---|---|---|---|---|---|---|
| LLY / Eli Lilly and Company | 0.01 | -3.58 | 7.57 | -9.00 | 4.0598 | -0.0759 | |||
| CAT / Caterpillar Inc. | 0.02 | -13.17 | 7.12 | 2.21 | 3.8186 | 0.3549 | |||
| SO / The Southern Company | 0.08 | -3.89 | 7.09 | -4.02 | 3.8054 | 0.1299 | |||
| DE / Deere & Company | 0.01 | -11.27 | 6.67 | -3.88 | 3.5780 | 0.1273 | |||
| CME / CME Group Inc. | 0.02 | 0.00 | 6.20 | 3.89 | 3.3279 | 0.3582 | |||
| MSFT / Microsoft Corporation | 0.01 | -10.34 | 4.88 | 18.82 | 2.6183 | 0.5751 | |||
| ADP / Automatic Data Processing, Inc. | 0.02 | -19.24 | 4.83 | -18.49 | 2.5901 | -0.3557 | |||
| DUK / Duke Energy Corporation | 0.04 | -9.69 | 4.57 | -12.64 | 2.4545 | -0.1499 | |||
| CSX / CSX Corporation | 0.14 | -11.84 | 4.56 | -2.25 | 2.4469 | 0.1260 | |||
| JNJ / Johnson & Johnson | 0.03 | -7.91 | 4.45 | -15.19 | 2.3900 | -0.2224 | |||
| PG / The Procter & Gamble Company | 0.03 | -13.08 | 4.42 | -18.75 | 2.3698 | -0.3341 | |||
| CBOE / Cboe Global Markets, Inc. | 0.02 | 0.00 | 4.38 | 3.06 | 2.3490 | 0.2359 | |||
| XOM / Exxon Mobil Corporation | 0.04 | -2.34 | 4.28 | -11.49 | 2.2950 | -0.1086 | |||
| HD / The Home Depot, Inc. | 0.01 | -14.94 | 4.24 | -14.90 | 2.2744 | -0.2034 | |||
| NEE / NextEra Energy, Inc. | 0.06 | -0.94 | 3.92 | -2.99 | 2.1048 | 0.0933 | |||
| JPM / JPMorgan Chase & Co. | 0.01 | -9.90 | 3.82 | 6.47 | 2.0488 | 0.2651 | |||
| CVX / Chevron Corporation | 0.02 | -8.78 | 3.39 | -21.93 | 1.8204 | -0.3410 | |||
| CMI / Cummins Inc. | 0.01 | -18.21 | 3.24 | -14.55 | 1.7402 | -0.1476 | |||
| WM / Waste Management, Inc. | 0.01 | -14.59 | 3.13 | -15.58 | 1.6774 | -0.1648 | |||
| T / AT&T Inc. | 0.10 | -8.62 | 3.02 | -6.50 | 1.6221 | 0.0140 | |||
| BRK.B / Berkshire Hathaway Inc. | 0.01 | -18.26 | 3.01 | -25.44 | 1.6151 | -0.3932 | |||
| ABBV / AbbVie Inc. | 0.02 | -18.63 | 2.79 | -27.93 | 1.4983 | -0.4287 | |||
| BAC / Bank of America Corporation | 0.06 | -9.48 | 2.73 | 2.63 | 1.4635 | 0.1417 | |||
| SPY / SPDR S&P 500 ETF | 0.00 | 0.00 | 2.67 | 10.46 | 1.4334 | 0.2302 | |||
| AMGN / Amgen Inc. | 0.01 | -10.85 | 2.59 | -20.10 | 1.3908 | -0.2231 | |||
| ETN / Eaton Corporation plc | 0.01 | -12.23 | 2.56 | 15.25 | 1.3750 | 0.2691 | |||
| IBM / International Business Machines Corporation | 0.01 | -16.68 | 2.56 | -1.23 | 1.3742 | 0.0843 | |||
| VZ / Verizon Communications Inc. | 0.05 | -2.13 | 2.32 | -6.63 | 1.2465 | 0.0087 | |||
| RTX / RTX Corporation | 0.01 | -16.71 | 2.13 | -8.19 | 1.1425 | -0.0111 | |||
| ITW / Illinois Tool Works Inc. | 0.01 | -3.08 | 2.07 | -3.41 | 1.1106 | 0.0450 | |||
| PEP / PepsiCo, Inc. | 0.02 | -14.89 | 1.98 | -25.05 | 1.0630 | -0.2519 | |||
| EMR / Emerson Electric Co. | 0.01 | -12.92 | 1.98 | 5.89 | 1.0603 | 0.1320 | |||
| UNP / Union Pacific Corporation | 0.01 | -7.74 | 1.92 | -10.16 | 1.0294 | -0.0328 | |||
| CL / Colgate-Palmolive Company | 0.02 | -12.27 | 1.83 | -14.88 | 0.9827 | -0.0877 | |||
| RF / Regions Financial Corporation | 0.08 | -9.48 | 1.83 | -2.04 | 0.9806 | 0.0527 | |||
| KO / The Coca-Cola Company | 0.03 | -2.01 | 1.78 | -3.16 | 0.9540 | 0.0403 | |||
| STX / Seagate Technology Holdings plc | 0.01 | -21.13 | 1.67 | 33.95 | 0.8959 | 0.2761 | |||
| DIA / SPDR Dow Jones Industrial Average ETF Trust | 0.00 | 0.00 | 1.61 | 4.94 | 0.8665 | 0.1010 | |||
| RY / Royal Bank of Canada | 0.01 | -16.84 | 1.56 | -2.99 | 0.8363 | 0.0374 | |||
| GLW / Corning Incorporated | 0.03 | -12.95 | 1.56 | 0.00 | 0.8343 | 0.0608 | |||
| COP / ConocoPhillips | 0.02 | -13.66 | 1.55 | -26.22 | 0.8308 | -0.2132 | |||
| ET / Energy Transfer LP - Limited Partnership | 0.08 | -21.48 | 1.52 | -23.42 | 0.8177 | -0.1723 | |||
| LMT / Lockheed Martin Corporation | 0.00 | -0.94 | 1.46 | 2.67 | 0.7837 | 0.0762 | |||
| ABT / Abbott Laboratories | 0.01 | -25.10 | 1.43 | -23.20 | 0.7691 | -0.1594 | |||
| BA / The Boeing Company | 0.01 | -16.60 | 1.37 | 2.47 | 0.7341 | 0.0698 | |||
| MRK / Merck & Co., Inc. | 0.02 | -4.13 | 1.32 | -15.47 | 0.7097 | -0.0685 | |||
| LOW / Lowe's Companies, Inc. | 0.01 | -5.61 | 1.31 | -10.25 | 0.7005 | -0.0228 | |||
| MCD / McDonald's Corporation | 0.00 | -0.80 | 1.30 | -7.21 | 0.6979 | 0.0007 | |||
| SCHX / Schwab Strategic Trust - Schwab U.S. Large-Cap ETF | 0.05 | -2.54 | 1.30 | 7.91 | 0.6954 | 0.0977 | |||
| NFG / National Fuel Gas Company | 0.01 | -12.53 | 1.26 | -6.47 | 0.6748 | 0.0062 | |||
| AAPL / Apple Inc. | 0.01 | -6.59 | 1.16 | -13.75 | 0.6227 | -0.0464 | |||
| EPD / Enterprise Products Partners L.P. - Limited Partnership | 0.03 | 0.00 | 1.02 | -9.14 | 0.5496 | -0.0114 | |||
| UPS / United Parcel Service, Inc. | 0.01 | -13.08 | 1.02 | -20.22 | 0.5486 | -0.0890 | |||
| PFE / Pfizer Inc. | 0.04 | -13.16 | 0.98 | -16.87 | 0.5237 | -0.0607 | |||
| FUN / Six Flags Entertainment Corporation | 0.03 | -20.49 | 0.94 | -32.18 | 0.5069 | -0.1859 | |||
| WMT / Walmart Inc. | 0.01 | -0.04 | 0.93 | 11.30 | 0.4972 | 0.0832 | |||
| CEG / Constellation Energy Corporation | 0.00 | -2.32 | 0.90 | 56.54 | 0.4814 | 0.1960 | |||
| QCOM / QUALCOMM Incorporated | 0.01 | 10.98 | 0.89 | 15.08 | 0.4751 | 0.0923 | |||
| CM / Canadian Imperial Bank of Commerce | 0.01 | 11.54 | 0.82 | 40.34 | 0.4408 | 0.1496 | |||
| NSC / Norfolk Southern Corporation | 0.00 | 0.00 | 0.82 | 8.03 | 0.4407 | 0.0626 | |||
| KMI / Kinder Morgan, Inc. | 0.03 | 0.00 | 0.77 | 3.07 | 0.4145 | 0.0416 | |||
| SHEL / Shell plc - Depositary Receipt (Common Stock) | 0.01 | 0.00 | 0.76 | -3.91 | 0.4090 | 0.0144 | |||
| ENB / Enbridge Inc. | 0.02 | -6.09 | 0.70 | -3.96 | 0.3780 | 0.0131 | |||
| TTE / TotalEnergies SE - Depositary Receipt (Common Stock) | 0.01 | 0.00 | 0.65 | -5.12 | 0.3480 | 0.0080 | |||
| DIS / The Walt Disney Company | 0.01 | -26.21 | 0.63 | -7.24 | 0.3372 | 0.0000 | |||
| MDLZ / Mondelez International, Inc. | 0.01 | -14.98 | 0.61 | -15.47 | 0.3286 | -0.0319 | |||
| GE / General Electric Company | 0.00 | 0.00 | 0.61 | 28.60 | 0.3259 | 0.0910 | |||
| TGT / Target Corporation | 0.01 | -11.56 | 0.60 | -16.37 | 0.3238 | -0.0353 | |||
| DKS / DICK'S Sporting Goods, Inc. | 0.00 | 0.00 | 0.57 | -1.89 | 0.3072 | 0.0170 | |||
| OKE / ONEOK, Inc. | 0.01 | -2.81 | 0.56 | -20.11 | 0.3029 | -0.0483 | |||
| TFC / Truist Financial Corporation | 0.01 | -1.60 | 0.53 | 2.91 | 0.2845 | 0.0279 | |||
| WFC / Wells Fargo & Company | 0.01 | -2.98 | 0.52 | 8.30 | 0.2802 | 0.0403 | |||
| NVDA / NVIDIA Corporation | 0.00 | -2.96 | 0.52 | 41.53 | 0.2782 | 0.0959 | |||
| PSX / Phillips 66 | 0.00 | -15.56 | 0.51 | -18.37 | 0.2744 | -0.0374 | |||
| EG / Everest Group, Ltd. | 0.00 | 0.00 | 0.51 | -6.43 | 0.2735 | 0.0024 | |||
| BMY / Bristol-Myers Squibb Company | 0.01 | -5.29 | 0.50 | -28.08 | 0.2667 | -0.0773 | |||
| AEP / American Electric Power Company, Inc. | 0.00 | 3.94 | 0.49 | -1.20 | 0.2647 | 0.0160 | |||
| SCHB / Schwab Strategic Trust - Schwab U.S. Broad Market ETF | 0.02 | -1.12 | 0.47 | 9.65 | 0.2501 | 0.0382 | |||
| ADM / Archer-Daniels-Midland Company | 0.01 | -24.84 | 0.46 | -17.27 | 0.2442 | -0.0298 | |||
| CARR / Carrier Global Corporation | 0.01 | -29.60 | 0.45 | -18.71 | 0.2428 | -0.0342 | |||
| F / Ford Motor Company | 0.04 | 0.00 | 0.44 | 8.15 | 0.2352 | 0.0336 | |||
| NVS / Novartis AG - Depositary Receipt (Common Stock) | 0.00 | 0.00 | 0.44 | 8.68 | 0.2351 | 0.0343 | |||
| VTI / Vanguard Index Funds - Vanguard Total Stock Market ETF | 0.00 | -12.86 | 0.41 | -3.75 | 0.2210 | 0.0084 | |||
| GIS / General Mills, Inc. | 0.01 | -2.50 | 0.40 | -15.51 | 0.2166 | -0.0211 | |||
| CAG / Conagra Brands, Inc. | 0.02 | -18.19 | 0.40 | -37.17 | 0.2141 | -0.1020 | |||
| PM / Philip Morris International Inc. | 0.00 | 0.00 | 0.39 | 14.58 | 0.2114 | 0.0406 | |||
| MMM / 3M Company | 0.00 | -2.83 | 0.39 | 0.77 | 0.2101 | 0.0167 | |||
| BP / BP p.l.c. - Depositary Receipt (Common Stock) | 0.01 | 0.00 | 0.39 | -11.42 | 0.2084 | -0.0097 | |||
| PPG / PPG Industries, Inc. | 0.00 | 0.00 | 0.39 | 4.05 | 0.2069 | 0.0225 | |||
| EXC / Exelon Corporation | 0.01 | -4.12 | 0.38 | -9.57 | 0.2029 | -0.0053 | |||
| AMZN / Amazon.com, Inc. | 0.00 | -3.71 | 0.36 | 10.84 | 0.1925 | 0.0318 | |||
| WFC.PRL / Wells Fargo & Company - Preferred Stock | 0.00 | 0.00 | 0.36 | -2.20 | 0.1909 | 0.0099 | |||
| XLF / The Select Sector SPDR Trust - The Financial Select Sector SPDR Fund | 0.01 | 0.00 | 0.35 | 5.09 | 0.1885 | 0.0223 | |||
| GD / General Dynamics Corporation | 0.00 | -5.87 | 0.35 | 0.57 | 0.1881 | 0.0150 | |||
| JPST / J.P. Morgan Exchange-Traded Fund Trust - JPMorgan Ultra-Short Income ETF | 0.01 | -2.91 | 0.34 | -2.87 | 0.1817 | 0.0084 | |||
| QQQ / Invesco QQQ Trust, Series 1 | 0.00 | -21.13 | 0.31 | -7.23 | 0.1657 | 0.0001 | |||
| MPC / Marathon Petroleum Corporation | 0.00 | -46.04 | 0.29 | -38.40 | 0.1567 | -0.0794 | |||
| OTIS / Otis Worldwide Corporation | 0.00 | -31.77 | 0.28 | -34.65 | 0.1511 | -0.0629 | |||
| GEV / GE Vernova Inc. | 0.00 | 0.28 | 0.1510 | 0.1510 | |||||
| ARLP / Alliance Resource Partners, L.P. - Limited Partnership | 0.01 | 0.00 | 0.28 | -4.12 | 0.1501 | 0.0049 | |||
| VB / Vanguard Index Funds - Vanguard Small-Cap ETF | 0.00 | 0.00 | 0.28 | 6.56 | 0.1485 | 0.0197 | |||
| CSCO / Cisco Systems, Inc. | 0.00 | 22.30 | 0.28 | 37.50 | 0.1480 | 0.0482 | |||
| DD / DuPont de Nemours, Inc. | 0.00 | -11.14 | 0.27 | -18.48 | 0.1447 | -0.0197 | |||
| O / Realty Income Corporation | 0.00 | 0.00 | 0.27 | -0.74 | 0.1440 | 0.0096 | |||
| TEL / TE Connectivity plc | 0.00 | -27.75 | 0.26 | -13.77 | 0.1414 | -0.0106 | |||
| BAC.PRL / Bank of America Corporation - Preferred Stock | 0.00 | 0.00 | 0.25 | -1.93 | 0.1367 | 0.0077 | |||
| CI / The Cigna Group | 0.00 | 0.00 | 0.25 | 0.40 | 0.1366 | 0.0106 | |||
| PRA / ProAssurance Corporation | 0.01 | 0.00 | 0.25 | -2.33 | 0.1349 | 0.0070 | |||
| PLD / Prologis, Inc. | 0.00 | -28.57 | 0.25 | -32.88 | 0.1339 | -0.0509 | |||
| BR / Broadridge Financial Solutions, Inc. | 0.00 | 0.00 | 0.25 | 0.40 | 0.1338 | 0.0100 | |||
| GSK / GSK plc - Depositary Receipt (Common Stock) | 0.01 | -2.41 | 0.25 | -3.11 | 0.1337 | 0.0056 | |||
| IVV / iShares Trust - iShares Core S&P 500 ETF | 0.00 | 0.00 | 0.25 | 10.71 | 0.1332 | 0.0215 | |||
| CTVA / Corteva, Inc. | 0.00 | -13.53 | 0.23 | 2.18 | 0.1260 | 0.0119 | |||
| KMB / Kimberly-Clark Corporation | 0.00 | 0.23 | 0.1210 | 0.1210 | |||||
| LW / Lamb Weston Holdings, Inc. | 0.00 | -19.07 | 0.22 | -21.15 | 0.1180 | -0.0210 | |||
| HPQ / HP Inc. | 0.01 | -23.14 | 0.22 | -32.20 | 0.1177 | -0.0430 | |||
| SCHO / Schwab Strategic Trust - Schwab Short-Term U.S. Treasury ETF | 0.01 | -5.12 | 0.22 | -5.26 | 0.1163 | 0.0028 | |||
| XLE / The Select Sector SPDR Trust - The Energy Select Sector SPDR Fund | 0.00 | -13.54 | 0.22 | -21.74 | 0.1163 | -0.0211 | |||
| IP / International Paper Company | 0.00 | 0.00 | 0.21 | -12.08 | 0.1133 | -0.0064 | |||
| VIG / Vanguard Specialized Funds - Vanguard Dividend Appreciation ETF | 0.00 | 0.21 | 0.1131 | 0.1131 | |||||
| IJH / iShares Trust - iShares Core S&P Mid-Cap ETF | 0.00 | 0.21 | 0.1123 | 0.1123 | |||||
| K / Kellanova | 0.00 | -27.56 | 0.21 | -30.10 | 0.1122 | -0.0367 | |||
| MCO / Moody's Corporation | 0.00 | 0.20 | 0.1076 | 0.1076 | |||||
| PNC / The PNC Financial Services Group, Inc. | 0.00 | -100.00 | 0.00 | 0.0000 | |||||
| BDX / Becton, Dickinson and Company | 0.00 | -100.00 | 0.00 | 0.0000 | |||||
| FANG / Diamondback Energy, Inc. | 0.00 | -100.00 | 0.00 | 0.0000 | |||||
| BK / The Bank of New York Mellon Corporation | 0.00 | -100.00 | 0.00 | 0.0000 |