Statistik Asas
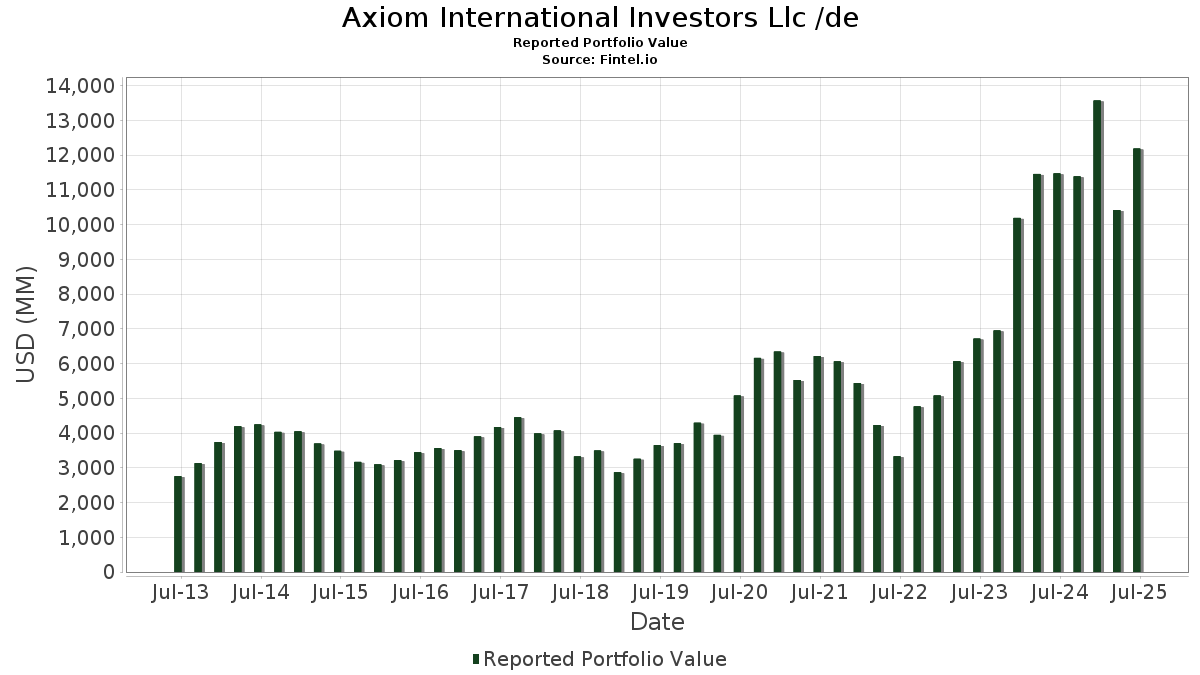
| Nilai Portfolio | $ 12,188,716,525 |
| Kedudukan Semasa | 138 |
Pegangan Terkini, Prestasi, AUM (dari 13F, 13D)
Axiom International Investors Llc /de telah mendedahkan 138 jumlah pegangan dalam pemfailan SEC terkini mereka. Nilai portfolio terkini dikira sebagai $ 12,188,716,525 USD. Aset Sebenar Di Bawah Pengurusan (AUM) ialah nilai ini ditambah dengan tunai (yang tidak didedahkan). Pegangan teratas Axiom International Investors Llc /de ialah Microsoft Corporation (US:MSFT) , NVIDIA Corporation (US:NVDA) , Netflix, Inc. (US:NFLX) , Amazon.com, Inc. (US:AMZN) , and Meta Platforms, Inc. (US:META) . Kedudukan baharu Axiom International Investors Llc /de termasuk Argan, Inc. (US:AGX) , Mirion Technologies, Inc. (US:MIR) , Robinhood Markets, Inc. (US:HOOD) , Rhythm Pharmaceuticals, Inc. (US:RYTM) , and HEICO Corporation (US:HEI) .
Kenaikan Teratas Suku Tahun Ini
Kami menggunakan perubahan dalam peruntukan portfolio kerana ini adalah metrik yang paling bermakna. Perubahan boleh disebabkan oleh perdagangan atau perubahan dalam harga saham.
| Sekuriti | Saham (MM) |
Nilai (MM$) |
Portfolio % | ΔPortfolio % |
|---|---|---|---|---|
| 2.39 | 1,187.57 | 9.7432 | 5.2705 | |
| 6.16 | 973.91 | 7.9902 | 5.0525 | |
| 1.53 | 279.10 | 2.2898 | 2.2898 | |
| 0.72 | 964.99 | 7.9171 | 1.7309 | |
| 0.57 | 301.80 | 2.4761 | 1.7264 | |
| 4.14 | 907.45 | 7.4450 | 1.6895 | |
| 0.84 | 642.72 | 5.2730 | 1.4736 | |
| 0.93 | 239.11 | 1.9617 | 1.0252 | |
| 0.84 | 103.39 | 0.8482 | 0.7947 | |
| 0.30 | 83.21 | 0.6827 | 0.6827 |
Penurunan Teratas Suku Tahun Ini
Kami menggunakan perubahan dalam peruntukan portfolio kerana ini adalah metrik yang paling bermakna. Perubahan boleh disebabkan oleh perdagangan atau perubahan dalam harga saham.
| Sekuriti | Saham (MM) |
Nilai (MM$) |
Portfolio % | ΔPortfolio % |
|---|---|---|---|---|
| 0.20 | 63.30 | 0.5194 | -2.0694 | |
| 3.32 | 356.45 | 2.9244 | -1.6838 | |
| 0.97 | 198.57 | 1.6292 | -1.6389 | |
| 0.52 | 77.10 | 0.6325 | -1.6081 | |
| 1.26 | 143.13 | 1.1743 | -1.4836 | |
| 0.34 | 19.48 | 0.1598 | -1.4474 | |
| 0.24 | 63.08 | 0.5175 | -1.3499 | |
| 0.61 | 215.50 | 1.7680 | -1.1764 | |
| 0.65 | 36.45 | 0.2990 | -1.1071 | |
| 0.00 | 0.00 | -1.1046 |
13F dan Pemfailan Dana
Borang ini telah difailkan pada 2025-08-07 untuk tempoh pelaporan 2025-06-30. Klik ikon pautan untuk melihat sejarah transaksi penuh.
Tingkatkan untuk membuka data premium dan eksport ke Excel ![]() .
.
| Sekuriti | Jenis | Purata Harga Saham | Saham (MM) |
ΔSaham (%) |
ΔSaham (%) |
Nilai ($MM) |
Portfolio (%) |
ΔPortfolio (%) |
|
|---|---|---|---|---|---|---|---|---|---|
| MSFT / Microsoft Corporation | 2.39 | 92.33 | 1,187.57 | 154.85 | 9.7432 | 5.2705 | |||
| NVDA / NVIDIA Corporation | 6.16 | 118.28 | 973.91 | 218.20 | 7.9902 | 5.0525 | |||
| NFLX / Netflix, Inc. | 0.72 | 4.26 | 964.99 | 49.72 | 7.9171 | 1.7309 | |||
| AMZN / Amazon.com, Inc. | 4.14 | 31.24 | 907.45 | 51.33 | 7.4450 | 1.6895 | |||
| META / Meta Platforms, Inc. | 1.04 | -20.33 | 765.81 | 2.03 | 6.2829 | -0.9215 | |||
| SPOT / Spotify Technology S.A. | 0.84 | 16.38 | 642.72 | 62.37 | 5.2730 | 1.4736 | |||
| JPM / JPMorgan Chase & Co. | 1.67 | -3.13 | 482.77 | 14.48 | 3.9608 | -0.0868 | |||
| MS / Morgan Stanley | 3.26 | 4.73 | 459.10 | 26.45 | 3.7666 | 0.2817 | |||
| BSX / Boston Scientific Corporation | 3.32 | -30.27 | 356.45 | -25.76 | 2.9244 | -1.6838 | |||
| NOW / ServiceNow, Inc. | 0.33 | 19.98 | 334.90 | 54.94 | 2.7476 | 0.6729 | |||
| IBN / ICICI Bank Limited - Depositary Receipt (Common Stock) | 9.65 | 20.14 | 324.66 | 28.22 | 2.6636 | 0.2333 | |||
| GEV / GE Vernova Inc. | 0.57 | 122.93 | 301.80 | 286.40 | 2.4761 | 1.7264 | |||
| PM / Philip Morris International Inc. | 1.53 | 279.10 | 2.2898 | 2.2898 | |||||
| TW / Tradeweb Markets Inc. | 1.89 | -2.51 | 277.27 | -3.86 | 2.2748 | -0.4933 | |||
| GE / General Electric Company | 0.93 | 90.56 | 239.11 | 145.06 | 1.9617 | 1.0252 | |||
| MELI / MercadoLibre, Inc. | 0.09 | 27.75 | 233.11 | 71.15 | 1.9125 | 0.6052 | |||
| V / Visa Inc. | 0.61 | -30.66 | 215.50 | -29.75 | 1.7680 | -1.1764 | |||
| COST / Costco Wholesale Corporation | 0.21 | -28.89 | 211.63 | -25.57 | 1.7362 | -0.9929 | |||
| TSM / Taiwan Semiconductor Manufacturing Company Limited - Depositary Receipt (Common Stock) | 0.91 | -15.92 | 205.28 | 14.72 | 1.6842 | -0.0333 | |||
| AAPL / Apple Inc. | 0.97 | -36.86 | 198.57 | -41.68 | 1.6292 | -1.6389 | |||
| CTAS / Cintas Corporation | 0.85 | -19.79 | 189.29 | -13.02 | 1.5530 | -0.5358 | |||
| BABA / Alibaba Group Holding Limited - Depositary Receipt (Common Stock) | 1.26 | -39.74 | 143.13 | -48.31 | 1.1743 | -1.4836 | |||
| AXON / Axon Enterprise, Inc. | 0.16 | -7.20 | 135.98 | 46.08 | 1.1156 | 0.2221 | |||
| GOOGL / Alphabet Inc. | 0.73 | -42.65 | 128.32 | -34.65 | 1.0527 | -0.8318 | |||
| SE / Sea Limited - Depositary Receipt (Common Stock) | 0.80 | 37.10 | 127.57 | 68.04 | 1.0466 | 0.3179 | |||
| UBER / Uber Technologies, Inc. | 1.12 | -7.74 | 104.86 | 18.15 | 0.8603 | 0.0084 | |||
| TJX / The TJX Companies, Inc. | 0.84 | 1,727.88 | 103.39 | 1,753.46 | 0.8482 | 0.7947 | |||
| SHOP / Shopify Inc. | 0.75 | 110.95 | 86.48 | 154.85 | 0.7095 | 0.3838 | |||
| AVGO / Broadcom Inc. | 0.30 | 83.21 | 0.6827 | 0.6827 | |||||
| EQIX / Equinix, Inc. | 0.10 | -7.93 | 81.86 | -10.17 | 0.6716 | -0.2031 | |||
| CHKP / Check Point Software Technologies Ltd. | 0.37 | 23.45 | 81.50 | 19.84 | 0.6687 | 0.0159 | |||
| LYV / Live Nation Entertainment, Inc. | 0.52 | -7.93 | 79.04 | 6.67 | 0.6484 | -0.0627 | |||
| ISRG / Intuitive Surgical, Inc. | 0.14 | -7.75 | 77.49 | 1.21 | 0.6357 | -0.0991 | |||
| BX / Blackstone Inc. | 0.52 | -69.14 | 77.10 | -66.97 | 0.6325 | -1.6081 | |||
| GGAL / Grupo Financiero Galicia S.A. - Depositary Receipt (Common Stock) | 1.44 | -1.58 | 72.70 | -8.96 | 0.5964 | -0.1700 | |||
| IEFA / iShares Trust - iShares Core MSCI EAFE ETF | 0.86 | 13.58 | 71.58 | 25.33 | 0.5873 | 0.0391 | |||
| AJG / Arthur J. Gallagher & Co. | 0.20 | -74.69 | 63.30 | -76.53 | 0.5194 | -2.0694 | |||
| PGR / The Progressive Corporation | 0.24 | -65.61 | 63.08 | -67.58 | 0.5175 | -1.3499 | |||
| PLD / Prologis, Inc. | 0.57 | -7.97 | 60.19 | -13.46 | 0.4938 | -0.1737 | |||
| CMG / Chipotle Mexican Grill, Inc. | 0.65 | -77.75 | 36.45 | -75.12 | 0.2990 | -1.1071 | |||
| MMYT / MakeMyTrip Limited | 0.36 | -52.96 | 35.59 | -52.95 | 0.2920 | -0.4340 | |||
| INDA / iShares Trust - iShares MSCI India ETF | 0.52 | -5.41 | 29.10 | 2.31 | 0.2388 | -0.0343 | |||
| ERJ / Embraer S.A. - Depositary Receipt (Common Stock) | 0.44 | -40.00 | 24.95 | -26.09 | 0.2047 | -0.1193 | |||
| BRBR / BellRing Brands, Inc. | 0.34 | -85.05 | 19.48 | -88.37 | 0.1598 | -1.4474 | |||
| GRAB / Grab Holdings Limited | 3.68 | 34.71 | 18.51 | 49.58 | 0.1519 | 0.0331 | |||
| TSLA / Tesla, Inc. | 0.06 | -8.27 | 18.03 | 12.44 | 0.1479 | -0.0060 | |||
| ENSG / The Ensign Group, Inc. | 0.11 | 5.27 | 16.71 | 25.50 | 0.1371 | 0.0093 | |||
| VIST / Vista Energy, S.A.B. de C.V. - Depositary Receipt (Common Stock) | 0.33 | -20.32 | 15.60 | -18.18 | 0.1280 | -0.0550 | |||
| CR / Crane Company | 0.08 | -4.29 | 15.51 | 18.64 | 0.1272 | 0.0018 | |||
| CPNG / Coupang, Inc. | 0.51 | 15.27 | 0.1253 | 0.1253 | |||||
| SCCO / Southern Copper Corporation | 0.15 | -13.70 | 15.07 | -6.58 | 0.1237 | -0.0312 | |||
| RBC / RBC Bearings Incorporated | 0.04 | -3.41 | 14.93 | 15.51 | 0.1225 | -0.0016 | |||
| CASY / Casey's General Stores, Inc. | 0.03 | 41.25 | 14.60 | 66.06 | 0.1198 | 0.0354 | |||
| FSS / Federal Signal Corporation | 0.14 | 5.48 | 14.53 | 52.63 | 0.1192 | 0.0278 | |||
| CWST / Casella Waste Systems, Inc. | 0.12 | 2.36 | 14.35 | 5.91 | 0.1177 | -0.0123 | |||
| MMSI / Merit Medical Systems, Inc. | 0.15 | 4.16 | 13.99 | -7.89 | 0.1148 | -0.0310 | |||
| CLS / Celestica Inc. | 0.08 | -25.17 | 13.17 | 48.23 | 0.1080 | 0.0228 | |||
| CRDO / Credo Technology Group Holding Ltd | 0.14 | 68.38 | 13.15 | 288.31 | 0.1079 | 0.0754 | |||
| HQY / HealthEquity, Inc. | 0.12 | 32.69 | 13.02 | 57.30 | 0.1068 | 0.0274 | |||
| FFIN / First Financial Bankshares, Inc. | 0.36 | 6.27 | 13.02 | 6.45 | 0.1068 | -0.0106 | |||
| BEKE / KE Holdings Inc. - Depositary Receipt (Common Stock) | 0.72 | -43.26 | 12.80 | -49.90 | 0.1050 | -0.1402 | |||
| QTWO / Q2 Holdings, Inc. | 0.13 | 14.61 | 12.13 | 34.07 | 0.0995 | 0.0127 | |||
| VSEC / VSE Corporation | 0.09 | 23.46 | 12.02 | 34.77 | 0.0986 | 0.0130 | |||
| STRL / Sterling Infrastructure, Inc. | 0.05 | 59.95 | 12.00 | 226.00 | 0.0985 | 0.0631 | |||
| MC / Moelis & Company | 0.19 | 28.77 | 11.89 | 37.52 | 0.0975 | 0.0146 | |||
| SF / Stifel Financial Corp. | 0.11 | -22.47 | 11.32 | -14.65 | 0.0929 | -0.0344 | |||
| SXT / Sensient Technologies Corporation | 0.10 | 9.98 | 0.0819 | 0.0819 | |||||
| NVMI / Nova Ltd. | 0.04 | 34.83 | 9.91 | 101.32 | 0.0813 | 0.0341 | |||
| SPXC / SPX Technologies, Inc. | 0.06 | 38.13 | 9.82 | 79.86 | 0.0806 | 0.0282 | |||
| PIPR / Piper Sandler Companies | 0.03 | -6.63 | 9.29 | 4.79 | 0.0762 | -0.0089 | |||
| BOOT / Boot Barn Holdings, Inc. | 0.06 | 9.28 | 0.0761 | 0.0761 | |||||
| EAT / Brinker International, Inc. | 0.05 | -5.15 | 9.27 | 14.76 | 0.0761 | -0.0015 | |||
| AGX / Argan, Inc. | 0.04 | 9.12 | 0.0748 | 0.0748 | |||||
| BMI / Badger Meter, Inc. | 0.04 | -15.98 | 8.80 | 8.18 | 0.0722 | -0.0059 | |||
| VRNS / Varonis Systems, Inc. | 0.17 | 58.23 | 8.63 | 98.50 | 0.0708 | 0.0291 | |||
| CVLT / Commvault Systems, Inc. | 0.05 | -4.60 | 8.61 | 5.42 | 0.0706 | -0.0078 | |||
| MIR / Mirion Technologies, Inc. | 0.39 | 8.45 | 0.0694 | 0.0694 | |||||
| OSIS / OSI Systems, Inc. | 0.04 | -1.76 | 8.45 | 13.67 | 0.0693 | -0.0020 | |||
| NU / Nu Holdings Ltd. | 0.59 | -17.54 | 8.15 | 10.48 | 0.0669 | -0.0039 | |||
| KOF / Coca-Cola FEMSA, S.A.B. de C.V. - Depositary Receipt (Common Stock) | 0.08 | 8.08 | 0.0663 | 0.0663 | |||||
| IEMG / iShares, Inc. - iShares Core MSCI Emerging Markets ETF | 0.13 | 5.51 | 8.05 | 17.36 | 0.0660 | 0.0002 | |||
| OLLI / Ollie's Bargain Outlet Holdings, Inc. | 0.06 | 47.75 | 7.95 | 67.33 | 0.0652 | 0.0196 | |||
| MRCY / Mercury Systems, Inc. | 0.14 | 110.14 | 7.65 | 162.72 | 0.0628 | 0.0348 | |||
| ITGR / Integer Holdings Corporation | 0.06 | 64.75 | 7.65 | 71.68 | 0.0628 | 0.0200 | |||
| ALKT / Alkami Technology, Inc. | 0.25 | 5.79 | 7.58 | 21.46 | 0.0622 | 0.0023 | |||
| OPCH / Option Care Health, Inc. | 0.23 | -35.96 | 7.52 | -40.49 | 0.0617 | -0.0596 | |||
| BAP / Credicorp Ltd. | 0.03 | -3.42 | 7.11 | 15.96 | 0.0584 | -0.0005 | |||
| KEX / Kirby Corporation | 0.06 | 20.18 | 7.08 | 34.95 | 0.0581 | 0.0077 | |||
| MWA / Mueller Water Products, Inc. | 0.28 | -32.43 | 6.80 | -36.10 | 0.0558 | -0.0464 | |||
| HDB / HDFC Bank Limited - Depositary Receipt (Common Stock) | 0.09 | 197.94 | 6.65 | 243.87 | 0.0545 | 0.0360 | |||
| MTDR / Matador Resources Company | 0.14 | -9.93 | 6.61 | -15.88 | 0.0542 | -0.0212 | |||
| PLMR / Palomar Holdings, Inc. | 0.04 | 77.87 | 6.51 | 100.18 | 0.0534 | 0.0222 | |||
| RDNT / RadNet, Inc. | 0.11 | -2.49 | 6.23 | 11.60 | 0.0511 | -0.0025 | |||
| INSM / Insmed Incorporated | 0.06 | -24.00 | 6.11 | 0.25 | 0.0502 | -0.0084 | |||
| AMP / Ameriprise Financial, Inc. | 0.01 | -95.78 | 5.54 | -95.35 | 0.0455 | -1.0970 | |||
| IWO / iShares Trust - iShares Russell 2000 Growth ETF | 0.02 | -34.74 | 5.32 | -27.00 | 0.0436 | -0.0263 | |||
| EXLS / ExlService Holdings, Inc. | 0.12 | -63.40 | 5.14 | -66.05 | 0.0422 | -0.1032 | |||
| BPMC / Blueprint Medicines Corporation | 0.04 | 13.87 | 5.09 | 64.94 | 0.0417 | 0.0121 | |||
| ORCL / Oracle Corporation | 0.02 | 4.49 | 0.0369 | 0.0369 | |||||
| NTES / NetEase, Inc. - Depositary Receipt (Common Stock) | 0.03 | 4.44 | 0.0364 | 0.0364 | |||||
| SPSC / SPS Commerce, Inc. | 0.03 | -5.84 | 4.39 | -3.45 | 0.0360 | -0.0076 | |||
| HOOD / Robinhood Markets, Inc. | 0.04 | 4.06 | 0.0333 | 0.0333 | |||||
| CWAN / Clearwater Analytics Holdings, Inc. | 0.18 | -63.36 | 3.89 | -70.01 | 0.0319 | -0.0925 | |||
| LNTH / Lantheus Holdings, Inc. | 0.05 | -48.46 | 3.75 | -56.78 | 0.0308 | -0.0525 | |||
| ACVA / ACV Auctions Inc. | 0.21 | 14.50 | 3.44 | 31.84 | 0.0282 | 0.0032 | |||
| SFM / Sprouts Farmers Market, Inc. | 0.02 | -73.60 | 3.33 | -71.53 | 0.0273 | -0.0849 | |||
| RYTM / Rhythm Pharmaceuticals, Inc. | 0.05 | 3.31 | 0.0272 | 0.0272 | |||||
| MOD / Modine Manufacturing Company | 0.03 | -47.14 | 3.19 | -32.16 | 0.0262 | -0.0190 | |||
| HEI / HEICO Corporation | 0.01 | 3.10 | 0.0254 | 0.0254 | |||||
| VERX / Vertex, Inc. | 0.09 | -54.15 | 3.06 | -53.73 | 0.0251 | -0.0383 | |||
| GDYN / Grid Dynamics Holdings, Inc. | 0.26 | 6.47 | 3.05 | -21.44 | 0.0250 | -0.0122 | |||
| WHD / Cactus, Inc. | 0.07 | 4.16 | 3.04 | -0.65 | 0.0249 | -0.0044 | |||
| CCEP / Coca-Cola Europacific Partners PLC | 0.03 | -80.49 | 3.01 | -79.22 | 0.0247 | -0.1144 | |||
| MNDY / monday.com Ltd. | 0.01 | 2.91 | 0.0238 | 0.0238 | |||||
| IONQ / IonQ, Inc. | 0.07 | 2.90 | 0.0238 | 0.0238 | |||||
| PTGX / Protagonist Therapeutics, Inc. | 0.05 | 28.18 | 2.83 | 46.53 | 0.0232 | 0.0047 | |||
| AXSM / Axsome Therapeutics, Inc. | 0.03 | 3.04 | 2.83 | -7.79 | 0.0232 | -0.0062 | |||
| RACE / Ferrari N.V. | 0.00 | -60.13 | 2.29 | -54.27 | 0.0188 | -0.0293 | |||
| INOD / Innodata Inc. | 0.04 | 2.68 | 2.24 | 46.57 | 0.0184 | 0.0037 | |||
| VEEV / Veeva Systems Inc. | 0.01 | 2.15 | 0.0177 | 0.0177 | |||||
| COIN / Coinbase Global, Inc. | 0.01 | 2.02 | 0.0166 | 0.0166 | |||||
| NOVT / Novanta Inc. | 0.01 | -61.74 | 1.87 | -61.44 | 0.0154 | -0.0312 | |||
| CDRE / Cadre Holdings, Inc. | 0.06 | -39.64 | 1.77 | -35.09 | 0.0146 | -0.0117 | |||
| SUPN / Supernus Pharmaceuticals, Inc. | 0.06 | 3.20 | 1.77 | -0.67 | 0.0145 | -0.0026 | |||
| VXUS / Vanguard STAR Funds - Vanguard Total International Stock ETF | 0.02 | -25.62 | 1.64 | -17.26 | 0.0135 | -0.0056 | |||
| JOBY / Joby Aviation, Inc. | 0.15 | 1.62 | 0.0133 | 0.0133 | |||||
| TCOM / Trip.com Group Limited - Depositary Receipt (Common Stock) | 0.03 | -97.20 | 1.56 | -97.41 | 0.0128 | -0.5671 | |||
| IVV / iShares Trust - iShares Core S&P 500 ETF | 0.00 | -3.85 | 1.55 | 6.30 | 0.0127 | -0.0013 | |||
| KSA / iShares Trust - iShares MSCI Saudi Arabia ETF | 0.04 | -14.09 | 1.46 | -20.00 | 0.0120 | -0.0055 | |||
| EWT / iShares, Inc. - iShares MSCI Taiwan ETF | 0.02 | 13.21 | 1.03 | 37.00 | 0.0085 | 0.0012 | |||
| MNST / Monster Beverage Corporation | 0.02 | -13.30 | 1.00 | -7.22 | 0.0082 | -0.0021 | |||
| CYBR / CyberArk Software Ltd. | 0.00 | 1.00 | 0.0082 | 0.0082 | |||||
| FTNT / Fortinet, Inc. | 0.01 | 33.38 | 0.85 | 46.62 | 0.0069 | 0.0014 | |||
| ROL / Rollins, Inc. | 0.01 | 56.19 | 0.78 | 63.26 | 0.0064 | 0.0018 | |||
| CPT / Camden Property Trust | 0.01 | 17.94 | 0.78 | 8.79 | 0.0064 | -0.0005 | |||
| FWONA / Formula One Group | 0.00 | 5.77 | 0.46 | 22.73 | 0.0038 | 0.0002 | |||
| FICO / Fair Isaac Corporation | 0.00 | 0.26 | 0.0021 | 0.0021 | |||||
| TYL / Tyler Technologies, Inc. | 0.00 | 0.00 | 0.19 | 2.16 | 0.0016 | -0.0002 | |||
| PRMB / Primo Brands Corporation | 0.00 | -100.00 | 0.00 | -100.00 | -1.1046 | ||||
| TXRH / Texas Roadhouse, Inc. | 0.00 | -100.00 | 0.00 | -100.00 | -0.3207 |