Statistik Asas
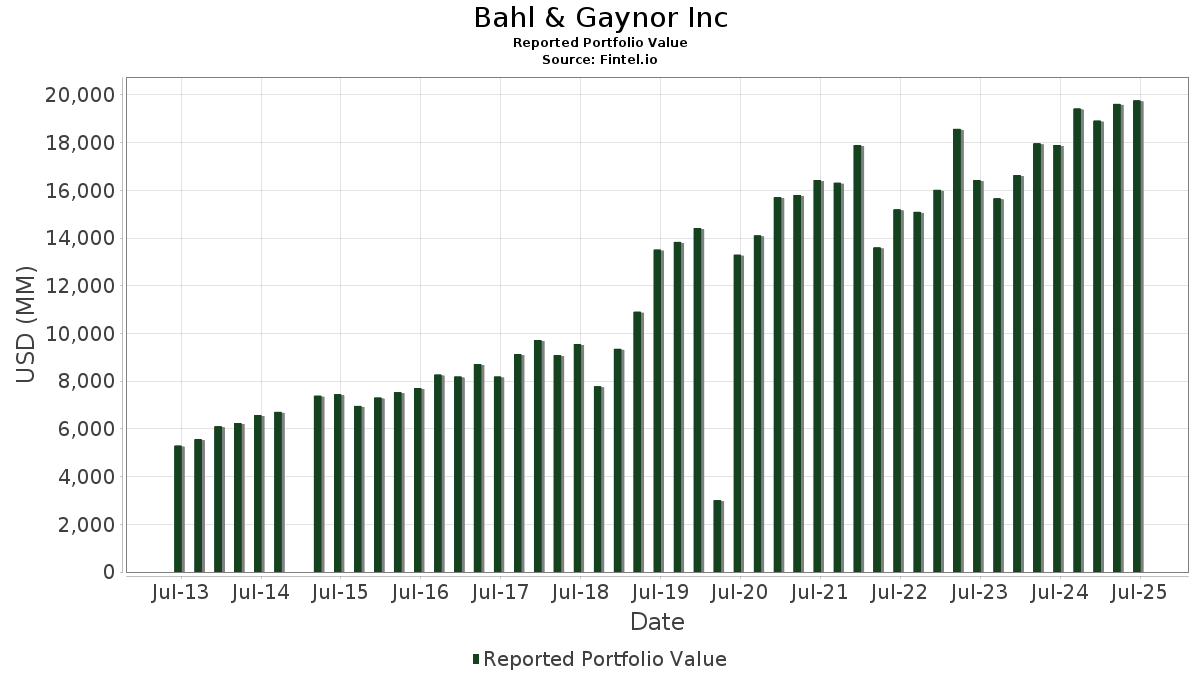
| Nilai Portfolio | $ 19,761,587,379 |
| Kedudukan Semasa | 332 |
Pegangan Terkini, Prestasi, AUM (dari 13F, 13D)
Bahl & Gaynor Inc telah mendedahkan 332 jumlah pegangan dalam pemfailan SEC terkini mereka. Nilai portfolio terkini dikira sebagai $ 19,761,587,379 USD. Aset Sebenar Di Bawah Pengurusan (AUM) ialah nilai ini ditambah dengan tunai (yang tidak didedahkan). Pegangan teratas Bahl & Gaynor Inc ialah Broadcom Inc. (US:AVGO) , Microsoft Corporation (US:MSFT) , AbbVie Inc. (US:ABBV) , The Procter & Gamble Company (US:PG) , and Eli Lilly and Company (US:LLY) . Kedudukan baharu Bahl & Gaynor Inc termasuk AvalonBay Communities, Inc. (US:AVB) , Western Digital Corporation (US:WDC) , Black Hills Corporation (US:BKH) , IDACORP, Inc. (US:IDA) , and British American Tobacco p.l.c. - Depositary Receipt (Common Stock) (US:BTI) .
Kenaikan Teratas Suku Tahun Ini
Kami menggunakan perubahan dalam peruntukan portfolio kerana ini adalah metrik yang paling bermakna. Perubahan boleh disebabkan oleh perdagangan atau perubahan dalam harga saham.
| Sekuriti | Saham (MM) |
Nilai (MM$) |
Portfolio % | ΔPortfolio % |
|---|---|---|---|---|
| 4.03 | 1,110.97 | 5.6219 | 1.9190 | |
| 1.70 | 843.27 | 4.2672 | 1.1969 | |
| 0.68 | 114.79 | 0.5809 | 0.5797 | |
| 2.07 | 599.93 | 3.0359 | 0.4248 | |
| 4.12 | 765.23 | 3.8723 | 0.3499 | |
| 0.68 | 212.38 | 1.0747 | 0.3351 | |
| 0.25 | 49.94 | 0.2527 | 0.2527 | |
| 0.51 | 101.12 | 0.5117 | 0.2295 | |
| 0.58 | 173.92 | 0.8801 | 0.2197 | |
| 0.26 | 107.53 | 0.5441 | 0.1932 |
Penurunan Teratas Suku Tahun Ini
Kami menggunakan perubahan dalam peruntukan portfolio kerana ini adalah metrik yang paling bermakna. Perubahan boleh disebabkan oleh perdagangan atau perubahan dalam harga saham.
| Sekuriti | Saham (MM) |
Nilai (MM$) |
Portfolio % | ΔPortfolio % |
|---|---|---|---|---|
| 1.45 | 190.92 | 0.9661 | -0.8052 | |
| 2.44 | 192.83 | 0.9758 | -0.7355 | |
| 8.52 | 535.07 | 2.7076 | -0.7306 | |
| 1.17 | 311.93 | 1.5785 | -0.6851 | |
| 0.85 | 101.95 | 0.5159 | -0.4082 | |
| 0.12 | 2.83 | 0.0143 | -0.3609 | |
| 0.93 | 262.92 | 1.3304 | -0.3590 | |
| 1.61 | 333.47 | 1.6875 | -0.3341 | |
| 2.24 | 320.74 | 1.6231 | -0.3138 | |
| 4.23 | 674.11 | 3.4112 | -0.3047 |
13F dan Pemfailan Dana
Borang ini telah difailkan pada 2025-08-12 untuk tempoh pelaporan 2025-06-30. Klik ikon pautan untuk melihat sejarah transaksi penuh.
Tingkatkan untuk membuka data premium dan eksport ke Excel ![]() .
.
| Sekuriti | Jenis | Purata Harga Saham | Saham (MM) |
ΔSaham (%) |
ΔSaham (%) |
Nilai ($MM) |
Portfolio (%) |
ΔPortfolio (%) |
|
|---|---|---|---|---|---|---|---|---|---|
| AVGO / Broadcom Inc. | 4.03 | -7.12 | 1,110.97 | 52.92 | 5.6219 | 1.9190 | |||
| MSFT / Microsoft Corporation | 1.70 | 5.65 | 843.27 | 39.99 | 4.2672 | 1.1969 | |||
| ABBV / AbbVie Inc. | 4.12 | 24.98 | 765.23 | 10.73 | 3.8723 | 0.3499 | |||
| PG / The Procter & Gamble Company | 4.23 | -1.09 | 674.11 | -7.54 | 3.4112 | -0.3047 | |||
| LLY / Eli Lilly and Company | 0.83 | -1.53 | 648.17 | -7.06 | 3.2800 | -0.2746 | |||
| JPM / JPMorgan Chase & Co. | 2.07 | -0.91 | 599.93 | 17.11 | 3.0359 | 0.4248 | |||
| WMB / The Williams Companies, Inc. | 8.52 | -24.53 | 535.07 | -20.68 | 2.7076 | -0.7306 | |||
| HD / The Home Depot, Inc. | 1.25 | -1.27 | 457.99 | -1.23 | 2.3176 | -0.0459 | |||
| MMC / Marsh & McLennan Companies, Inc. | 1.93 | -1.39 | 422.70 | -11.65 | 2.1390 | -0.2994 | |||
| MDLZ / Mondelez International, Inc. | 6.06 | -1.40 | 408.75 | -2.00 | 2.0684 | -0.0575 | |||
| NEE / NextEra Energy, Inc. | 5.67 | -1.53 | 393.29 | -3.57 | 1.9902 | -0.0887 | |||
| JNJ / Johnson & Johnson | 2.53 | 15.49 | 385.99 | 6.37 | 1.9532 | 0.1037 | |||
| TXN / Texas Instruments Incorporated | 1.61 | -27.23 | 333.47 | -15.92 | 1.6875 | -0.3341 | |||
| ETN / Eaton Corporation plc | 0.91 | -24.23 | 325.85 | -0.49 | 1.6489 | -0.0200 | |||
| CVX / Chevron Corporation | 2.24 | -1.39 | 320.74 | -15.60 | 1.6231 | -0.3138 | |||
| MCD / McDonald's Corporation | 1.08 | -1.83 | 314.89 | -8.18 | 1.5934 | -0.1545 | |||
| TRV / The Travelers Companies, Inc. | 1.17 | -30.57 | 311.93 | -29.76 | 1.5785 | -0.6851 | |||
| HIG / The Hartford Insurance Group, Inc. | 2.34 | 9.10 | 296.41 | 11.86 | 1.4999 | 0.1494 | |||
| ADP / Automatic Data Processing, Inc. | 0.94 | -1.92 | 289.49 | -1.00 | 1.4649 | -0.0254 | |||
| BR / Broadridge Financial Solutions, Inc. | 1.19 | 1.92 | 289.39 | 2.16 | 1.4644 | 0.0206 | |||
| PNC / The PNC Financial Services Group, Inc. | 1.49 | -6.39 | 277.77 | -0.72 | 1.4056 | -0.0205 | |||
| SRE / Sempra | 3.61 | -9.67 | 273.90 | -4.09 | 1.3860 | -0.0696 | |||
| APD / Air Products and Chemicals, Inc. | 0.93 | -17.06 | 262.92 | -20.68 | 1.3304 | -0.3590 | |||
| PAYX / Paychex, Inc. | 1.80 | 2.78 | 262.44 | -3.10 | 1.3280 | -0.0524 | |||
| LMT / Lockheed Martin Corporation | 0.53 | -1.53 | 247.38 | 2.09 | 1.2518 | 0.0168 | |||
| UNH / UnitedHealth Group Incorporated | 0.68 | 145.73 | 212.38 | 46.37 | 1.0747 | 0.3351 | |||
| MRK / Merck & Co., Inc. | 2.44 | -34.88 | 192.83 | -42.57 | 0.9758 | -0.7355 | |||
| PEP / PepsiCo, Inc. | 1.45 | -37.62 | 190.92 | -45.06 | 0.9661 | -0.8052 | |||
| CTAS / Cintas Corporation | 0.78 | -5.15 | 174.87 | 2.85 | 0.8849 | 0.0183 | |||
| CINF / Cincinnati Financial Corporation | 1.17 | 0.06 | 174.30 | 0.88 | 0.8820 | 0.0013 | |||
| ACN / Accenture plc | 0.58 | 40.15 | 173.92 | 34.24 | 0.8801 | 0.2197 | |||
| CME / CME Group Inc. | 0.62 | -1.76 | 170.74 | 2.07 | 0.8640 | 0.0114 | |||
| TRGP / Targa Resources Corp. | 0.98 | 5.08 | 170.56 | -8.75 | 0.8631 | -0.0896 | |||
| CSCO / Cisco Systems, Inc. | 2.41 | 12.95 | 167.30 | 26.99 | 0.8466 | 0.1751 | |||
| ITW / Illinois Tool Works Inc. | 0.67 | -1.56 | 165.06 | -1.86 | 0.8353 | -0.0220 | |||
| TJX / The TJX Companies, Inc. | 1.33 | 0.56 | 164.59 | 1.95 | 0.8329 | 0.0101 | |||
| MSI / Motorola Solutions, Inc. | 0.39 | 0.32 | 164.03 | -3.65 | 0.8300 | -0.0377 | |||
| XOM / Exxon Mobil Corporation | 1.44 | 21.42 | 154.72 | 10.06 | 0.7829 | 0.0664 | |||
| AAPL / Apple Inc. | 0.74 | -1.95 | 152.81 | -9.44 | 0.7732 | -0.0868 | |||
| KDP / Keurig Dr Pepper Inc. | 4.22 | -0.67 | 139.66 | -4.03 | 0.7067 | -0.0350 | |||
| PPL / PPL Corporation | 4.09 | 3.03 | 138.72 | -3.30 | 0.7020 | -0.0292 | |||
| KMI / Kinder Morgan, Inc. | 4.71 | -0.03 | 138.39 | 3.02 | 0.7003 | 0.0156 | |||
| ABT / Abbott Laboratories | 0.97 | 0.22 | 131.80 | 2.76 | 0.6670 | 0.0132 | |||
| GLW / Corning Incorporated | 2.47 | -3.03 | 130.15 | 11.39 | 0.6586 | 0.0631 | |||
| RTX / RTX Corporation | 0.87 | 11.04 | 126.89 | 22.41 | 0.6421 | 0.1138 | |||
| TSM / Taiwan Semiconductor Manufacturing Company Limited - Depositary Receipt (Common Stock) | 0.55 | 3.20 | 125.49 | 40.80 | 0.6350 | 0.1808 | |||
| EVR / Evercore Inc. | 0.46 | 3.81 | 125.45 | 40.35 | 0.6348 | 0.1792 | |||
| WSO / Watsco, Inc. | 0.28 | -4.23 | 122.79 | -16.80 | 0.6213 | -0.1308 | |||
| KO / The Coca-Cola Company | 1.71 | 6.55 | 121.31 | 5.25 | 0.6138 | 0.0264 | |||
| USB / U.S. Bancorp | 2.61 | -3.06 | 117.98 | 3.90 | 0.5970 | 0.0182 | |||
| SNA / Snap-on Incorporated | 0.38 | 10.45 | 117.11 | 1.98 | 0.5926 | 0.0073 | |||
| TEL / TE Connectivity plc | 0.68 | 40,481.28 | 114.79 | 48,538.98 | 0.5809 | 0.5797 | |||
| SYK / Stryker Corporation | 0.29 | -1.05 | 112.87 | 5.16 | 0.5711 | 0.0241 | |||
| HUBB / Hubbell Incorporated | 0.26 | 26.52 | 107.53 | 56.15 | 0.5441 | 0.1932 | |||
| VCTR / Victory Capital Holdings, Inc. | 1.64 | -9.92 | 104.73 | -0.89 | 0.5300 | -0.0086 | |||
| O / Realty Income Corporation | 1.80 | -25.15 | 103.88 | -25.67 | 0.5257 | -0.1866 | |||
| WM / Waste Management, Inc. | 0.45 | -13.02 | 102.46 | -14.03 | 0.5185 | -0.0890 | |||
| PSX / Phillips 66 | 0.85 | -41.80 | 101.95 | -43.77 | 0.5159 | -0.4082 | |||
| RGA / Reinsurance Group of America, Incorporated | 0.51 | 81.26 | 101.12 | 82.61 | 0.5117 | 0.2295 | |||
| VICI / VICI Properties Inc. | 3.05 | -0.11 | 99.53 | -0.17 | 0.5037 | -0.0045 | |||
| WEC / WEC Energy Group, Inc. | 0.93 | -29.81 | 96.51 | -32.88 | 0.4884 | -0.2445 | |||
| DELL / Dell Technologies Inc. | 0.74 | -42.51 | 91.24 | -22.68 | 0.4617 | -0.1397 | |||
| META / Meta Platforms, Inc. | 0.12 | 3.28 | 88.80 | 32.26 | 0.4494 | 0.1071 | |||
| PLD / Prologis, Inc. | 0.84 | -24.41 | 87.80 | -28.92 | 0.4443 | -0.1853 | |||
| APO / Apollo Global Management, Inc. | 0.62 | 3.06 | 87.29 | 6.77 | 0.4417 | 0.0250 | |||
| OKE / ONEOK, Inc. | 1.02 | -1.81 | 83.56 | -19.22 | 0.4228 | -0.1044 | |||
| FAST / Fastenal Company | 1.98 | 99.76 | 83.27 | 8.19 | 0.4214 | 0.0291 | |||
| BAH / Booz Allen Hamilton Holding Corporation | 0.78 | -6.43 | 81.38 | -6.83 | 0.4118 | -0.0334 | |||
| AMGN / Amgen Inc. | 0.29 | -1.53 | 80.67 | -11.75 | 0.4082 | -0.0577 | |||
| QCOM / QUALCOMM Incorporated | 0.46 | -41.66 | 73.33 | -39.52 | 0.3711 | -0.2469 | |||
| GD / General Dynamics Corporation | 0.25 | -0.81 | 72.95 | 6.13 | 0.3692 | 0.0188 | |||
| AVY / Avery Dennison Corporation | 0.41 | 4.41 | 72.76 | 2.94 | 0.3682 | 0.0079 | |||
| ADI / Analog Devices, Inc. | 0.30 | -1.18 | 70.98 | 16.63 | 0.3592 | 0.0490 | |||
| CSL / Carlisle Companies Incorporated | 0.19 | -0.95 | 69.83 | 8.62 | 0.3534 | 0.0257 | |||
| AFG / American Financial Group, Inc. | 0.52 | -19.54 | 65.55 | -22.68 | 0.3317 | -0.1004 | |||
| DTM / DT Midstream, Inc. | 0.55 | 31.13 | 60.93 | 49.39 | 0.3083 | 0.1004 | |||
| UNP / Union Pacific Corporation | 0.26 | -28.34 | 60.78 | -30.21 | 0.3075 | -0.1363 | |||
| GOOGL / Alphabet Inc. | 0.34 | 52.53 | 60.72 | 73.82 | 0.3073 | 0.1292 | |||
| BLK / BlackRock, Inc. | 0.06 | -1.58 | 60.30 | 9.11 | 0.3051 | 0.0234 | |||
| BAC / Bank of America Corporation | 1.24 | -3.51 | 58.66 | 9.42 | 0.2968 | 0.0236 | |||
| NI / NiSource Inc. | 1.44 | -2.06 | 58.24 | -1.45 | 0.2947 | -0.0065 | |||
| CBOE / Cboe Global Markets, Inc. | 0.24 | 4.04 | 56.24 | 7.23 | 0.2846 | 0.0173 | |||
| GIL / Gildan Activewear Inc. | 1.12 | 10.79 | 55.03 | 23.37 | 0.2785 | 0.0511 | |||
| PKG / Packaging Corporation of America | 0.29 | 9.21 | 54.32 | 3.93 | 0.2749 | 0.0085 | |||
| IPAR / Interparfums, Inc. | 0.41 | 8.50 | 53.38 | 25.12 | 0.2701 | 0.0527 | |||
| PRGO / Perrigo Company plc | 1.98 | -7.78 | 52.89 | -12.12 | 0.2676 | -0.0391 | |||
| ORCL / Oracle Corporation | 0.23 | -8.04 | 51.06 | 43.81 | 0.2584 | 0.0774 | |||
| DGX / Quest Diagnostics Incorporated | 0.28 | -10.74 | 50.48 | -5.24 | 0.2555 | -0.0161 | |||
| NOC / Northrop Grumman Corporation | 0.10 | -5.91 | 50.33 | -8.12 | 0.2547 | -0.0245 | |||
| CMS / CMS Energy Corporation | 0.72 | 9.50 | 50.22 | 1.00 | 0.2541 | 0.0007 | |||
| AVB / AvalonBay Communities, Inc. | 0.25 | 49.94 | 0.2527 | 0.2527 | |||||
| ATO / Atmos Energy Corporation | 0.32 | 5.68 | 49.82 | 5.36 | 0.2521 | 0.0111 | |||
| DOX / Amdocs Limited | 0.54 | -8.37 | 49.50 | -8.63 | 0.2505 | -0.0256 | |||
| KKR / KKR & Co. Inc. | 0.36 | 1.54 | 48.16 | 16.84 | 0.2437 | 0.0336 | |||
| KLAC / KLA Corporation | 0.05 | -1.68 | 47.95 | 29.55 | 0.2427 | 0.0540 | |||
| RPM / RPM International Inc. | 0.41 | 4.35 | 45.16 | -0.92 | 0.2285 | -0.0038 | |||
| WMT / Walmart Inc. | 0.46 | 92.78 | 45.08 | 114.71 | 0.2281 | 0.1211 | |||
| ADC / Agree Realty Corporation | 0.60 | 8.59 | 43.57 | 2.78 | 0.2205 | 0.0044 | |||
| TXRH / Texas Roadhouse, Inc. | 0.23 | -8.01 | 43.25 | 3.47 | 0.2189 | 0.0058 | |||
| LHX / L3Harris Technologies, Inc. | 0.16 | 1.05 | 40.19 | 21.10 | 0.2034 | 0.0342 | |||
| CDW / CDW Corporation | 0.22 | -7.54 | 38.73 | 3.04 | 0.1960 | 0.0044 | |||
| LNT / Alliant Energy Corporation | 0.60 | 26.83 | 36.36 | 19.18 | 0.1840 | 0.0285 | |||
| EHC / Encompass Health Corporation | 0.29 | 14.80 | 35.35 | 39.01 | 0.1789 | 0.0493 | |||
| ECL / Ecolab Inc. | 0.13 | -4.08 | 34.80 | 1.94 | 0.1761 | 0.0021 | |||
| BX / Blackstone Inc. | 0.23 | 0.02 | 33.80 | 7.03 | 0.1710 | 0.0101 | |||
| MZTI / The Marzetti Company | 0.20 | 7.81 | 33.73 | 6.44 | 0.1707 | 0.0092 | |||
| PH / Parker-Hannifin Corporation | 0.05 | 13.20 | 32.83 | 30.07 | 0.1661 | 0.0375 | |||
| ZTS / Zoetis Inc. | 0.21 | -16.09 | 32.25 | -20.52 | 0.1632 | -0.0436 | |||
| WDC / Western Digital Corporation | 0.49 | 31.43 | 0.1590 | 0.1590 | |||||
| AVT / Avnet, Inc. | 0.59 | 8.10 | 31.06 | 19.31 | 0.1572 | 0.0245 | |||
| ELS / Equity LifeStyle Properties, Inc. | 0.50 | 111.24 | 30.93 | 95.31 | 0.1565 | 0.0758 | |||
| HON / Honeywell International Inc. | 0.13 | -4.79 | 30.86 | 4.71 | 0.1562 | 0.0059 | |||
| CARR / Carrier Global Corporation | 0.42 | 312.26 | 30.72 | 375.98 | 0.1555 | 0.1226 | |||
| USPH / U.S. Physical Therapy, Inc. | 0.32 | -6.77 | 25.15 | 0.75 | 0.1273 | 0.0000 | |||
| R / Ryder System, Inc. | 0.15 | 149.05 | 23.17 | 175.36 | 0.1172 | 0.0743 | |||
| BRK.B / Berkshire Hathaway Inc. | 0.05 | -0.30 | 22.85 | -9.06 | 0.1156 | -0.0124 | |||
| PAG / Penske Automotive Group, Inc. | 0.13 | 32.67 | 21.95 | 58.31 | 0.1111 | 0.0404 | |||
| EMR / Emerson Electric Co. | 0.15 | -7.49 | 20.39 | 12.50 | 0.1032 | 0.0108 | |||
| PAGP / Plains GP Holdings, L.P. - Limited Partnership | 1.05 | 9.65 | 20.33 | -0.26 | 0.1029 | -0.0010 | |||
| ENB / Enbridge Inc. | 0.44 | -0.33 | 19.80 | 1.94 | 0.1002 | 0.0012 | |||
| TRNO / Terreno Realty Corporation | 0.33 | -25.87 | 18.24 | -34.26 | 0.0923 | -0.0491 | |||
| IEFA / iShares Trust - iShares Core MSCI EAFE ETF | 0.21 | -0.63 | 17.34 | 9.66 | 0.0877 | 0.0071 | |||
| ALLE / Allegion plc | 0.12 | 105.55 | 16.69 | 127.07 | 0.0844 | 0.0470 | |||
| AVNT / Avient Corporation | 0.51 | -0.19 | 16.39 | -13.22 | 0.0829 | -0.0133 | |||
| NKE / NIKE, Inc. | 0.23 | -7.98 | 16.04 | 2.98 | 0.0811 | 0.0018 | |||
| DHI / D.R. Horton, Inc. | 0.12 | -1.27 | 15.65 | 0.12 | 0.0792 | -0.0005 | |||
| MKC / McCormick & Company, Incorporated | 0.20 | -5.32 | 15.29 | -12.79 | 0.0774 | -0.0120 | |||
| SBUX / Starbucks Corporation | 0.16 | -24.86 | 15.08 | -29.81 | 0.0763 | -0.0332 | |||
| ENSG / The Ensign Group, Inc. | 0.08 | 2.96 | 12.56 | 22.74 | 0.0636 | 0.0114 | |||
| BDX / Becton, Dickinson and Company | 0.07 | -8.51 | 12.30 | -31.20 | 0.0622 | -0.0289 | |||
| AMD / Advanced Micro Devices, Inc. | 0.09 | 0.14 | 12.28 | 38.32 | 0.0622 | 0.0169 | |||
| UTZ / Utz Brands, Inc. | 0.97 | 6.40 | 12.21 | -5.16 | 0.0618 | -0.0038 | |||
| MTH / Meritage Homes Corporation | 0.18 | 7.07 | 12.15 | 1.17 | 0.0615 | 0.0003 | |||
| NTAP / NetApp, Inc. | 0.11 | 5.05 | 11.37 | 27.42 | 0.0575 | 0.0121 | |||
| FI / Fiserv, Inc. | 0.07 | -0.80 | 11.27 | -22.56 | 0.0570 | -0.0171 | |||
| NVS / Novartis AG - Depositary Receipt (Common Stock) | 0.09 | -2.05 | 11.09 | 6.33 | 0.0561 | 0.0030 | |||
| DOV / Dover Corporation | 0.06 | -0.25 | 10.83 | 4.03 | 0.0548 | 0.0017 | |||
| OTIS / Otis Worldwide Corporation | 0.11 | -12.58 | 10.77 | -16.12 | 0.0545 | -0.0109 | |||
| LMAT / LeMaitre Vascular, Inc. | 0.12 | 0.79 | 10.21 | -0.22 | 0.0517 | -0.0005 | |||
| CW / Curtiss-Wright Corporation | 0.02 | -11.51 | 10.18 | 36.27 | 0.0515 | 0.0134 | |||
| AJG / Arthur J. Gallagher & Co. | 0.03 | 0.00 | 9.76 | -7.28 | 0.0494 | -0.0043 | |||
| ROP / Roper Technologies, Inc. | 0.02 | -2.94 | 9.75 | -6.68 | 0.0493 | -0.0039 | |||
| CHD / Church & Dwight Co., Inc. | 0.10 | -7.34 | 9.66 | -19.11 | 0.0489 | -0.0120 | |||
| LOW / Lowe's Companies, Inc. | 0.04 | -2.16 | 9.24 | -6.92 | 0.0468 | -0.0038 | |||
| FFBC / First Financial Bancorp. | 0.38 | 4.86 | 9.19 | 1.84 | 0.0465 | 0.0005 | |||
| RMD / ResMed Inc. | 0.04 | -6.16 | 9.18 | 8.16 | 0.0464 | 0.0032 | |||
| FSS / Federal Signal Corporation | 0.09 | 3.11 | 9.07 | 49.20 | 0.0459 | 0.0149 | |||
| BRK.A / Berkshire Hathaway Inc. | 0.00 | 0.00 | 8.75 | -8.73 | 0.0443 | -0.0046 | |||
| VEU / Vanguard International Equity Index Funds - Vanguard FTSE All-World ex-US ETF | 0.13 | 16.33 | 8.73 | 28.92 | 0.0442 | 0.0097 | |||
| DIS / The Walt Disney Company | 0.07 | -1.30 | 8.70 | 24.02 | 0.0440 | 0.0083 | |||
| ATR / AptarGroup, Inc. | 0.06 | 7.78 | 8.69 | 13.62 | 0.0440 | 0.0050 | |||
| TSCO / Tractor Supply Company | 0.16 | -9.14 | 8.52 | -12.99 | 0.0431 | -0.0068 | |||
| CHE / Chemed Corporation | 0.02 | 1.98 | 8.46 | -19.30 | 0.0428 | -0.0106 | |||
| MKTX / MarketAxess Holdings Inc. | 0.04 | -6.08 | 8.42 | -3.05 | 0.0426 | -0.0017 | |||
| GOOG / Alphabet Inc. | 0.05 | -11.23 | 8.37 | 0.78 | 0.0424 | 0.0000 | |||
| TTEK / Tetra Tech, Inc. | 0.22 | 2.13 | 7.73 | 25.58 | 0.0391 | 0.0077 | |||
| COST / Costco Wholesale Corporation | 0.01 | -0.22 | 7.52 | 4.43 | 0.0380 | 0.0014 | |||
| BCPC / Balchem Corporation | 0.05 | 1.20 | 7.37 | -2.95 | 0.0373 | -0.0014 | |||
| V / Visa Inc. | 0.02 | -1.33 | 7.31 | -0.04 | 0.0370 | -0.0003 | |||
| MSA / MSA Safety Incorporated | 0.04 | 17.25 | 7.03 | 33.91 | 0.0355 | 0.0088 | |||
| NPO / Enpro Inc. | 0.04 | 2.93 | 6.72 | 21.87 | 0.0340 | 0.0059 | |||
| NVDA / NVIDIA Corporation | 0.04 | -6.90 | 6.47 | 35.72 | 0.0327 | 0.0084 | |||
| TPL / Texas Pacific Land Corporation | 0.01 | 0.00 | 6.34 | -20.27 | 0.0321 | -0.0084 | |||
| CPK / Chesapeake Utilities Corporation | 0.05 | 18.12 | 6.19 | 10.57 | 0.0313 | 0.0028 | |||
| KNSL / Kinsale Capital Group, Inc. | 0.01 | 2.96 | 5.84 | 2.37 | 0.0295 | 0.0005 | |||
| BWXT / BWX Technologies, Inc. | 0.04 | 4.28 | 5.75 | 52.29 | 0.0291 | 0.0099 | |||
| PM / Philip Morris International Inc. | 0.03 | 0.14 | 5.63 | 14.90 | 0.0285 | 0.0035 | |||
| FITB / Fifth Third Bancorp | 0.14 | 5.90 | 5.63 | 11.12 | 0.0285 | 0.0027 | |||
| WFC / Wells Fargo & Company | 0.07 | -3.82 | 5.57 | 7.34 | 0.0282 | 0.0017 | |||
| GWW / W.W. Grainger, Inc. | 0.01 | -1.03 | 5.50 | 4.21 | 0.0278 | 0.0009 | |||
| NSRGY / Nestlé S.A. - Depositary Receipt (Common Stock) | 0.06 | -0.27 | 5.46 | -2.19 | 0.0276 | -0.0008 | |||
| AMZN / Amazon.com, Inc. | 0.02 | -0.16 | 5.36 | 15.15 | 0.0271 | 0.0034 | |||
| ISRG / Intuitive Surgical, Inc. | 0.01 | -2.42 | 5.20 | 7.06 | 0.0263 | 0.0016 | |||
| ET / Energy Transfer LP - Limited Partnership | 0.28 | 3.65 | 5.04 | 1.08 | 0.0255 | 0.0001 | |||
| LFUS / Littelfuse, Inc. | 0.02 | 38.07 | 4.87 | 59.13 | 0.0247 | 0.0091 | |||
| AAON / AAON, Inc. | 0.06 | 3.09 | 4.69 | -2.70 | 0.0237 | -0.0008 | |||
| JKHY / Jack Henry & Associates, Inc. | 0.03 | -0.46 | 4.59 | -1.80 | 0.0232 | -0.0006 | |||
| NYT / The New York Times Company | 0.08 | 47.84 | 4.49 | 66.84 | 0.0227 | 0.0090 | |||
| MA / Mastercard Incorporated | 0.01 | 1.08 | 4.40 | 3.63 | 0.0223 | 0.0006 | |||
| MDT / Medtronic plc | 0.05 | -1.19 | 4.18 | -4.17 | 0.0212 | -0.0011 | |||
| AIT / Applied Industrial Technologies, Inc. | 0.02 | 78.65 | 4.15 | 84.29 | 0.0210 | 0.0095 | |||
| DUK / Duke Energy Corporation | 0.03 | -2.99 | 3.92 | -6.13 | 0.0198 | -0.0015 | |||
| LIN / Linde plc | 0.01 | 0.34 | 3.87 | 1.10 | 0.0196 | 0.0001 | |||
| MPWR / Monolithic Power Systems, Inc. | 0.01 | 0.00 | 3.77 | 26.12 | 0.0191 | 0.0038 | |||
| KVUE / Kenvue Inc. | 0.17 | -6.69 | 3.51 | -18.54 | 0.0178 | -0.0042 | |||
| IBM / International Business Machines Corporation | 0.01 | 7.29 | 3.35 | 27.22 | 0.0169 | 0.0035 | |||
| COHR / Coherent Corp. | 0.04 | -0.64 | 3.32 | 36.47 | 0.0168 | 0.0044 | |||
| DCI / Donaldson Company, Inc. | 0.04 | -0.60 | 2.99 | 2.82 | 0.0151 | 0.0003 | |||
| HPQ / HP Inc. | 0.12 | -95.65 | 2.83 | -96.16 | 0.0143 | -0.3609 | |||
| KR / The Kroger Co. | 0.04 | -11.22 | 2.81 | -5.90 | 0.0142 | -0.0010 | |||
| OLED / Universal Display Corporation | 0.02 | -15.74 | 2.56 | -6.68 | 0.0129 | -0.0010 | |||
| VLO / Valero Energy Corporation | 0.02 | -7.56 | 2.53 | -5.95 | 0.0128 | -0.0009 | |||
| HOMB / Home Bancshares, Inc. (Conway, AR) | 0.09 | -82.11 | 2.53 | -82.00 | 0.0128 | -0.0587 | |||
| HSY / The Hershey Company | 0.02 | -32.09 | 2.50 | -34.12 | 0.0126 | -0.0067 | |||
| CAT / Caterpillar Inc. | 0.01 | 6.73 | 2.39 | 25.67 | 0.0121 | 0.0024 | |||
| NSC / Norfolk Southern Corporation | 0.01 | -2.09 | 2.34 | 5.83 | 0.0118 | 0.0006 | |||
| VIGI / Vanguard Whitehall Funds - Vanguard International Dividend Appreciation ETF | 0.03 | 4.23 | 2.32 | 13.29 | 0.0117 | 0.0013 | |||
| CCI / Crown Castle Inc. | 0.02 | -34.78 | 2.29 | -35.74 | 0.0116 | -0.0066 | |||
| MO / Altria Group, Inc. | 0.04 | -0.25 | 2.25 | -2.55 | 0.0114 | -0.0004 | |||
| IOSP / Innospec Inc. | 0.03 | -14.12 | 2.23 | -23.78 | 0.0113 | -0.0036 | |||
| MPLX / MPLX LP - Limited Partnership | 0.04 | 1.80 | 2.19 | -2.06 | 0.0111 | -0.0003 | |||
| VEA / Vanguard Tax-Managed Funds - Vanguard FTSE Developed Markets ETF | 0.04 | 19.03 | 2.10 | 33.50 | 0.0106 | 0.0026 | |||
| GS / The Goldman Sachs Group, Inc. | 0.00 | -1.42 | 2.07 | 27.71 | 0.0105 | 0.0022 | |||
| BMY / Bristol-Myers Squibb Company | 0.04 | 0.19 | 2.04 | -23.94 | 0.0103 | -0.0034 | |||
| UFPI / UFP Industries, Inc. | 0.02 | -21.63 | 2.04 | -27.25 | 0.0103 | -0.0040 | |||
| KMB / Kimberly-Clark Corporation | 0.02 | 1.94 | 2.01 | -7.60 | 0.0102 | -0.0009 | |||
| INTC / Intel Corporation | 0.09 | -29.56 | 1.99 | -30.55 | 0.0100 | -0.0045 | |||
| SHEL / Shell plc - Depositary Receipt (Common Stock) | 0.03 | -12.48 | 1.98 | -15.89 | 0.0100 | -0.0020 | |||
| MMM / 3M Company | 0.01 | -1.76 | 1.83 | 1.84 | 0.0092 | 0.0001 | |||
| SO / The Southern Company | 0.02 | 2.99 | 1.77 | 2.84 | 0.0090 | 0.0002 | |||
| DE / Deere & Company | 0.00 | -7.96 | 1.69 | -0.29 | 0.0086 | -0.0001 | |||
| POWI / Power Integrations, Inc. | 0.03 | -31.71 | 1.68 | -24.41 | 0.0085 | -0.0028 | |||
| VWO / Vanguard International Equity Index Funds - Vanguard FTSE Emerging Markets ETF | 0.03 | -9.55 | 1.59 | -1.18 | 0.0080 | -0.0002 | |||
| CL / Colgate-Palmolive Company | 0.02 | -7.70 | 1.58 | -10.49 | 0.0080 | -0.0010 | |||
| STE / STERIS plc | 0.01 | -1.58 | 1.49 | 4.26 | 0.0076 | 0.0003 | |||
| IBP / Installed Building Products, Inc. | 0.01 | 79.36 | 1.48 | 88.78 | 0.0075 | 0.0035 | |||
| TFX / Teleflex Incorporated | 0.01 | -21.23 | 1.39 | -32.56 | 0.0070 | -0.0035 | |||
| GE / General Electric Company | 0.01 | -5.73 | 1.37 | 21.28 | 0.0069 | 0.0012 | |||
| CSX / CSX Corporation | 0.04 | -0.04 | 1.36 | 10.81 | 0.0069 | 0.0006 | |||
| GPC / Genuine Parts Company | 0.01 | -1.42 | 1.35 | 0.37 | 0.0068 | -0.0000 | |||
| RF / Regions Financial Corporation | 0.06 | -16.26 | 1.33 | -9.31 | 0.0068 | -0.0008 | |||
| IEMG / iShares, Inc. - iShares Core MSCI Emerging Markets ETF | 0.02 | 39.31 | 1.32 | 55.05 | 0.0067 | 0.0023 | |||
| NSP / Insperity, Inc. | 0.02 | -86.16 | 1.31 | -90.68 | 0.0066 | -0.0649 | |||
| MCO / Moody's Corporation | 0.00 | 0.00 | 1.26 | 7.77 | 0.0064 | 0.0004 | |||
| MCHP / Microchip Technology Incorporated | 0.02 | -1.54 | 1.26 | 43.13 | 0.0064 | 0.0019 | |||
| ODFL / Old Dominion Freight Line, Inc. | 0.01 | -6.38 | 1.24 | -8.17 | 0.0063 | -0.0006 | |||
| CLX / The Clorox Company | 0.01 | -0.41 | 1.23 | -18.82 | 0.0062 | -0.0015 | |||
| VZ / Verizon Communications Inc. | 0.03 | -56.72 | 1.19 | -58.71 | 0.0060 | -0.0086 | |||
| HEI / HEICO Corporation | 0.00 | 0.00 | 1.17 | 22.77 | 0.0059 | 0.0011 | |||
| EFA / iShares Trust - iShares MSCI EAFE ETF | 0.01 | 10.81 | 1.14 | 21.17 | 0.0058 | 0.0010 | |||
| A / Agilent Technologies, Inc. | 0.01 | -13.37 | 1.11 | -12.64 | 0.0056 | -0.0009 | |||
| EOG / EOG Resources, Inc. | 0.01 | -0.92 | 1.07 | -7.58 | 0.0054 | -0.0005 | |||
| AXP / American Express Company | 0.00 | 1.01 | 1.05 | 19.75 | 0.0053 | 0.0008 | |||
| CVS / CVS Health Corporation | 0.01 | -9.12 | 1.03 | -7.45 | 0.0052 | -0.0005 | |||
| SJM / The J. M. Smucker Company | 0.01 | 5.02 | 1.02 | -12.95 | 0.0051 | -0.0008 | |||
| WINA / Winmark Corporation | 0.00 | -60.71 | 0.98 | -53.34 | 0.0049 | -0.0057 | |||
| TGT / Target Corporation | 0.01 | -2.60 | 0.96 | -7.94 | 0.0049 | -0.0005 | |||
| CMCSA / Comcast Corporation | 0.03 | -20.57 | 0.96 | -23.19 | 0.0048 | -0.0015 | |||
| MPC / Marathon Petroleum Corporation | 0.01 | -9.27 | 0.94 | 3.53 | 0.0047 | 0.0001 | |||
| DEO / Diageo plc - Depositary Receipt (Common Stock) | 0.01 | -3.26 | 0.94 | -6.87 | 0.0047 | -0.0004 | |||
| NDSN / Nordson Corporation | 0.00 | -15.67 | 0.92 | -10.40 | 0.0047 | -0.0006 | |||
| TFC / Truist Financial Corporation | 0.02 | -26.48 | 0.91 | -23.19 | 0.0046 | -0.0014 | |||
| WPC / W. P. Carey Inc. | 0.01 | -8.20 | 0.88 | -9.24 | 0.0045 | -0.0005 | |||
| MS / Morgan Stanley | 0.01 | 8.18 | 0.88 | 30.56 | 0.0045 | 0.0010 | |||
| STAG / STAG Industrial, Inc. | 0.02 | -37.35 | 0.88 | -37.13 | 0.0044 | -0.0027 | |||
| NFLX / Netflix, Inc. | 0.00 | -2.91 | 0.85 | 39.57 | 0.0043 | 0.0012 | |||
| SHW / The Sherwin-Williams Company | 0.00 | 0.00 | 0.85 | -1.74 | 0.0043 | -0.0001 | |||
| DAL / Delta Air Lines, Inc. | 0.02 | 2.56 | 0.85 | 15.71 | 0.0043 | 0.0006 | |||
| KRP / Kimbell Royalty Partners, LP - Limited Partnership | 0.06 | 15.55 | 0.84 | 15.14 | 0.0043 | 0.0005 | |||
| CAH / Cardinal Health, Inc. | 0.00 | 0.00 | 0.82 | 22.01 | 0.0041 | 0.0007 | |||
| ESQ / Esquire Financial Holdings, Inc. | 0.01 | 0.00 | 0.81 | 25.62 | 0.0041 | 0.0008 | |||
| GIS / General Mills, Inc. | 0.02 | -25.80 | 0.81 | -35.69 | 0.0041 | -0.0023 | |||
| BSM / Black Stone Minerals, L.P. - Limited Partnership | 0.06 | 0.00 | 0.80 | -14.38 | 0.0041 | -0.0007 | |||
| AMT / American Tower Corporation | 0.00 | -28.21 | 0.79 | -27.09 | 0.0040 | -0.0015 | |||
| PFE / Pfizer Inc. | 0.03 | -23.87 | 0.78 | -27.15 | 0.0039 | -0.0015 | |||
| XYZ / Block, Inc. | 0.01 | -0.18 | 0.77 | 24.84 | 0.0039 | 0.0008 | |||
| COR / Cencora, Inc. | 0.00 | -0.86 | 0.76 | 6.87 | 0.0039 | 0.0002 | |||
| TMO / Thermo Fisher Scientific Inc. | 0.00 | -0.22 | 0.75 | -18.70 | 0.0038 | -0.0009 | |||
| SAP / SAP SE - Depositary Receipt (Common Stock) | 0.00 | 3.45 | 0.74 | 17.30 | 0.0037 | 0.0005 | |||
| PYPL / PayPal Holdings, Inc. | 0.01 | -49.73 | 0.74 | -42.78 | 0.0037 | -0.0028 | |||
| T / AT&T Inc. | 0.02 | 12.93 | 0.68 | 15.62 | 0.0034 | 0.0004 | |||
| FHN / First Horizon Corporation | 0.03 | 0.00 | 0.67 | 9.14 | 0.0034 | 0.0003 | |||
| SCHW / The Charles Schwab Corporation | 0.01 | -0.04 | 0.66 | 16.61 | 0.0033 | 0.0005 | |||
| NOW / ServiceNow, Inc. | 0.00 | 0.00 | 0.65 | 28.99 | 0.0033 | 0.0007 | |||
| OGS / ONE Gas, Inc. | 0.01 | -0.84 | 0.64 | -5.79 | 0.0032 | -0.0002 | |||
| UBCP / United Bancorp, Inc. | 0.04 | 0.00 | 0.62 | 8.15 | 0.0032 | 0.0002 | |||
| SYY / Sysco Corporation | 0.01 | -0.50 | 0.62 | 0.48 | 0.0032 | -0.0000 | |||
| BKH / Black Hills Corporation | 0.01 | 0.61 | 0.0031 | 0.0031 | |||||
| ALC / Alcon Inc. | 0.01 | -8.45 | 0.60 | -14.94 | 0.0030 | -0.0006 | |||
| ZBH / Zimmer Biomet Holdings, Inc. | 0.01 | -0.93 | 0.59 | -20.14 | 0.0030 | -0.0008 | |||
| CP / Canadian Pacific Kansas City Limited | 0.01 | -2.18 | 0.59 | 10.34 | 0.0030 | 0.0003 | |||
| IDA / IDACORP, Inc. | 0.01 | 0.58 | 0.0029 | 0.0029 | |||||
| CSGS / CSG Systems International, Inc. | 0.01 | -18.59 | 0.57 | -12.10 | 0.0029 | -0.0004 | |||
| INTU / Intuit Inc. | 0.00 | 0.00 | 0.56 | 28.44 | 0.0028 | 0.0006 | |||
| GEV / GE Vernova Inc. | 0.00 | 6.87 | 0.56 | 85.10 | 0.0028 | 0.0013 | |||
| ES / Eversource Energy | 0.01 | -7.06 | 0.56 | -4.78 | 0.0028 | -0.0002 | |||
| LRCX / Lam Research Corporation | 0.01 | 1.85 | 0.55 | 36.59 | 0.0028 | 0.0007 | |||
| CHRW / C.H. Robinson Worldwide, Inc. | 0.01 | -1.05 | 0.54 | -7.17 | 0.0028 | -0.0002 | |||
| SSD / Simpson Manufacturing Co., Inc. | 0.00 | -4.68 | 0.53 | -5.75 | 0.0027 | -0.0002 | |||
| POOL / Pool Corporation | 0.00 | -15.13 | 0.52 | -22.29 | 0.0026 | -0.0008 | |||
| DHR / Danaher Corporation | 0.00 | 0.65 | 0.52 | -3.18 | 0.0026 | -0.0001 | |||
| MCK / McKesson Corporation | 0.00 | 0.00 | 0.52 | 9.05 | 0.0026 | 0.0002 | |||
| NTRS / Northern Trust Corporation | 0.00 | 0.00 | 0.51 | 28.43 | 0.0026 | 0.0006 | |||
| HBAN / Huntington Bancshares Incorporated | 0.03 | -9.16 | 0.49 | 1.44 | 0.0025 | 0.0000 | |||
| WST / West Pharmaceutical Services, Inc. | 0.00 | -8.60 | 0.46 | -10.77 | 0.0024 | -0.0003 | |||
| CHKP / Check Point Software Technologies Ltd. | 0.00 | 0.00 | 0.46 | -2.93 | 0.0024 | -0.0001 | |||
| VSS / Vanguard International Equity Index Funds - Vanguard FTSE All-World ex-US Small-Cap ETF | 0.00 | -3.68 | 0.46 | 12.01 | 0.0023 | 0.0002 | |||
| EPD / Enterprise Products Partners L.P. - Limited Partnership | 0.01 | 2.79 | 0.46 | -6.54 | 0.0023 | -0.0002 | |||
| BFB / Brown-Forman Corp. - Class B | 0.02 | -7.99 | 0.45 | -26.99 | 0.0023 | -0.0009 | |||
| SNV / Synovus Financial Corp. | 0.01 | 0.00 | 0.45 | 10.95 | 0.0023 | 0.0002 | |||
| VXUS / Vanguard STAR Funds - Vanguard Total International Stock ETF | 0.01 | 0.00 | 0.44 | 11.22 | 0.0022 | 0.0002 | |||
| BSX / Boston Scientific Corporation | 0.00 | 0.00 | 0.44 | 6.60 | 0.0022 | 0.0001 | |||
| SPEM / SPDR Index Shares Funds - SPDR Portfolio Emerging Markets ETF | 0.01 | 17.46 | 0.43 | 27.65 | 0.0022 | 0.0005 | |||
| BK / The Bank of New York Mellon Corporation | 0.00 | 1.16 | 0.43 | 9.97 | 0.0022 | 0.0002 | |||
| OGE / OGE Energy Corp. | 0.01 | 0.00 | 0.42 | -3.44 | 0.0021 | -0.0001 | |||
| CI / The Cigna Group | 0.00 | 0.00 | 0.41 | 0.49 | 0.0021 | -0.0000 | |||
| EW / Edwards Lifesciences Corporation | 0.01 | 0.00 | 0.40 | 7.86 | 0.0020 | 0.0001 | |||
| CNQ / Canadian Natural Resources Limited | 0.01 | -0.39 | 0.38 | 1.60 | 0.0019 | 0.0000 | |||
| CAG / Conagra Brands, Inc. | 0.02 | -93.37 | 0.37 | -94.92 | 0.0019 | -0.0348 | |||
| C / Citigroup Inc. | 0.00 | 5.34 | 0.36 | 26.15 | 0.0018 | 0.0004 | |||
| RGLD / Royal Gold, Inc. | 0.00 | 0.00 | 0.36 | 8.56 | 0.0018 | 0.0001 | |||
| PANW / Palo Alto Networks, Inc. | 0.00 | -15.69 | 0.33 | 0.92 | 0.0017 | 0.0000 | |||
| HI / Hillenbrand, Inc. | 0.02 | -2.98 | 0.33 | -19.51 | 0.0017 | -0.0004 | |||
| FIS / Fidelity National Information Services, Inc. | 0.00 | 0.00 | 0.32 | 9.15 | 0.0016 | 0.0001 | |||
| NTR / Nutrien Ltd. | 0.01 | 0.00 | 0.31 | 17.23 | 0.0016 | 0.0002 | |||
| BTI / British American Tobacco p.l.c. - Depositary Receipt (Common Stock) | 0.01 | 0.31 | 0.0015 | 0.0015 | |||||
| COP / ConocoPhillips | 0.00 | -3.02 | 0.31 | -17.12 | 0.0015 | -0.0003 | |||
| BIP / Brookfield Infrastructure Partners L.P. - Limited Partnership | 0.01 | -11.11 | 0.30 | 0.00 | 0.0015 | -0.0000 | |||
| G / Genpact Limited | 0.01 | -68.02 | 0.29 | -72.10 | 0.0015 | -0.0038 | |||
| PRMRF / Paramount Resources Ltd. | 0.02 | 0.00 | 0.29 | 22.98 | 0.0015 | 0.0003 | |||
| AEP / American Electric Power Company, Inc. | 0.00 | 5.63 | 0.29 | 0.35 | 0.0014 | -0.0000 | |||
| GHC / Graham Holdings Company | 0.00 | 0.00 | 0.28 | -1.74 | 0.0014 | -0.0000 | |||
| PPG / PPG Industries, Inc. | 0.00 | 6.64 | 0.27 | 11.34 | 0.0013 | 0.0001 | |||
| IEX / IDEX Corporation | 0.00 | -44.38 | 0.26 | -46.12 | 0.0013 | -0.0012 | |||
| AMP / Ameriprise Financial, Inc. | 0.00 | 0.00 | 0.26 | 10.21 | 0.0013 | 0.0001 | |||
| CTVA / Corteva, Inc. | 0.00 | 0.00 | 0.24 | 18.32 | 0.0012 | 0.0002 | |||
| GILD / Gilead Sciences, Inc. | 0.00 | 0.00 | 0.24 | -1.24 | 0.0012 | -0.0000 | |||
| YUM / Yum! Brands, Inc. | 0.00 | -0.63 | 0.23 | -6.43 | 0.0012 | -0.0001 | |||
| AMAT / Applied Materials, Inc. | 0.00 | 0.22 | 0.0011 | 0.0011 | |||||
| DSI / iShares Trust - iShares ESG MSCI KLD 400 ETF | 0.00 | 0.22 | 0.0011 | 0.0011 | |||||
| LCNB / LCNB Corp. | 0.01 | 0.22 | 0.0011 | 0.0011 | |||||
| TSLA / Tesla, Inc. | 0.00 | 0.22 | 0.0011 | 0.0011 | |||||
| HRL / Hormel Foods Corporation | 0.01 | -51.96 | 0.21 | -53.11 | 0.0011 | -0.0012 | |||
| ELV / Elevance Health, Inc. | 0.00 | 0.20 | 0.0010 | 0.0010 | |||||
| LAND / Gladstone Land Corporation | 0.02 | 0.00 | 0.17 | -3.47 | 0.0008 | -0.0000 | |||
| EFC / Ellington Financial Inc. | 0.01 | 0.00 | 0.16 | -1.82 | 0.0008 | -0.0000 | |||
| SFBQF / SoftBank Corp. | 0.02 | 0.03 | 0.0002 | 0.0002 | |||||
| NTT1 N / NTT, Inc. | 0.02 | 0.02 | 0.0001 | 0.0001 | |||||
| AGL / agilon health, inc. | 0.01 | 0.00 | 0.02 | -46.51 | 0.0001 | -0.0001 | |||
| PLUG / Plug Power Inc. | 0.01 | 0.00 | 0.01 | 7.69 | 0.0001 | 0.0000 | |||
| ILUS / Ilustrato Pictures International Inc. | 0.16 | 0.00 | 0.00 | 0.0000 | 0.0000 | ||||
| ALYI / MBAK Energy Solutions Inc. | 0.11 | 0.00 | 0.00 | 0.0000 | 0.0000 | ||||
| FTV / Fortive Corporation | 0.00 | -100.00 | 0.00 | 0.0000 | |||||
| LKQ / LKQ Corporation | 0.00 | -100.00 | 0.00 | 0.0000 | |||||
| RACE / Ferrari N.V. | 0.00 | -100.00 | 0.00 | -100.00 | -0.0019 | ||||
| ORLY / O'Reilly Automotive, Inc. | 0.00 | -100.00 | 0.00 | 0.0000 | |||||
| FR / First Industrial Realty Trust, Inc. | 0.00 | -100.00 | 0.00 | 0.0000 | |||||
| STZ / Constellation Brands, Inc. | 0.00 | -100.00 | 0.00 | 0.0000 | |||||
| UPS / United Parcel Service, Inc. | 0.00 | -100.00 | 0.00 | 0.0000 | |||||
| SLP / Simulations Plus, Inc. | 0.00 | -100.00 | 0.00 | 0.0000 | |||||
| CEF / Sprott Physical Gold and Silver Trust | 0.00 | -100.00 | 0.00 | 0.0000 | |||||
| LYB / LyondellBasell Industries N.V. | 0.00 | -100.00 | 0.00 | 0.0000 | |||||
| CPT / Camden Property Trust | 0.00 | -100.00 | 0.00 | 0.0000 | |||||
| BHP / BHP Group Limited - Depositary Receipt (Common Stock) | 0.00 | -100.00 | 0.00 | 0.0000 | |||||
| NXPI / NXP Semiconductors N.V. | 0.00 | -100.00 | 0.00 | 0.0000 | |||||
| WKC / World Kinect Corporation | 0.00 | -100.00 | 0.00 | 0.0000 | |||||
| FIBK / First Interstate BancSystem, Inc. | 0.00 | -100.00 | 0.00 | 0.0000 | |||||
| AB / AllianceBernstein Holding L.P. - Limited Partnership | 0.00 | -100.00 | 0.00 | 0.0000 | |||||
| NEM / Newmont Corporation | 0.00 | -100.00 | 0.00 | 0.0000 |