Statistik Asas
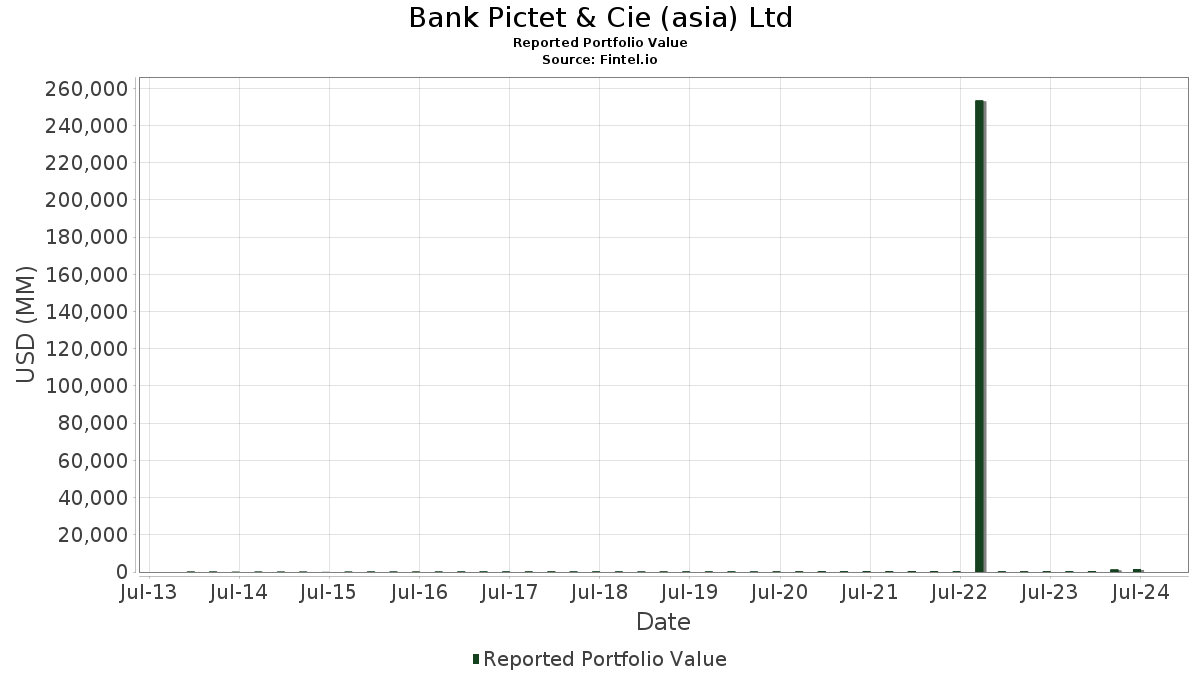
| Nilai Portfolio | $ 1,573,756,394 |
| Kedudukan Semasa | 101 |
Pegangan Terkini, Prestasi, AUM (dari 13F, 13D)
Bank Pictet & Cie (asia) Ltd telah mendedahkan 101 jumlah pegangan dalam pemfailan SEC terkini mereka. Nilai portfolio terkini dikira sebagai $ 1,573,756,394 USD. Aset Sebenar Di Bawah Pengurusan (AUM) ialah nilai ini ditambah dengan tunai (yang tidak didedahkan). Pegangan teratas Bank Pictet & Cie (asia) Ltd ialah Tesla, Inc. (US:TSLA) , Tesla, Inc. (US:TSLA) , PDD Holdings Inc. - Depositary Receipt (Common Stock) (US:PDD) , NVIDIA Corporation (US:NVDA) , and Amazon.com, Inc. (US:AMZN) . Kedudukan baharu Bank Pictet & Cie (asia) Ltd termasuk Robinhood Markets, Inc. (US:HOOD) , O'Reilly Automotive, Inc. (US:ORLY) , MakeMyTrip Limited (US:MMYT) , Workday, Inc. (US:WDAY) , and Vertex, Inc. (US:VERX) .
Kenaikan Teratas Suku Tahun Ini
Kami menggunakan perubahan dalam peruntukan portfolio kerana ini adalah metrik yang paling bermakna. Perubahan boleh disebabkan oleh perdagangan atau perubahan dalam harga saham.
| Sekuriti | Saham (MM) |
Nilai (MM$) |
Portfolio % | ΔPortfolio % |
|---|---|---|---|---|
| 0.65 | 86.55 | 5.4996 | 5.4996 | |
| 0.40 | 49.76 | 3.1620 | 1.8471 | |
| 0.07 | 12.75 | 0.8099 | 0.2109 | |
| 0.10 | 20.23 | 1.2854 | 0.1236 | |
| 0.07 | 1.54 | 0.0981 | 0.0981 | |
| 0.01 | 4.23 | 0.2691 | 0.0892 | |
| 0.03 | 6.41 | 0.4074 | 0.0816 | |
| 0.01 | 5.62 | 0.3571 | 0.0690 | |
| 0.04 | 6.50 | 0.4131 | 0.0639 | |
| 0.05 | 9.46 | 0.6013 | 0.0606 |
Penurunan Teratas Suku Tahun Ini
Kami menggunakan perubahan dalam peruntukan portfolio kerana ini adalah metrik yang paling bermakna. Perubahan boleh disebabkan oleh perdagangan atau perubahan dalam harga saham.
| Sekuriti | Saham (MM) |
Nilai (MM$) |
Portfolio % | ΔPortfolio % |
|---|---|---|---|---|
| 3.76 | 744.33 | 47.2961 | -3.9754 | |
| 2.40 | 474.91 | 30.1770 | -2.5495 | |
| 0.03 | 18.78 | 1.1934 | -0.2068 | |
| 0.00 | 0.00 | -0.1581 | ||
| 0.05 | 2.02 | 0.1281 | -0.1234 | |
| 0.01 | 1.32 | 0.0840 | -0.1209 | |
| 0.03 | 7.07 | 0.4490 | -0.0831 | |
| 0.00 | 0.00 | -0.0723 | ||
| 0.01 | 3.72 | 0.2362 | -0.0601 | |
| 0.01 | 3.45 | 0.2190 | -0.0563 |
13F dan Pemfailan Dana
Borang ini telah difailkan pada 2024-07-16 untuk tempoh pelaporan 2024-06-30. Klik ikon pautan untuk melihat sejarah transaksi penuh.
Tingkatkan untuk membuka data premium dan eksport ke Excel ![]() .
.
| Sekuriti | Jenis | Purata Harga Saham | Saham (MM) |
ΔSaham (%) |
ΔSaham (%) |
Nilai ($MM) |
Portfolio (%) |
ΔPortfolio (%) |
|
|---|---|---|---|---|---|---|---|---|---|
| TSLA / Tesla, Inc. | Put | 3.76 | 0.04 | 744.33 | 12.61 | 47.2961 | -3.9754 | ||
| TSLA / Tesla, Inc. | Call | 2.40 | 0.00 | 474.91 | 12.57 | 30.1770 | -2.5495 | ||
| PDD / PDD Holdings Inc. - Depositary Receipt (Common Stock) | 0.65 | 86.55 | 5.4996 | 5.4996 | |||||
| NVDA / NVIDIA Corporation | Call | 0.40 | 2,047.12 | 49.76 | 193.58 | 3.1620 | 1.8471 | ||
| AMZN / Amazon.com, Inc. | 0.10 | 26.07 | 20.23 | 35.07 | 1.2854 | 0.1236 | |||
| SPY / SPDR S&P 500 ETF | 0.03 | 0.00 | 18.78 | 4.04 | 1.1934 | -0.2068 | |||
| GOOG / Alphabet Inc. | 0.07 | 37.00 | 12.75 | 65.04 | 0.8099 | 0.2109 | |||
| MSFT / Microsoft Corporation | 0.02 | 9.15 | 10.76 | 16.02 | 0.6836 | -0.0357 | |||
| GOOGL / Alphabet Inc. | 0.05 | 12.50 | 9.46 | 35.77 | 0.6013 | 0.0606 | |||
| PEP / PepsiCo, Inc. | 0.05 | 22.83 | 8.52 | 15.76 | 0.5411 | -0.0295 | |||
| TSM / Taiwan Semiconductor Manufacturing Company Limited - Depositary Receipt (Common Stock) | 0.05 | 0.32 | 8.08 | 28.16 | 0.5136 | 0.0244 | |||
| MCD / McDonald's Corporation | 0.03 | 13.97 | 7.07 | 3.00 | 0.4490 | -0.0831 | |||
| ZTS / Zoetis Inc. | 0.04 | 40.98 | 6.50 | 44.47 | 0.4131 | 0.0639 | |||
| TXN / Texas Instruments Incorporated | 0.03 | 36.71 | 6.41 | 52.64 | 0.4074 | 0.0816 | |||
| WM / Waste Management, Inc. | 0.03 | 37.38 | 6.15 | 37.49 | 0.3911 | 0.0439 | |||
| MA / Mastercard Incorporated | 0.01 | 24.24 | 5.87 | 13.81 | 0.3728 | -0.0271 | |||
| UNH / UnitedHealth Group Incorporated | 0.01 | 46.99 | 5.62 | 51.32 | 0.3571 | 0.0690 | |||
| MRK / Merck & Co., Inc. | 0.04 | 13.38 | 4.78 | 6.39 | 0.3037 | -0.0448 | |||
| NVDA / NVIDIA Corporation | 0.04 | 917.39 | 4.71 | 39.12 | 0.2990 | 0.0366 | |||
| V / Visa Inc. | 0.02 | 10.15 | 4.47 | 3.59 | 0.2840 | -0.0507 | |||
| ADBE / Adobe Inc. | 0.01 | 65.84 | 4.23 | 82.58 | 0.2691 | 0.0892 | |||
| META / Meta Platforms, Inc. | 0.01 | -6.27 | 3.72 | -2.67 | 0.2362 | -0.0601 | |||
| MCO / Moody's Corporation | 0.01 | 4.22 | 3.67 | 11.63 | 0.2330 | -0.0218 | |||
| NKE / NIKE, Inc. | 0.05 | 23.65 | 3.56 | -0.84 | 0.2264 | -0.0523 | |||
| TMO / Thermo Fisher Scientific Inc. | 0.01 | 4.22 | 3.55 | -0.84 | 0.2256 | -0.0521 | |||
| LIN / Linde plc | 0.01 | 2.76 | 3.45 | -2.90 | 0.2190 | -0.0563 | |||
| EL / The Estée Lauder Companies Inc. | 0.03 | 68.47 | 3.05 | 16.30 | 0.1941 | -0.0097 | |||
| BKNG / Booking Holdings Inc. | 0.00 | 4.36 | 2.84 | 13.99 | 0.1807 | -0.0129 | |||
| ICE / Intercontinental Exchange, Inc. | 0.02 | 4.75 | 2.80 | 4.32 | 0.1782 | -0.0303 | |||
| ABT / Abbott Laboratories | 0.02 | 4.99 | 2.42 | -4.05 | 0.1535 | -0.0417 | |||
| NTR / Nutrien Ltd. | Call | 0.04 | 0.00 | 2.21 | -5.35 | 0.1406 | -0.0407 | ||
| OTIS / Otis Worldwide Corporation | 0.02 | 4.72 | 2.06 | 1.58 | 0.1307 | -0.0264 | |||
| EXAS / Exact Sciences Corporation | 0.05 | 1.63 | 2.02 | -37.85 | 0.1281 | -0.1234 | |||
| WFC / Wells Fargo & Company | 0.03 | 3.75 | 2.01 | 6.30 | 0.1276 | -0.0189 | |||
| HOOD / Robinhood Markets, Inc. | Put | 0.07 | 1.54 | 0.0981 | 0.0981 | ||||
| HDB / HDFC Bank Limited - Depositary Receipt (Common Stock) | 0.02 | 4.78 | 1.47 | 20.44 | 0.0936 | -0.0013 | |||
| GJR / Strats Trust For Procter & Gambel Security - Preferred Security | 0.01 | -9.28 | 1.46 | -7.77 | 0.0928 | -0.0301 | |||
| DHI / D.R. Horton, Inc. | 0.01 | 278.66 | 1.37 | 224.64 | 0.0871 | 0.0543 | |||
| CRM / Salesforce, Inc. | 0.01 | -41.38 | 1.32 | -49.94 | 0.0840 | -0.1209 | |||
| LLY / Eli Lilly and Company | 0.00 | 1.20 | 1.30 | 17.72 | 0.0828 | -0.0030 | |||
| HON / Honeywell International Inc. | 0.01 | 40.73 | 1.13 | 46.50 | 0.0719 | 0.0120 | |||
| GOOG / Alphabet Inc. | Call | 0.01 | 0.00 | 1.08 | 20.49 | 0.0688 | -0.0009 | ||
| AAPL / Apple Inc. | 0.01 | 30.38 | 1.06 | 60.24 | 0.0677 | 0.0161 | |||
| AVGO / Broadcom Inc. | 0.00 | 27.35 | 0.98 | 54.42 | 0.0622 | 0.0130 | |||
| EA / Electronic Arts Inc. | 0.01 | 4.63 | 0.94 | 9.93 | 0.0598 | -0.0066 | |||
| IBN / ICICI Bank Limited - Depositary Receipt (Common Stock) | 0.03 | 10.70 | 0.86 | 20.76 | 0.0547 | -0.0006 | |||
| ROL / Rollins, Inc. | 0.02 | 0.00 | 0.86 | 5.41 | 0.0546 | -0.0086 | |||
| ORLY / O'Reilly Automotive, Inc. | 0.00 | 0.80 | 0.0509 | 0.0509 | |||||
| AMD / Advanced Micro Devices, Inc. | 0.00 | 56.11 | 0.78 | 40.25 | 0.0494 | 0.0064 | |||
| MMYT / MakeMyTrip Limited | 0.01 | 0.77 | 0.0491 | 0.0491 | |||||
| MOS / The Mosaic Company | Call | 0.03 | -13.79 | 0.72 | -23.27 | 0.0459 | -0.0271 | ||
| ASML / ASML Holding N.V. - Depositary Receipt (Common Stock) | 0.00 | 71.17 | 0.67 | 80.43 | 0.0428 | 0.0138 | |||
| NFLX / Netflix, Inc. | 0.00 | 64.94 | 0.67 | 83.47 | 0.0424 | 0.0141 | |||
| AMZN / Amazon.com, Inc. | Call | 0.00 | 0.00 | 0.58 | 7.02 | 0.0368 | -0.0051 | ||
| NEOG / Neogen Corporation | 0.04 | 0.00 | 0.55 | -1.08 | 0.0348 | -0.0081 | |||
| TSLA / Tesla, Inc. | 0.00 | 64.74 | 0.52 | 85.36 | 0.0330 | 0.0113 | |||
| INDA / iShares Trust - iShares MSCI India ETF | 0.01 | 0.00 | 0.48 | 8.14 | 0.0304 | -0.0039 | |||
| AMAT / Applied Materials, Inc. | 0.00 | 0.00 | 0.41 | 14.36 | 0.0264 | -0.0017 | |||
| LRCX / Lam Research Corporation | 0.00 | 0.00 | 0.40 | 9.56 | 0.0255 | -0.0029 | |||
| PKG / Packaging Corporation of America | 0.00 | 0.00 | 0.40 | -3.85 | 0.0254 | -0.0068 | |||
| EXPE / Expedia Group, Inc. | 0.00 | 41.95 | 0.40 | 29.55 | 0.0254 | 0.0015 | |||
| AFL / Aflac Incorporated | 0.00 | 0.00 | 0.39 | 4.00 | 0.0248 | -0.0043 | |||
| WDAY / Workday, Inc. | 0.00 | 0.39 | 0.0248 | 0.0248 | |||||
| VERX / Vertex, Inc. | 0.01 | 0.39 | 0.0247 | 0.0247 | |||||
| AMP / Ameriprise Financial, Inc. | 0.00 | 0.00 | 0.38 | -2.57 | 0.0241 | -0.0061 | |||
| SCHW / The Charles Schwab Corporation | 0.01 | 0.00 | 0.38 | 1.88 | 0.0241 | -0.0048 | |||
| ADSK / Autodesk, Inc. | 0.00 | 0.00 | 0.38 | -5.05 | 0.0239 | -0.0068 | |||
| NVR / NVR, Inc. | 0.00 | 0.00 | 0.37 | -6.31 | 0.0236 | -0.0072 | |||
| MS / Morgan Stanley | 0.00 | 0.00 | 0.37 | 3.08 | 0.0234 | -0.0043 | |||
| ELV / Elevance Health, Inc. | 0.00 | 0.00 | 0.36 | 4.62 | 0.0230 | -0.0039 | |||
| DXCM / DexCom, Inc. | 0.00 | 0.00 | 0.36 | -18.22 | 0.0228 | -0.0113 | |||
| TJX / The TJX Companies, Inc. | 0.00 | 0.00 | 0.36 | 8.48 | 0.0228 | -0.0028 | |||
| PM / Philip Morris International Inc. | 0.00 | 0.00 | 0.35 | 10.66 | 0.0225 | -0.0023 | |||
| HUM / Humana Inc. | 0.00 | 0.00 | 0.35 | 8.02 | 0.0222 | -0.0030 | |||
| MU / Micron Technology, Inc. | 0.00 | 39.88 | 0.35 | 56.50 | 0.0222 | 0.0048 | |||
| MAR / Marriott International, Inc. | 0.00 | 0.00 | 0.35 | -4.14 | 0.0221 | -0.0060 | |||
| PANW / Palo Alto Networks, Inc. | 0.00 | 0.35 | 0.0220 | 0.0220 | |||||
| LOW / Lowe's Companies, Inc. | 0.00 | -39.02 | 0.34 | -47.24 | 0.0219 | -0.0287 | |||
| MDLZ / Mondelez International, Inc. | 0.01 | 0.00 | 0.34 | -6.52 | 0.0219 | -0.0067 | |||
| UNP / Union Pacific Corporation | 0.00 | 0.00 | 0.34 | -8.15 | 0.0215 | -0.0070 | |||
| WYNN / Wynn Resorts, Limited | 0.00 | 0.00 | 0.34 | -12.50 | 0.0214 | -0.0084 | |||
| PSTG / Pure Storage, Inc. | 0.01 | 0.34 | 0.0213 | 0.0213 | |||||
| BIIB / Biogen Inc. | 0.00 | 0.00 | 0.33 | 7.40 | 0.0213 | -0.0029 | |||
| DG / Dollar General Corporation | 0.00 | 0.00 | 0.33 | -15.27 | 0.0212 | -0.0093 | |||
| ABNB / Airbnb, Inc. | 0.00 | 0.00 | 0.33 | -8.17 | 0.0207 | -0.0068 | |||
| WH / Wyndham Hotels & Resorts, Inc. | 0.00 | 0.00 | 0.32 | -3.31 | 0.0204 | -0.0054 | |||
| JNJ / Johnson & Johnson | 0.00 | 0.00 | 0.32 | -7.56 | 0.0202 | -0.0065 | |||
| TROW / T. Rowe Price Group, Inc. | 0.00 | 0.00 | 0.32 | -5.37 | 0.0202 | -0.0059 | |||
| TGT / Target Corporation | 0.00 | 0.00 | 0.31 | -16.53 | 0.0196 | -0.0091 | |||
| EXPD / Expeditors International of Washington, Inc. | 0.00 | 0.00 | 0.31 | 2.69 | 0.0194 | -0.0037 | |||
| VRSN / VeriSign, Inc. | 0.00 | 0.00 | 0.30 | -6.17 | 0.0193 | -0.0058 | |||
| ROK / Rockwell Automation, Inc. | 0.00 | 0.00 | 0.30 | -5.64 | 0.0192 | -0.0056 | |||
| ACN / Accenture plc | 0.00 | 0.00 | 0.29 | -12.42 | 0.0184 | -0.0073 | |||
| ETSY / Etsy, Inc. | 0.00 | -21.66 | 0.28 | -32.69 | 0.0178 | -0.0145 | |||
| JPM / JPMorgan Chase & Co. | 0.00 | 0.00 | 0.28 | 1.09 | 0.0177 | -0.0037 | |||
| PYPL / PayPal Holdings, Inc. | 0.00 | 0.00 | 0.27 | -13.23 | 0.0171 | -0.0070 | |||
| SLB / Schlumberger Limited | 0.01 | 0.00 | 0.25 | -13.90 | 0.0162 | -0.0068 | |||
| INFY / Infosys Limited - Depositary Receipt (Common Stock) | 0.01 | 0.25 | 0.0158 | 0.0158 | |||||
| SOPH / SOPHiA GENETICS SA | 0.05 | 0.00 | 0.21 | -7.08 | 0.0134 | -0.0042 | |||
| EOG / EOG Resources, Inc. | 0.00 | 0.21 | 0.0131 | 0.0131 | |||||
| VNM / VanEck ETF Trust - VanEck Vietnam ETF | 0.01 | -11.03 | 0.13 | -22.29 | 0.0082 | -0.0047 | |||
| PYPL / PayPal Holdings, Inc. | Call | 0.00 | -100.00 | 0.00 | -100.00 | -0.0422 | |||
| EXAS / Exact Sciences Corporation | Call | 0.00 | -100.00 | 0.00 | -100.00 | -0.1581 | |||
| QCOM / QUALCOMM Incorporated | 0.00 | -100.00 | 0.00 | 0.0000 | |||||
| XLE / The Select Sector SPDR Trust - The Energy Select Sector SPDR Fund | 0.00 | -100.00 | 0.00 | -100.00 | -0.0359 | ||||
| DHR / Danaher Corporation | 0.00 | -100.00 | 0.00 | -100.00 | -0.0723 | ||||
| CVX / Chevron Corporation | 0.00 | -100.00 | 0.00 | 0.0000 | |||||
| CI / The Cigna Group | 0.00 | -100.00 | 0.00 | 0.0000 | |||||
| MDT / Medtronic plc | 0.00 | -100.00 | 0.00 | 0.0000 | |||||
| LYFT / Lyft, Inc. | Call | 0.00 | -100.00 | 0.00 | 0.0000 | ||||
| NFLX / Netflix, Inc. | Call | 0.00 | -100.00 | 0.00 | -100.00 | -0.0292 |