Statistik Asas
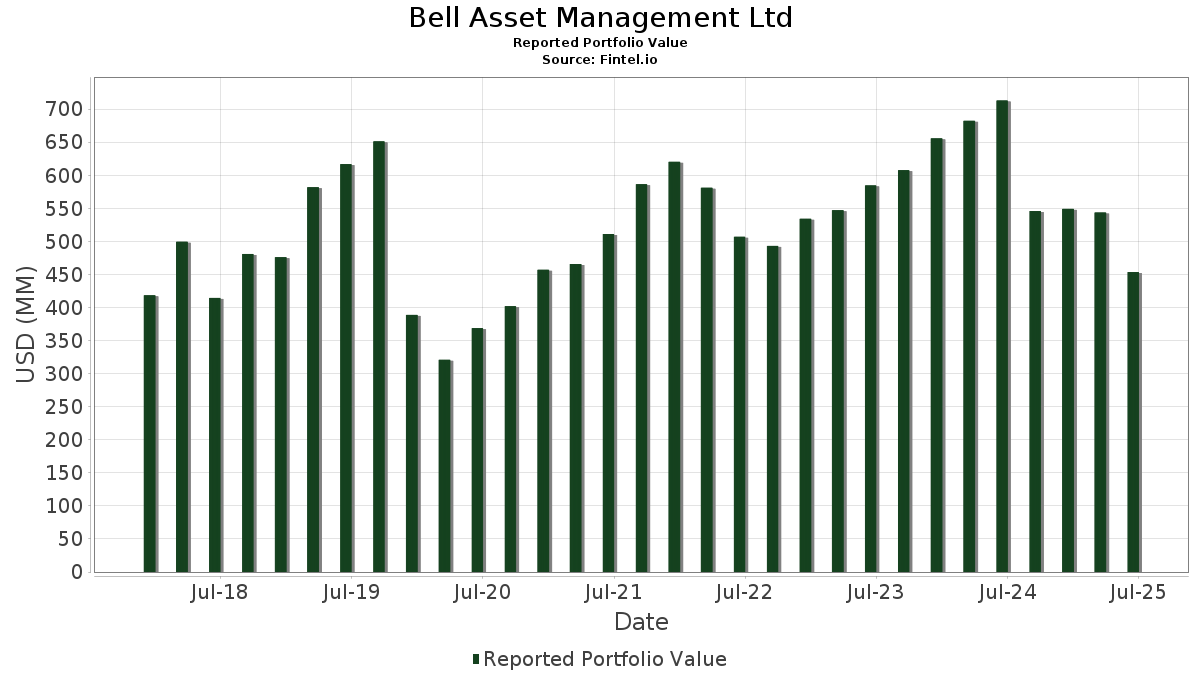
| Nilai Portfolio | $ 453,542,009 |
| Kedudukan Semasa | 62 |
Pegangan Terkini, Prestasi, AUM (dari 13F, 13D)
Bell Asset Management Ltd telah mendedahkan 62 jumlah pegangan dalam pemfailan SEC terkini mereka. Nilai portfolio terkini dikira sebagai $ 453,542,009 USD. Aset Sebenar Di Bawah Pengurusan (AUM) ialah nilai ini ditambah dengan tunai (yang tidak didedahkan). Pegangan teratas Bell Asset Management Ltd ialah NVIDIA Corporation (US:NVDA) , Microsoft Corporation (US:MSFT) , Alphabet Inc. (US:GOOGL) , Amazon.com, Inc. (US:AMZN) , and Apple Inc. (US:AAPL) . Kedudukan baharu Bell Asset Management Ltd termasuk Old Dominion Freight Line, Inc. (US:ODFL) , Deckers Outdoor Corporation (US:DECK) , Brown-Forman Corp. - Class B (US:BFB) , .
Kenaikan Teratas Suku Tahun Ini
Kami menggunakan perubahan dalam peruntukan portfolio kerana ini adalah metrik yang paling bermakna. Perubahan boleh disebabkan oleh perdagangan atau perubahan dalam harga saham.
| Sekuriti | Saham (MM) |
Nilai (MM$) |
Portfolio % | ΔPortfolio % |
|---|---|---|---|---|
| 0.22 | 34.91 | 7.6973 | 1.6065 | |
| 0.02 | 6.31 | 1.3907 | 1.3907 | |
| 0.01 | 4.76 | 1.0501 | 1.0501 | |
| 0.03 | 4.62 | 1.0194 | 1.0194 | |
| 0.09 | 19.26 | 4.2459 | 1.0018 | |
| 0.04 | 4.30 | 0.9492 | 0.9492 | |
| 0.02 | 13.61 | 3.0009 | 0.9250 | |
| 0.15 | 3.92 | 0.8638 | 0.8638 | |
| 0.03 | 8.93 | 1.9688 | 0.8588 | |
| 0.04 | 8.26 | 1.8220 | 0.6131 |
Penurunan Teratas Suku Tahun Ini
Kami menggunakan perubahan dalam peruntukan portfolio kerana ini adalah metrik yang paling bermakna. Perubahan boleh disebabkan oleh perdagangan atau perubahan dalam harga saham.
| Sekuriti | Saham (MM) |
Nilai (MM$) |
Portfolio % | ΔPortfolio % |
|---|---|---|---|---|
| 0.00 | 2.10 | 0.4621 | -1.1246 | |
| 0.03 | 8.73 | 1.9247 | -0.5760 | |
| 0.03 | 5.06 | 1.1157 | -0.5670 | |
| 0.07 | 8.66 | 1.9094 | -0.4014 | |
| 0.01 | 7.15 | 1.5764 | -0.2967 | |
| 0.02 | 7.08 | 1.5618 | -0.2887 | |
| 0.02 | 3.65 | 0.8040 | -0.2879 | |
| 0.01 | 2.95 | 0.6497 | -0.2791 | |
| 0.01 | 4.03 | 0.8887 | -0.2488 | |
| 0.06 | 3.90 | 0.8606 | -0.2322 |
13F dan Pemfailan Dana
Borang ini telah difailkan pada 2025-08-13 untuk tempoh pelaporan 2025-06-30. Klik ikon pautan untuk melihat sejarah transaksi penuh.
Tingkatkan untuk membuka data premium dan eksport ke Excel ![]() .
.
| Sekuriti | Jenis | Purata Harga Saham | Saham (MM) |
ΔSaham (%) |
ΔSaham (%) |
Nilai ($MM) |
Portfolio (%) |
ΔPortfolio (%) |
|
|---|---|---|---|---|---|---|---|---|---|
| NVDA / NVIDIA Corporation | 0.22 | -27.66 | 34.91 | 5.45 | 7.6973 | 1.6065 | |||
| MSFT / Microsoft Corporation | 0.06 | -37.79 | 31.17 | -17.56 | 6.8736 | -0.0838 | |||
| GOOGL / Alphabet Inc. | 0.17 | -21.64 | 29.44 | -10.70 | 6.4902 | 0.4257 | |||
| AMZN / Amazon.com, Inc. | 0.11 | -21.48 | 23.59 | -9.46 | 5.2019 | 0.4077 | |||
| AAPL / Apple Inc. | 0.09 | 18.24 | 19.26 | 9.21 | 4.2459 | 1.0018 | |||
| META / Meta Platforms, Inc. | 0.02 | -5.81 | 13.61 | 20.62 | 3.0009 | 0.9250 | |||
| AON / Aon plc | 0.03 | 65.57 | 8.93 | 48.00 | 1.9688 | 0.8588 | |||
| AVGO / Broadcom Inc. | 0.03 | -40.30 | 8.86 | -1.71 | 1.9542 | 0.2952 | |||
| LLY / Eli Lilly and Company | 0.01 | 8.37 | 8.85 | 2.28 | 1.9515 | 0.3595 | |||
| FI / Fiserv, Inc. | 0.05 | 3.06 | 8.80 | -19.54 | 1.9398 | -0.0719 | |||
| UNH / UnitedHealth Group Incorporated | 0.03 | 7.82 | 8.73 | -35.78 | 1.9247 | -0.5760 | |||
| PEP / PepsiCo, Inc. | 0.07 | -21.70 | 8.66 | -31.05 | 1.9094 | -0.4014 | |||
| ORCL / Oracle Corporation | 0.04 | -39.82 | 8.44 | -5.90 | 1.8603 | 0.2108 | |||
| MMC / Marsh & McLennan Companies, Inc. | 0.04 | 40.37 | 8.26 | 25.77 | 1.8220 | 0.6131 | |||
| ACN / Accenture plc | 0.02 | -21.70 | 7.45 | -25.00 | 1.6417 | -0.1848 | |||
| UBER / Uber Technologies, Inc. | 0.08 | -28.03 | 7.30 | -7.84 | 1.6092 | 0.1523 | |||
| MA / Mastercard Incorporated | 0.01 | -31.50 | 7.15 | -29.77 | 1.5764 | -0.2967 | |||
| V / Visa Inc. | 0.02 | -30.48 | 7.08 | -29.58 | 1.5618 | -0.2887 | |||
| TSM / Taiwan Semiconductor Manufacturing Company Limited - Depositary Receipt (Common Stock) | 0.03 | -33.93 | 6.64 | -9.85 | 1.4630 | 0.1089 | |||
| MSI / Motorola Solutions, Inc. | 0.02 | 6.31 | 1.3907 | 1.3907 | |||||
| MSCI / MSCI Inc. | 0.01 | 8.96 | 6.29 | 11.13 | 1.3875 | 0.3456 | |||
| CLH / Clean Harbors, Inc. | 0.03 | -31.65 | 6.02 | -19.84 | 1.3283 | -0.0543 | |||
| SCI / Service Corporation International | 0.07 | -10.99 | 5.89 | -9.65 | 1.2979 | 0.0991 | |||
| COR / Cencora, Inc. | 0.02 | -6.72 | 5.87 | 0.58 | 1.2952 | 0.2206 | |||
| ANET / Arista Networks Inc | 0.06 | -33.22 | 5.79 | -11.83 | 1.2767 | 0.0685 | |||
| WMS / Advanced Drainage Systems, Inc. | 0.05 | -21.66 | 5.71 | -17.18 | 1.2584 | -0.0095 | |||
| VRRM / Verra Mobility Corporation | 0.22 | -21.25 | 5.53 | -11.17 | 1.2186 | 0.0739 | |||
| HLI / Houlihan Lokey, Inc. | 0.03 | -29.91 | 5.52 | -21.91 | 1.2168 | -0.0832 | |||
| CNM / Core & Main, Inc. | 0.09 | -32.56 | 5.19 | -15.76 | 1.1433 | 0.0109 | |||
| KEYS / Keysight Technologies, Inc. | 0.03 | -3.58 | 5.13 | 5.49 | 1.1304 | 0.2363 | |||
| PCTY / Paylocity Holding Corporation | 0.03 | 29.44 | 5.10 | 25.19 | 1.1255 | 0.3753 | |||
| HCA / HCA Healthcare, Inc. | 0.01 | -30.48 | 5.10 | -22.92 | 1.1248 | -0.0929 | |||
| QCOM / QUALCOMM Incorporated | 0.03 | -46.64 | 5.06 | -44.68 | 1.1157 | -0.5670 | |||
| TTC / The Toro Company | 0.07 | -18.57 | 5.03 | -20.88 | 1.1089 | -0.0607 | |||
| SNPS / Synopsys, Inc. | 0.01 | -21.34 | 4.93 | -5.96 | 1.0861 | 0.1224 | |||
| ZTS / Zoetis Inc. | 0.03 | -21.61 | 4.88 | -25.76 | 1.0753 | -0.1332 | |||
| MANH / Manhattan Associates, Inc. | 0.02 | -21.09 | 4.82 | -9.95 | 1.0632 | 0.0780 | |||
| IT / Gartner, Inc. | 0.01 | 4.76 | 1.0501 | 1.0501 | |||||
| TSCO / Tractor Supply Company | 0.09 | -25.21 | 4.75 | -28.38 | 1.0470 | -0.1727 | |||
| SPGI / S&P Global Inc. | 0.01 | -21.25 | 4.73 | -18.28 | 1.0432 | -0.0220 | |||
| ODFL / Old Dominion Freight Line, Inc. | 0.03 | 4.62 | 1.0194 | 1.0194 | |||||
| G / Genpact Limited | 0.10 | 9.51 | 4.59 | -4.33 | 1.0128 | 0.1294 | |||
| CAT / Caterpillar Inc. | 0.01 | -21.03 | 4.59 | -7.04 | 1.0127 | 0.1037 | |||
| BR / Broadridge Financial Solutions, Inc. | 0.02 | -16.37 | 4.47 | -16.18 | 0.9848 | 0.0045 | |||
| HD / The Home Depot, Inc. | 0.01 | -21.69 | 4.38 | -21.66 | 0.9665 | -0.0630 | |||
| BJ / BJ's Wholesale Club Holdings, Inc. | 0.04 | 2.01 | 4.32 | -3.61 | 0.9531 | 0.1281 | |||
| DECK / Deckers Outdoor Corporation | 0.04 | 4.30 | 0.9492 | 0.9492 | |||||
| POOL / Pool Corporation | 0.01 | -6.84 | 4.25 | -14.70 | 0.9377 | 0.0204 | |||
| IDXX / IDEXX Laboratories, Inc. | 0.01 | -48.96 | 4.03 | -34.81 | 0.8887 | -0.2488 | |||
| JKHY / Jack Henry & Associates, Inc. | 0.02 | 3.97 | 3.96 | 2.59 | 0.8738 | 0.1630 | |||
| TMO / Thermo Fisher Scientific Inc. | 0.01 | 5.27 | 3.95 | -14.21 | 0.8707 | 0.0237 | |||
| BFB / Brown-Forman Corp. - Class B | 0.15 | 3.92 | 0.8638 | 0.8638 | |||||
| CSCO / Cisco Systems, Inc. | 0.06 | -41.55 | 3.90 | -34.28 | 0.8606 | -0.2322 | |||
| AXP / American Express Company | 0.01 | -40.78 | 3.78 | -29.81 | 0.8329 | -0.1571 | |||
| MTD / Mettler-Toledo International Inc. | 0.00 | -21.18 | 3.70 | -21.60 | 0.8164 | -0.0524 | |||
| VEEV / Veeva Systems Inc. | 0.01 | -35.02 | 3.69 | -19.23 | 0.8131 | -0.0268 | |||
| JNJ / Johnson & Johnson | 0.02 | -33.30 | 3.65 | -38.56 | 0.8040 | -0.2879 | |||
| MCO / Moody's Corporation | 0.01 | -21.70 | 3.53 | -15.68 | 0.7780 | 0.0082 | |||
| LULU / lululemon athletica inc. | 0.01 | -30.46 | 2.95 | -41.64 | 0.6497 | -0.2791 | |||
| COST / Costco Wholesale Corporation | 0.00 | -22.20 | 2.82 | -18.57 | 0.6218 | -0.0154 | |||
| AMGN / Amgen Inc. | 0.01 | -7.15 | 2.50 | -16.79 | 0.5518 | -0.0015 | |||
| BKNG / Booking Holdings Inc. | 0.00 | -80.66 | 2.10 | -75.71 | 0.4621 | -1.1246 | |||
| ZBRA / Zebra Technologies Corporation | 0.00 | -100.00 | 0.00 | 0.0000 | |||||
| KO / The Coca-Cola Company | 0.00 | -100.00 | 0.00 | 0.0000 | |||||
| PPG / PPG Industries, Inc. | 0.00 | -100.00 | 0.00 | 0.0000 | |||||
| NFLX / Netflix, Inc. | 0.00 | -100.00 | 0.00 | 0.0000 | |||||
| YETI / YETI Holdings, Inc. | 0.00 | -100.00 | 0.00 | 0.0000 | |||||
| ADBE / Adobe Inc. | 0.00 | -100.00 | 0.00 | 0.0000 | |||||
| EW / Edwards Lifesciences Corporation | 0.00 | -100.00 | 0.00 | 0.0000 | |||||
| ADP / Automatic Data Processing, Inc. | 0.00 | -100.00 | 0.00 | 0.0000 | |||||
| ROK / Rockwell Automation, Inc. | 0.00 | -100.00 | 0.00 | 0.0000 |