Statistik Asas
| Nilai Portfolio | $ 441,434,242 |
| Kedudukan Semasa | 125 |
Pegangan Terkini, Prestasi, AUM (dari 13F, 13D)
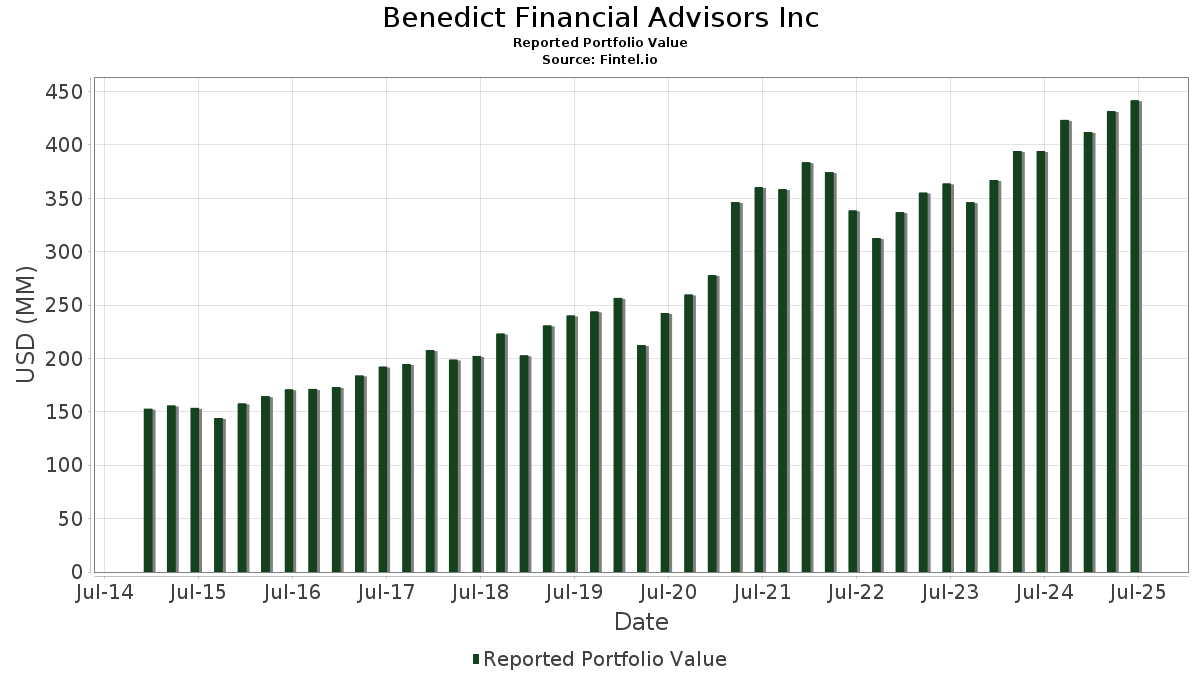
Benedict Financial Advisors Inc telah mendedahkan 125 jumlah pegangan dalam pemfailan SEC terkini mereka. Nilai portfolio terkini dikira sebagai $ 441,434,242 USD. Aset Sebenar Di Bawah Pengurusan (AUM) ialah nilai ini ditambah dengan tunai (yang tidak didedahkan). Pegangan teratas Benedict Financial Advisors Inc ialah Apple Inc. (US:AAPL) , Microsoft Corporation (US:MSFT) , SPDR Series Trust - SPDR Bloomberg 1-3 Month T-Bill ETF (US:BIL) , Altria Group, Inc. (US:MO) , and Philip Morris International Inc. (US:PM) . Kedudukan baharu Benedict Financial Advisors Inc termasuk Sprott Inc. (US:SII) , .
Kenaikan Teratas Suku Tahun Ini
Kami menggunakan perubahan dalam peruntukan portfolio kerana ini adalah metrik yang paling bermakna. Perubahan boleh disebabkan oleh perdagangan atau perubahan dalam harga saham.
| Sekuriti | Saham (MM) |
Nilai (MM$) |
Portfolio % | ΔPortfolio % |
|---|---|---|---|---|
| 0.03 | 9.00 | 1.9897 | 1.4734 | |
| 0.04 | 18.17 | 4.0154 | 0.7710 | |
| 0.06 | 6.62 | 1.4641 | 0.4887 | |
| 0.01 | 1.69 | 0.3744 | 0.3744 | |
| 0.15 | 14.08 | 3.1116 | 0.1982 | |
| 0.07 | 12.99 | 2.8703 | 0.1911 | |
| 0.18 | 12.71 | 2.8097 | 0.1879 | |
| 0.06 | 1.57 | 0.3471 | 0.1861 | |
| 0.01 | 3.15 | 0.6968 | 0.1849 | |
| 0.02 | 2.49 | 0.5507 | 0.1624 |
Penurunan Teratas Suku Tahun Ini
Kami menggunakan perubahan dalam peruntukan portfolio kerana ini adalah metrik yang paling bermakna. Perubahan boleh disebabkan oleh perdagangan atau perubahan dalam harga saham.
| Sekuriti | Saham (MM) |
Nilai (MM$) |
Portfolio % | ΔPortfolio % |
|---|---|---|---|---|
| 0.09 | 19.04 | 4.2073 | -0.6198 | |
| 0.01 | 1.20 | 0.2647 | -0.4014 | |
| 0.03 | 9.32 | 2.0587 | -0.3317 | |
| 0.05 | 8.64 | 1.9092 | -0.3258 | |
| 0.06 | 9.52 | 2.1049 | -0.2757 | |
| 0.07 | 3.08 | 0.6811 | -0.2600 | |
| 0.02 | 7.66 | 1.6931 | -0.2345 | |
| 0.02 | 3.06 | 0.6764 | -0.2252 | |
| 0.22 | 13.02 | 2.8786 | -0.1999 | |
| 0.03 | 4.13 | 0.9126 | -0.1865 |
13F dan Pemfailan Dana
Borang ini telah difailkan pada 2025-08-13 untuk tempoh pelaporan 2025-06-30. Klik ikon pautan untuk melihat sejarah transaksi penuh.
Tingkatkan untuk membuka data premium dan eksport ke Excel ![]() .
.
| Sekuriti | Jenis | Purata Harga Saham | Saham (MM) |
ΔSaham (%) |
ΔSaham (%) |
Nilai ($MM) |
Portfolio (%) |
ΔPortfolio (%) |
|
|---|---|---|---|---|---|---|---|---|---|
| AAPL / Apple Inc. | 0.09 | -1.02 | 19.04 | -8.58 | 4.2073 | -0.6198 | |||
| MSFT / Microsoft Corporation | 0.04 | -2.03 | 18.17 | 29.82 | 4.0154 | 0.7710 | |||
| BIL / SPDR Series Trust - SPDR Bloomberg 1-3 Month T-Bill ETF | 0.15 | 12.03 | 14.08 | 12.02 | 3.1116 | 0.1982 | |||
| MO / Altria Group, Inc. | 0.22 | 0.40 | 13.02 | -1.93 | 2.8786 | -0.1999 | |||
| PM / Philip Morris International Inc. | 0.07 | -2.07 | 12.99 | 12.37 | 2.8703 | 0.1911 | |||
| CSCO / Cisco Systems, Inc. | 0.18 | -0.02 | 12.71 | 12.41 | 2.8097 | 0.1879 | |||
| RTX / RTX Corporation | 0.07 | -1.28 | 10.73 | 8.83 | 2.3717 | 0.0859 | |||
| JNJ / Johnson & Johnson | 0.06 | 0.69 | 9.52 | -7.25 | 2.1049 | -0.2757 | |||
| TRV / The Travelers Companies, Inc. | 0.04 | -0.83 | 9.52 | 0.32 | 2.1048 | -0.0958 | |||
| AMGN / Amgen Inc. | 0.03 | 0.79 | 9.32 | -9.66 | 2.0587 | -0.3317 | |||
| CBOE / Cboe Global Markets, Inc. | 0.03 | 235.40 | 9.00 | 304.22 | 1.9897 | 1.4734 | |||
| ABBV / AbbVie Inc. | 0.05 | 1.13 | 8.64 | -10.40 | 1.9092 | -0.3258 | |||
| CME / CME Group Inc. | 0.03 | 0.84 | 8.24 | 4.77 | 1.8209 | -0.0020 | |||
| V / Visa Inc. | 0.02 | -0.59 | 7.68 | 0.72 | 1.6974 | -0.0704 | |||
| BRK.B / Berkshire Hathaway Inc. | 0.02 | 1.01 | 7.66 | -7.88 | 1.6931 | -0.2345 | |||
| VZ / Verizon Communications Inc. | 0.17 | 0.51 | 7.43 | -4.12 | 1.6426 | -0.1543 | |||
| QCOM / QUALCOMM Incorporated | 0.04 | 1.26 | 6.66 | 4.98 | 1.4711 | 0.0014 | |||
| SYY / Sysco Corporation | 0.06 | 12.70 | 6.62 | 57.45 | 1.4641 | 0.4887 | |||
| MDT / Medtronic plc | 0.08 | 0.57 | 6.55 | -2.43 | 1.4485 | -0.1088 | |||
| MCD / McDonald's Corporation | 0.02 | 0.14 | 6.47 | -6.34 | 1.4294 | -0.1714 | |||
| HON / Honeywell International Inc. | 0.03 | 0.60 | 6.24 | 10.64 | 1.3791 | 0.0717 | |||
| DUK / Duke Energy Corporation | 0.05 | 0.29 | 5.71 | -2.98 | 1.2614 | -0.1023 | |||
| ADP / Automatic Data Processing, Inc. | 0.02 | -1.95 | 5.62 | -1.04 | 1.2425 | -0.0743 | |||
| GLW / Corning Incorporated | 0.11 | 0.13 | 5.54 | 15.02 | 1.2234 | 0.1078 | |||
| PG / The Procter & Gamble Company | 0.03 | -0.08 | 5.46 | -6.59 | 1.2070 | -0.1483 | |||
| KO / The Coca-Cola Company | 0.08 | -2.86 | 5.42 | -4.05 | 1.1984 | -0.1116 | |||
| LMT / Lockheed Martin Corporation | 0.01 | 1.27 | 5.28 | 4.99 | 1.1669 | 0.0011 | |||
| COR / Cencora, Inc. | 0.02 | -1.84 | 5.02 | 5.84 | 1.1095 | 0.0100 | |||
| HSY / The Hershey Company | 0.03 | 2.14 | 4.93 | -0.89 | 1.0888 | -0.0635 | |||
| EMR / Emerson Electric Co. | 0.04 | 0.14 | 4.84 | 21.77 | 1.0693 | 0.1483 | |||
| GIS / General Mills, Inc. | 0.09 | 3.33 | 4.80 | -10.45 | 1.0605 | -0.1818 | |||
| WMT / Walmart Inc. | 0.05 | -2.65 | 4.77 | 8.43 | 1.0545 | 0.0345 | |||
| AXP / American Express Company | 0.01 | 0.86 | 4.71 | 19.58 | 1.0668 | 0.1538 | |||
| KMI / Kinder Morgan, Inc. | 0.15 | 3.57 | 4.51 | 6.72 | 0.9967 | 0.0171 | |||
| ABT / Abbott Laboratories | 0.03 | -0.23 | 4.49 | 2.30 | 0.9918 | -0.0251 | |||
| SBUX / Starbucks Corporation | 0.05 | 1.40 | 4.29 | -5.28 | 0.9481 | -0.1018 | |||
| CVX / Chevron Corporation | 0.03 | 1.75 | 4.13 | -12.91 | 0.9126 | -0.1865 | |||
| AMZN / Amazon.com, Inc. | 0.02 | 3.63 | 4.02 | 19.51 | 0.8884 | 0.1086 | |||
| JPM / JPMorgan Chase & Co. | 0.01 | -1.93 | 3.88 | 15.90 | 0.8571 | 0.0814 | |||
| XLV / The Select Sector SPDR Trust - The Health Care Select Sector SPDR Fund | 0.03 | 0.09 | 3.75 | -7.60 | 0.8279 | -0.1119 | |||
| DOV / Dover Corporation | 0.02 | -0.06 | 3.55 | 4.23 | 0.7835 | -0.0049 | |||
| VIG / Vanguard Specialized Funds - Vanguard Dividend Appreciation ETF | 0.02 | -3.81 | 3.50 | 1.48 | 0.7725 | -0.0259 | |||
| ICE / Intercontinental Exchange, Inc. | 0.02 | 2.25 | 3.46 | 8.76 | 0.7655 | 0.0272 | |||
| COST / Costco Wholesale Corporation | 0.00 | -2.40 | 3.42 | 2.15 | 0.7553 | -0.0203 | |||
| KR / The Kroger Co. | 0.05 | 2.28 | 3.40 | 8.38 | 0.7518 | 0.0242 | |||
| KMB / Kimberly-Clark Corporation | 0.03 | 4.29 | 3.39 | -5.47 | 0.7492 | -0.0820 | |||
| ELV / Elevance Health, Inc. | 0.01 | 1.04 | 3.25 | -9.66 | 0.7191 | -0.1157 | |||
| FANG / Diamondback Energy, Inc. | 0.02 | 3.76 | 3.20 | -10.84 | 0.7069 | -0.1246 | |||
| CRWD / CrowdStrike Holdings, Inc. | 0.01 | -1.17 | 3.15 | 42.75 | 0.6968 | 0.1849 | |||
| BMY / Bristol-Myers Squibb Company | 0.07 | 0.02 | 3.08 | -24.09 | 0.6811 | -0.2600 | |||
| BDX / Becton, Dickinson and Company | 0.02 | 4.64 | 3.06 | -21.32 | 0.6764 | -0.2252 | |||
| RNR / RenaissanceRe Holdings Ltd. | 0.01 | 0.34 | 3.05 | 1.53 | 0.6752 | -0.0223 | |||
| DLR / Digital Realty Trust, Inc. | 0.02 | -0.04 | 3.04 | 21.63 | 0.6724 | 0.0925 | |||
| UL / Unilever PLC - Depositary Receipt (Common Stock) | 0.05 | 0.86 | 3.03 | 3.62 | 0.6869 | 0.0084 | |||
| QQQ / Invesco QQQ Trust, Series 1 | 0.01 | 2.17 | 2.85 | 20.18 | 0.6307 | 0.0803 | |||
| TXN / Texas Instruments Incorporated | 0.01 | -0.20 | 2.85 | 15.28 | 0.6289 | 0.0568 | |||
| ROL / Rollins, Inc. | 0.05 | 0.88 | 2.83 | 5.32 | 0.6259 | 0.0027 | |||
| AXS / AXIS Capital Holdings Limited | 0.03 | 0.45 | 2.76 | 4.04 | 0.6090 | -0.0050 | |||
| DEO / Diageo plc - Depositary Receipt (Common Stock) | 0.03 | 0.94 | 2.71 | -2.86 | 0.6148 | -0.0329 | |||
| RPM / RPM International Inc. | 0.02 | 0.03 | 2.67 | -5.02 | 0.5900 | -0.0616 | |||
| LOW / Lowe's Companies, Inc. | 0.01 | 0.13 | 2.53 | -4.74 | 0.5601 | -0.0567 | |||
| NVO / Novo Nordisk A/S - Depositary Receipt (Common Stock) | 0.04 | -4.35 | 2.49 | -4.92 | 0.5646 | -0.0431 | |||
| NVDA / NVIDIA Corporation | 0.02 | 2.03 | 2.49 | 48.72 | 0.5507 | 0.1624 | |||
| WTRG / Essential Utilities, Inc. | 0.07 | -10.75 | 2.45 | -16.14 | 0.5420 | -0.1360 | |||
| TGT / Target Corporation | 0.02 | 2.86 | 2.41 | -2.75 | 0.5321 | -0.0419 | |||
| TRP / TC Energy Corporation | 0.05 | 0.25 | 2.34 | 3.58 | 0.5180 | -0.0064 | |||
| HD / The Home Depot, Inc. | 0.01 | -1.10 | 2.34 | -1.06 | 0.5179 | -0.0312 | |||
| ROK / Rockwell Automation, Inc. | 0.01 | 0.04 | 2.34 | 28.63 | 0.5164 | 0.0953 | |||
| CVS / CVS Health Corporation | 0.03 | -0.07 | 2.27 | 1.75 | 0.5006 | -0.0155 | |||
| NSRGY / Nestlé S.A. - Depositary Receipt (Common Stock) | 0.02 | 1.49 | 2.26 | -0.35 | 0.5123 | -0.0139 | |||
| ADM / Archer-Daniels-Midland Company | 0.04 | -1.95 | 2.24 | 7.80 | 0.4948 | 0.0133 | |||
| RLI / RLI Corp. | 0.03 | -0.26 | 2.21 | -10.33 | 0.4875 | -0.0828 | |||
| NVS / Novartis AG - Depositary Receipt (Common Stock) | 0.02 | 0.92 | 2.13 | 9.58 | 0.4704 | 0.0200 | |||
| BA / The Boeing Company | 0.01 | 21.63 | 2.10 | 49.50 | 0.4640 | 0.1383 | |||
| CAT / Caterpillar Inc. | 0.01 | 1.59 | 2.01 | 19.61 | 0.4437 | 0.0545 | |||
| PEP / PepsiCo, Inc. | 0.02 | 0.28 | 2.01 | -11.71 | 0.4434 | -0.0833 | |||
| EXPD / Expeditors International of Washington, Inc. | 0.02 | -0.02 | 1.97 | -5.00 | 0.4363 | -0.0455 | |||
| LYB / LyondellBasell Industries N.V. | 0.03 | -7.58 | 1.97 | -24.04 | 0.4344 | -0.1655 | |||
| SO / The Southern Company | 0.02 | 0.04 | 1.90 | -0.11 | 0.4201 | -0.0209 | |||
| GD / General Dynamics Corporation | 0.01 | 1.43 | 1.90 | 8.57 | 0.4199 | 0.0141 | |||
| IWD / iShares Trust - iShares Russell 1000 Value ETF | 0.01 | -0.45 | 1.81 | 2.79 | 0.3989 | -0.0083 | |||
| C / Citigroup Inc. | 0.02 | -0.92 | 1.70 | 18.85 | 0.3762 | 0.0440 | |||
| DIS / The Walt Disney Company | 0.01 | 1.69 | 0.3744 | 0.3744 | |||||
| UBER / Uber Technologies, Inc. | 0.02 | 2.41 | 1.62 | 31.19 | 0.3570 | 0.0715 | |||
| CTRA / Coterra Energy Inc. | 0.06 | 157.52 | 1.57 | 126.22 | 0.3471 | 0.1861 | |||
| GILD / Gilead Sciences, Inc. | 0.01 | 0.37 | 1.37 | -0.72 | 0.3031 | -0.0170 | |||
| STZ / Constellation Brands, Inc. | 0.01 | 7.93 | 1.34 | -4.29 | 0.2962 | -0.0286 | |||
| NEE / NextEra Energy, Inc. | 0.02 | 0.64 | 1.31 | -1.44 | 0.2885 | -0.0186 | |||
| O / Realty Income Corporation | 0.02 | 2.95 | 1.30 | 2.29 | 0.2867 | -0.0074 | |||
| CHRW / C.H. Robinson Worldwide, Inc. | 0.01 | 0.31 | 1.27 | -6.05 | 0.2817 | -0.0327 | |||
| GOOGL / Alphabet Inc. | 0.01 | -63.42 | 1.20 | -58.34 | 0.2647 | -0.4014 | |||
| GPC / Genuine Parts Company | 0.01 | 0.13 | 1.17 | 1.92 | 0.2585 | -0.0074 | |||
| SHV / iShares Trust - iShares Short Treasury Bond ETF | 0.01 | 11.13 | 1.16 | 11.09 | 0.2569 | 0.0143 | |||
| IBM / International Business Machines Corporation | 0.00 | 0.05 | 1.11 | 18.65 | 0.2447 | 0.0283 | |||
| OKE / ONEOK, Inc. | 0.01 | 59.83 | 1.07 | 31.41 | 0.2369 | 0.0479 | |||
| SHY / iShares Trust - iShares 1-3 Year Treasury Bond ETF | 0.01 | -13.03 | 0.98 | -12.87 | 0.2210 | -0.0386 | |||
| CARR / Carrier Global Corporation | 0.01 | -2.72 | 0.91 | 12.32 | 0.2016 | 0.0133 | |||
| XOM / Exxon Mobil Corporation | 0.01 | 0.10 | 0.89 | -9.31 | 0.1960 | -0.0306 | |||
| IWF / iShares Trust - iShares Russell 1000 Growth ETF | 0.00 | 0.00 | 0.77 | 17.63 | 0.1712 | 0.0185 | |||
| BAC / Bank of America Corporation | 0.02 | 0.05 | 0.75 | 13.44 | 0.1660 | 0.0125 | |||
| DLN / WisdomTree Trust - WisdomTree U.S. LargeCap Dividend Fund | 0.01 | 0.04 | 0.66 | 3.44 | 0.1463 | -0.0019 | |||
| DE / Deere & Company | 0.00 | -0.68 | 0.59 | 7.64 | 0.1309 | 0.0033 | |||
| META / Meta Platforms, Inc. | 0.00 | 0.00 | 0.54 | 28.37 | 0.1200 | 0.0217 | |||
| SHOP / Shopify Inc. | 0.00 | 0.00 | 0.43 | 21.13 | 0.0951 | 0.0126 | |||
| SWK / Stanley Black & Decker, Inc. | 0.01 | 0.25 | 0.40 | -11.50 | 0.0884 | -0.0166 | |||
| MKTX / MarketAxess Holdings Inc. | 0.00 | 4.30 | 0.36 | 7.53 | 0.0791 | 0.0020 | |||
| ABBNY / ABB Ltd - Depositary Receipt (Common Stock) | 0.01 | 0.68 | 0.35 | 15.31 | 0.0784 | 0.0070 | |||
| DVY / iShares Trust - iShares Select Dividend ETF | 0.00 | 1.76 | 0.35 | 0.85 | 0.0782 | -0.0033 | |||
| UNH / UnitedHealth Group Incorporated | 0.00 | -0.90 | 0.34 | -41.03 | 0.0757 | -0.0588 | |||
| BHP / BHP Group Limited - Depositary Receipt (Common Stock) | 0.01 | 0.00 | 0.34 | -0.87 | 0.0757 | -0.0044 | |||
| PKG / Packaging Corporation of America | 0.00 | 0.33 | 0.34 | -4.49 | 0.0753 | -0.0074 | |||
| CCI / Crown Castle Inc. | 0.00 | 0.68 | 0.32 | -0.93 | 0.0704 | -0.0040 | |||
| PYLD / PIMCO ETF Trust - PIMCO Multisector Bond Active Exchange-Traded Fund | 0.01 | 0.00 | 0.32 | 0.96 | 0.0701 | -0.0029 | |||
| NOW / ServiceNow, Inc. | 0.00 | 0.00 | 0.31 | 29.34 | 0.0693 | 0.0130 | |||
| WPM / Wheaton Precious Metals Corp. | 0.00 | -4.74 | 0.31 | 10.25 | 0.0690 | 0.0033 | |||
| RGLD / Royal Gold, Inc. | 0.00 | 0.12 | 0.30 | 8.60 | 0.0672 | 0.0025 | |||
| DG / Dollar General Corporation | 0.00 | -15.10 | 0.30 | 10.45 | 0.0655 | 0.0033 | |||
| HUBS / HubSpot, Inc. | 0.00 | 0.00 | 0.29 | -2.72 | 0.0634 | -0.0048 | |||
| XLF / The Select Sector SPDR Trust - The Financial Select Sector SPDR Fund | 0.01 | -2.66 | 0.29 | 2.15 | 0.0632 | -0.0016 | |||
| YUM / Yum! Brands, Inc. | 0.00 | 0.21 | 0.28 | -5.39 | 0.0621 | -0.0069 | |||
| SII / Sprott Inc. | 0.00 | 0.26 | 0.0598 | 0.0598 | |||||
| SIEGY / Siemens Aktiengesellschaft - Depositary Receipt (Common Stock) | 0.00 | 0.00 | 0.23 | 11.82 | 0.0503 | 0.0031 | |||
| UPS / United Parcel Service, Inc. | 0.00 | 0.98 | 0.21 | -7.14 | 0.0461 | -0.0061 | |||
| KVUE / Kenvue Inc. | 0.01 | 0.52 | 0.21 | -11.91 | 0.0458 | -0.0089 | |||
| GANX / Gain Therapeutics, Inc. | 0.02 | 25.00 | 0.04 | 17.65 | 0.0090 | 0.0010 | |||
| TFC / Truist Financial Corporation | 0.00 | -100.00 | 0.00 | 0.0000 | |||||
| CB / Chubb Limited | 0.00 | -100.00 | 0.00 | 0.0000 | |||||
| SYK / Stryker Corporation | 0.00 | -100.00 | 0.00 | 0.0000 | |||||
| DOW / Dow Inc. | 0.00 | -100.00 | 0.00 | 0.0000 |