Statistik Asas
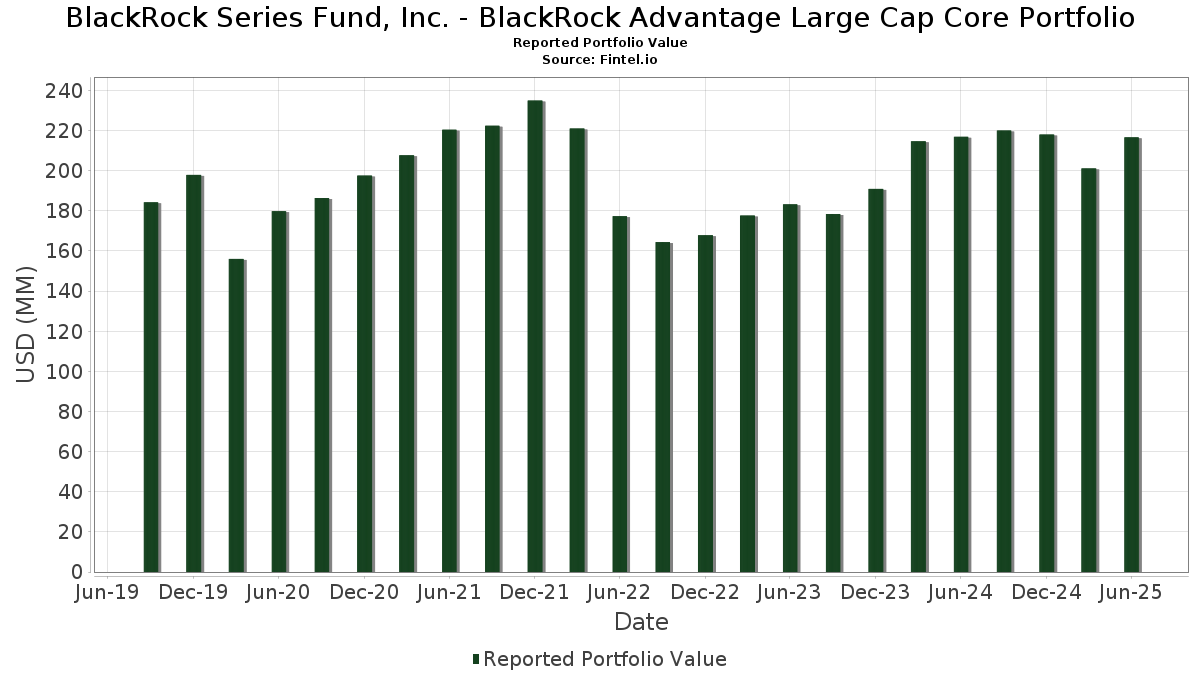
| Nilai Portfolio | $ 216,642,184 |
| Kedudukan Semasa | 193 |
Pegangan Terkini, Prestasi, AUM (dari 13F, 13D)
BlackRock Series Fund, Inc. - BlackRock Advantage Large Cap Core Portfolio telah mendedahkan 193 jumlah pegangan dalam pemfailan SEC terkini mereka. Nilai portfolio terkini dikira sebagai $ 216,642,184 USD. Aset Sebenar Di Bawah Pengurusan (AUM) ialah nilai ini ditambah dengan tunai (yang tidak didedahkan). Pegangan teratas BlackRock Series Fund, Inc. - BlackRock Advantage Large Cap Core Portfolio ialah Microsoft Corporation (US:MSFT) , NVIDIA Corporation (US:NVDA) , Apple Inc. (US:AAPL) , Amazon.com, Inc. (US:AMZN) , and Meta Platforms, Inc. (US:META) . Kedudukan baharu BlackRock Series Fund, Inc. - BlackRock Advantage Large Cap Core Portfolio termasuk Corning Incorporated (US:GLW) , Antero Resources Corporation (US:AR) , VeriSign, Inc. (US:VRSN) , Credo Technology Group Holding Ltd (US:CRDO) , and Remitly Global, Inc. (US:RELY) .
Kenaikan Teratas Suku Tahun Ini
Kami menggunakan perubahan dalam peruntukan portfolio kerana ini adalah metrik yang paling bermakna. Perubahan boleh disebabkan oleh perdagangan atau perubahan dalam harga saham.
| Sekuriti | Saham (MM) |
Nilai (MM$) |
Portfolio % | ΔPortfolio % |
|---|---|---|---|---|
| 0.09 | 14.40 | 6.7082 | 1.5087 | |
| 0.01 | 2.90 | 1.3520 | 1.3387 | |
| 0.03 | 15.71 | 7.3198 | 1.0095 | |
| 0.01 | 2.46 | 1.1457 | 0.9550 | |
| 0.03 | 2.93 | 1.3653 | 0.8303 | |
| 0.04 | 1.67 | 0.7791 | 0.7673 | |
| 0.01 | 1.60 | 0.7479 | 0.7394 | |
| 0.00 | 2.13 | 0.9908 | 0.7378 | |
| 0.02 | 4.63 | 2.1594 | 0.7015 | |
| 0.00 | 1.69 | 0.7895 | 0.6638 |
Penurunan Teratas Suku Tahun Ini
Kami menggunakan perubahan dalam peruntukan portfolio kerana ini adalah metrik yang paling bermakna. Perubahan boleh disebabkan oleh perdagangan atau perubahan dalam harga saham.
| Sekuriti | Saham (MM) |
Nilai (MM$) |
Portfolio % | ΔPortfolio % |
|---|---|---|---|---|
| 0.00 | 0.55 | 0.2573 | -1.3588 | |
| 0.00 | 0.71 | 0.3304 | -0.8441 | |
| 0.00 | 0.34 | 0.1572 | -0.8207 | |
| 0.06 | 12.59 | 5.8673 | -0.7019 | |
| 2.20 | 2.20 | 1.0235 | -0.6863 | |
| 0.00 | 0.13 | 0.0608 | -0.6260 | |
| 0.00 | 0.15 | 0.0703 | -0.6189 | |
| 0.00 | 1.67 | 0.7796 | -0.6011 | |
| 0.00 | 0.20 | 0.0949 | -0.5441 | |
| 0.00 | 0.93 | 0.4322 | -0.5116 |
13F dan Pemfailan Dana
Borang ini telah difailkan pada 2025-08-28 untuk tempoh pelaporan 2025-06-30. Klik ikon pautan untuk melihat sejarah transaksi penuh.
Tingkatkan untuk membuka data premium dan eksport ke Excel ![]() .
.
| Sekuriti | Jenis | Purata Harga Saham | Saham (MM) |
ΔSaham (%) |
ΔSaham (%) |
Nilai ($MM) |
Portfolio (%) |
ΔPortfolio (%) |
|
|---|---|---|---|---|---|---|---|---|---|
| MSFT / Microsoft Corporation | 0.03 | -5.05 | 15.71 | 25.81 | 7.3198 | 1.0095 | |||
| NVDA / NVIDIA Corporation | 0.09 | -4.01 | 14.40 | 39.93 | 6.7082 | 1.5087 | |||
| AAPL / Apple Inc. | 0.06 | 4.88 | 12.59 | -3.12 | 5.8673 | -0.7019 | |||
| AMZN / Amazon.com, Inc. | 0.04 | 6.95 | 9.72 | 23.33 | 4.5280 | 0.5457 | |||
| META / Meta Platforms, Inc. | 0.01 | 0.00 | 6.54 | 28.06 | 3.0476 | 0.4664 | |||
| GOOGL / Alphabet Inc. | 0.03 | -1.54 | 5.43 | 12.19 | 2.5307 | 0.0844 | |||
| AVGO / Broadcom Inc. | 0.02 | -2.42 | 4.63 | 60.64 | 2.1594 | 0.7015 | |||
| WMT / Walmart Inc. | 0.04 | 30.42 | 3.91 | 45.28 | 1.8197 | 0.4610 | |||
| GOOG / Alphabet Inc. | 0.02 | -5.12 | 3.11 | 7.71 | 1.4514 | -0.0099 | |||
| MS / Morgan Stanley | 0.02 | 11.86 | 3.07 | 35.03 | 1.4318 | 0.2819 | |||
| BAC / Bank of America Corporation | 0.06 | 0.00 | 3.05 | 13.41 | 1.4230 | 0.0619 | |||
| SCHW / The Charles Schwab Corporation | 0.03 | 137.45 | 2.93 | 176.84 | 1.3653 | 0.8303 | |||
| CRM / Salesforce, Inc. | 0.01 | 10,757.14 | 2.90 | 11,057.69 | 1.3520 | 1.3387 | |||
| JPM / JPMorgan Chase & Co. | 0.01 | 0.00 | 2.82 | 18.18 | 1.3119 | 0.1079 | |||
| HD / The Home Depot, Inc. | 0.01 | -3.34 | 2.66 | -3.31 | 1.2392 | -0.1508 | |||
| MDT / Medtronic plc | 0.03 | 32.51 | 2.46 | 28.58 | 1.1470 | 0.1792 | |||
| CAH / Cardinal Health, Inc. | 0.01 | 434.32 | 2.46 | 551.99 | 1.1457 | 0.9550 | |||
| TSLA / Tesla, Inc. | 0.01 | -19.04 | 2.41 | -0.78 | 1.1238 | -0.1046 | |||
| COST / Costco Wholesale Corporation | 0.00 | -26.26 | 2.38 | -22.83 | 1.1090 | -0.4494 | |||
| PFE / Pfizer Inc. | 0.09 | 72.97 | 2.30 | 65.49 | 1.0705 | 0.3688 | |||
| TRV / The Travelers Companies, Inc. | 0.01 | 4.99 | 2.29 | 6.23 | 1.0653 | -0.0226 | |||
| ETR / Entergy Corporation | 0.03 | 56.57 | 2.25 | 52.23 | 1.0486 | 0.3015 | |||
| US0669225197 / BlackRock Cash Funds: Institutional, SL Agency Shares | 2.20 | -35.07 | 2.20 | -35.09 | 1.0235 | -0.6863 | |||
| PH / Parker-Hannifin Corporation | 0.00 | -23.27 | 2.13 | -11.85 | 0.9914 | -0.2282 | |||
| EQIX / Equinix, Inc. | 0.00 | 335.34 | 2.13 | 325.20 | 0.9908 | 0.7378 | |||
| MCO / Moody's Corporation | 0.00 | 0.00 | 2.10 | 7.70 | 0.9772 | -0.0068 | |||
| US09248U7182 / BlackRock Liquidity Funds: T-Fund, Institutional Shares | 2.03 | 4.31 | 2.03 | 4.31 | 0.9480 | -0.0378 | |||
| PM / Philip Morris International Inc. | 0.01 | 1.23 | 1.96 | 16.20 | 0.9125 | 0.0605 | |||
| LLY / Eli Lilly and Company | 0.00 | -12.13 | 1.95 | -17.04 | 0.9078 | -0.2794 | |||
| REGN / Regeneron Pharmaceuticals, Inc. | 0.00 | 330.80 | 1.90 | 256.85 | 0.8863 | 0.6168 | |||
| ABBV / AbbVie Inc. | 0.01 | 41.19 | 1.73 | 25.09 | 0.8065 | 0.1072 | |||
| DVN / Devon Energy Corporation | 0.05 | 29.38 | 1.72 | 10.10 | 0.8030 | 0.0115 | |||
| INTU / Intuit Inc. | 0.00 | 431.11 | 1.69 | 583.06 | 0.7895 | 0.6638 | |||
| BKNG / Booking Holdings Inc. | 0.00 | -51.26 | 1.67 | -38.74 | 0.7796 | -0.6011 | |||
| BMY / Bristol-Myers Squibb Company | 0.04 | 9,282.08 | 1.67 | 7,169.57 | 0.7791 | 0.7673 | |||
| ICE / Intercontinental Exchange, Inc. | 0.01 | 0.00 | 1.62 | 6.37 | 0.7545 | -0.0149 | |||
| LMT / Lockheed Martin Corporation | 0.00 | 2.20 | 1.61 | 5.98 | 0.7523 | -0.0178 | |||
| BX / Blackstone Inc. | 0.01 | 6,564.60 | 1.60 | 11,357.14 | 0.7479 | 0.7394 | |||
| NFLX / Netflix, Inc. | 0.00 | -25.80 | 1.58 | 6.55 | 0.7357 | -0.0132 | |||
| ADBE / Adobe Inc. | 0.00 | 6.03 | 1.58 | 6.92 | 0.7352 | -0.0103 | |||
| QCOM / QUALCOMM Incorporated | 0.01 | -12.68 | 1.49 | -9.51 | 0.6966 | -0.1380 | |||
| BSX / Boston Scientific Corporation | 0.01 | 25.86 | 1.48 | 33.94 | 0.6920 | 0.1319 | |||
| RL / Ralph Lauren Corporation | 0.01 | 183.74 | 1.45 | 253.30 | 0.6734 | 0.4663 | |||
| BRK.B / Berkshire Hathaway Inc. | 0.00 | 3.87 | 1.41 | -5.25 | 0.6562 | -0.0950 | |||
| UNH / UnitedHealth Group Incorporated | 0.00 | 7.94 | 1.37 | -35.73 | 0.6383 | -0.4385 | |||
| LRCX / Lam Research Corporation | 0.01 | -21.46 | 1.35 | 5.13 | 0.6304 | -0.0198 | |||
| AXP / American Express Company | 0.00 | 0.00 | 1.32 | 18.60 | 0.6152 | 0.0524 | |||
| FDX / FedEx Corporation | 0.01 | 119.98 | 1.30 | 105.20 | 0.6075 | 0.2863 | |||
| FLEX / Flex Ltd. | 0.03 | 576.78 | 1.30 | 925.20 | 0.6067 | 0.5423 | |||
| PKG / Packaging Corporation of America | 0.01 | -15.19 | 1.24 | -19.30 | 0.5790 | -0.1991 | |||
| MRK / Merck & Co., Inc. | 0.02 | 0.00 | 1.23 | -11.84 | 0.5729 | -0.1317 | |||
| KDP / Keurig Dr Pepper Inc. | 0.04 | 240.90 | 1.19 | 218.45 | 0.5554 | 0.3394 | |||
| APH / Amphenol Corporation | 0.01 | -55.56 | 1.18 | -33.09 | 0.5486 | -0.3407 | |||
| AMD / Advanced Micro Devices, Inc. | 0.01 | 9.88 | 1.17 | 51.82 | 0.5437 | 0.1551 | |||
| AME / AMETEK, Inc. | 0.01 | 477.76 | 1.17 | 509.95 | 0.5432 | 0.4462 | |||
| MSI / Motorola Solutions, Inc. | 0.00 | -34.14 | 1.14 | -36.76 | 0.5300 | -0.3788 | |||
| SPGI / S&P Global Inc. | 0.00 | 72.27 | 1.12 | 78.82 | 0.5236 | 0.2059 | |||
| PLTR / Palantir Technologies Inc. | 0.01 | 85.84 | 1.12 | 200.54 | 0.5211 | 0.3328 | |||
| LNG / Cheniere Energy, Inc. | 0.00 | 20.85 | 1.10 | 27.17 | 0.5130 | 0.0755 | |||
| DIS / The Walt Disney Company | 0.01 | 94.71 | 1.06 | 156.17 | 0.4932 | 0.2544 | |||
| UBER / Uber Technologies, Inc. | 0.01 | 79.85 | 1.06 | 130.57 | 0.4924 | 0.2605 | |||
| BWA / BorgWarner Inc. | 0.03 | 0.00 | 1.05 | 16.91 | 0.4900 | 0.0352 | |||
| FLS / Flowserve Corporation | 0.02 | 180.74 | 1.04 | 200.86 | 0.4868 | 0.3113 | |||
| MTZ / MasTec, Inc. | 0.01 | 31.66 | 1.04 | 92.25 | 0.4858 | 0.2117 | |||
| MRVL / Marvell Technology, Inc. | 0.01 | 13.31 | 1.02 | 42.48 | 0.4771 | 0.1138 | |||
| GILD / Gilead Sciences, Inc. | 0.01 | 11.33 | 1.01 | 10.15 | 0.4706 | 0.0072 | |||
| WMB / The Williams Companies, Inc. | 0.02 | 124.33 | 0.98 | 135.73 | 0.4585 | 0.2476 | |||
| CMCSA / Comcast Corporation | 0.03 | -45.40 | 0.94 | -47.20 | 0.4358 | -0.4593 | |||
| CTAS / Cintas Corporation | 0.00 | -54.19 | 0.93 | -50.35 | 0.4322 | -0.5116 | |||
| TXN / Texas Instruments Incorporated | 0.00 | 2,123.12 | 0.92 | 2,381.08 | 0.4280 | 0.4106 | |||
| CME / CME Group Inc. | 0.00 | -17.65 | 0.90 | -14.42 | 0.4177 | -0.1118 | |||
| ADSK / Autodesk, Inc. | 0.00 | -41.32 | 0.89 | -30.61 | 0.4163 | -0.2344 | |||
| DRI / Darden Restaurants, Inc. | 0.00 | 315.31 | 0.89 | 443.90 | 0.4159 | 0.3258 | |||
| FIX / Comfort Systems USA, Inc. | 0.00 | 0.00 | 0.87 | 66.22 | 0.4063 | 0.1414 | |||
| MA / Mastercard Incorporated | 0.00 | 0.00 | 0.86 | 2.49 | 0.4027 | -0.0233 | |||
| TRGP / Targa Resources Corp. | 0.00 | 21.38 | 0.84 | 5.29 | 0.3900 | -0.0113 | |||
| LAD / Lithia Motors, Inc. | 0.00 | 464.78 | 0.81 | 550.81 | 0.3761 | 0.3133 | |||
| RTX / RTX Corporation | 0.01 | 249.81 | 0.79 | 285.78 | 0.3670 | 0.2638 | |||
| ESTC / Elastic N.V. | 0.01 | 383.34 | 0.77 | 357.40 | 0.3603 | 0.2749 | |||
| CUBE / CubeSmart | 0.02 | 0.00 | 0.77 | -0.39 | 0.3588 | -0.0323 | |||
| WCN / Waste Connections, Inc. | 0.00 | 96.89 | 0.74 | 170.55 | 0.3469 | 0.2283 | |||
| FOXA / Fox Corporation | 0.01 | -52.01 | 0.74 | -44.68 | 0.3443 | -0.2790 | |||
| PGR / The Progressive Corporation | 0.00 | -41.29 | 0.73 | -44.64 | 0.3395 | -0.3256 | |||
| SPG / Simon Property Group, Inc. | 0.00 | -68.48 | 0.71 | -69.52 | 0.3304 | -0.8441 | |||
| UPS / United Parcel Service, Inc. | 0.01 | 168.56 | 0.69 | 72.32 | 0.3222 | 0.1095 | |||
| PG / The Procter & Gamble Company | 0.00 | 21.33 | 0.69 | 13.39 | 0.3201 | 0.0140 | |||
| YUM / Yum! Brands, Inc. | 0.00 | 135.45 | 0.68 | 152.22 | 0.3174 | 0.1693 | |||
| TJX / The TJX Companies, Inc. | 0.01 | -7.58 | 0.68 | -6.24 | 0.3152 | -0.0496 | |||
| ORLY / O'Reilly Automotive, Inc. | 0.01 | 2,744.83 | 0.67 | 486.84 | 0.3118 | 0.2513 | |||
| DD / DuPont de Nemours, Inc. | 0.01 | 289.09 | 0.67 | 258.60 | 0.3111 | 0.2167 | |||
| PNR / Pentair plc | 0.01 | 605.25 | 0.65 | 730.77 | 0.3023 | 0.2627 | |||
| HON / Honeywell International Inc. | 0.00 | 35.74 | 0.64 | 49.30 | 0.2980 | 0.0815 | |||
| HBAN / Huntington Bancshares Incorporated | 0.04 | 0.64 | 0.2980 | 0.2980 | |||||
| GEY / Garmin Ltd. | 0.00 | 97.56 | 0.63 | 89.97 | 0.2913 | 0.1249 | |||
| VZ / Verizon Communications Inc. | 0.01 | 0.00 | 0.62 | -4.50 | 0.2871 | -0.0393 | |||
| C / Citigroup Inc. | 0.01 | 0.00 | 0.60 | 19.92 | 0.2780 | 0.0265 | |||
| HEIA / Heico Corp. - Class A | 0.00 | 172.53 | 0.59 | 235.03 | 0.2764 | 0.1867 | |||
| ALL / The Allstate Corporation | 0.00 | -21.65 | 0.57 | -23.89 | 0.2644 | -0.1121 | |||
| KIM / Kimco Realty Corporation | 0.03 | 0.00 | 0.56 | -0.88 | 0.2629 | -0.0252 | |||
| NTRA / Natera, Inc. | 0.00 | 0.00 | 0.56 | 19.53 | 0.2599 | 0.0239 | |||
| V / Visa Inc. | 0.00 | -82.96 | 0.55 | -82.73 | 0.2573 | -1.3588 | |||
| VTR / Ventas, Inc. | 0.01 | -41.73 | 0.52 | -46.52 | 0.2403 | -0.2467 | |||
| NEM / Newmont Corporation | 0.01 | 0.51 | 0.2393 | 0.2393 | |||||
| UNP / Union Pacific Corporation | 0.00 | 0.48 | 0.2236 | 0.2236 | |||||
| CMI / Cummins Inc. | 0.00 | -24.49 | 0.47 | -21.14 | 0.2193 | -0.0822 | |||
| GLW / Corning Incorporated | 0.01 | 0.45 | 0.2099 | 0.2099 | |||||
| BMRN / BioMarin Pharmaceutical Inc. | 0.01 | -22.60 | 0.43 | -39.86 | 0.2020 | -0.1620 | |||
| TEAM / Atlassian Corporation | 0.00 | -15.97 | 0.40 | 7.51 | 0.1873 | 0.0147 | |||
| ANET / Arista Networks Inc | 0.00 | 601.82 | 0.39 | 835.71 | 0.1834 | 0.1619 | |||
| FICO / Fair Isaac Corporation | 0.00 | 0.00 | 0.37 | -1.06 | 0.1738 | -0.0164 | |||
| CSCO / Cisco Systems, Inc. | 0.01 | 0.36 | 0.1664 | 0.1664 | |||||
| AR / Antero Resources Corporation | 0.01 | 0.35 | 0.1641 | 0.1641 | |||||
| PNC / The PNC Financial Services Group, Inc. | 0.00 | -83.56 | 0.34 | -82.57 | 0.1572 | -0.8207 | |||
| AZO / AutoZone, Inc. | 0.00 | 0.33 | 0.1540 | 0.1540 | |||||
| VRSN / VeriSign, Inc. | 0.00 | 0.31 | 0.1467 | 0.1467 | |||||
| NYT / The New York Times Company | 0.01 | 65.45 | 0.30 | 87.04 | 0.1415 | 0.0593 | |||
| AN / AutoNation, Inc. | 0.00 | 250.00 | 0.30 | 332.86 | 0.1413 | 0.1056 | |||
| CNC / Centene Corporation | 0.01 | -70.87 | 0.30 | -74.01 | 0.1410 | -0.4463 | |||
| EW / Edwards Lifesciences Corporation | 0.00 | -44.40 | 0.30 | -40.04 | 0.1405 | -0.1135 | |||
| CRDO / Credo Technology Group Holding Ltd | 0.00 | 0.30 | 0.1378 | 0.1378 | |||||
| WDAY / Workday, Inc. | 0.00 | -21.87 | 0.29 | -31.29 | 0.1362 | -0.0718 | |||
| MCK / McKesson Corporation | 0.00 | -56.87 | 0.29 | -6.86 | 0.1328 | -0.0598 | |||
| ED / Consolidated Edison, Inc. | 0.00 | 34.09 | 0.28 | 21.55 | 0.1319 | 0.0143 | |||
| RELY / Remitly Global, Inc. | 0.01 | 0.28 | 0.1296 | 0.1296 | |||||
| BBY / Best Buy Co., Inc. | 0.00 | 72.83 | 0.28 | 35.12 | 0.1293 | 0.0335 | |||
| DAL / Delta Air Lines, Inc. | 0.01 | -49.62 | 0.28 | -43.12 | 0.1292 | -0.1174 | |||
| UTHR / United Therapeutics Corporation | 0.00 | 0.00 | 0.26 | -6.76 | 0.1221 | -0.0200 | |||
| FI / Fiserv, Inc. | 0.00 | 0.25 | 0.1167 | 0.1167 | |||||
| FTI / TechnipFMC plc | 0.01 | 0.25 | 0.1155 | 0.1155 | |||||
| GAP / The Gap, Inc. | 0.01 | 0.25 | 0.1151 | 0.1151 | |||||
| INCY / Incyte Corporation | 0.00 | 0.00 | 0.24 | 12.44 | 0.1140 | 0.0041 | |||
| TTWO / Take-Two Interactive Software, Inc. | 0.00 | 0.24 | 0.1097 | 0.1097 | |||||
| NUE / Nucor Corporation | 0.00 | -68.24 | 0.22 | -65.90 | 0.1038 | -0.2255 | |||
| TMO / Thermo Fisher Scientific Inc. | 0.00 | -73.56 | 0.20 | -78.48 | 0.0952 | -0.3841 | |||
| NOW / ServiceNow, Inc. | 0.00 | -87.53 | 0.20 | -83.94 | 0.0949 | -0.5441 | |||
| PCG / PG&E Corporation | 0.01 | 96.28 | 0.20 | 59.06 | 0.0946 | 0.0302 | |||
| OVV / Ovintiv Inc. | 0.01 | 649.93 | 0.20 | 573.33 | 0.0943 | 0.0789 | |||
| EXPD / Expeditors International of Washington, Inc. | 0.00 | -22.15 | 0.19 | -25.97 | 0.0891 | -0.0415 | |||
| TMHC / Taylor Morrison Home Corporation | 0.00 | -36.64 | 0.19 | -35.15 | 0.0888 | -0.0598 | |||
| ONTO / Onto Innovation Inc. | 0.00 | 257.80 | 0.19 | 201.61 | 0.0873 | 0.0555 | |||
| GD / General Dynamics Corporation | 0.00 | -64.05 | 0.19 | -61.62 | 0.0864 | -0.1573 | |||
| XP9 / XP Inc. | 0.01 | 0.17 | 0.0790 | 0.0790 | |||||
| GDDY / GoDaddy Inc. | 0.00 | -34.51 | 0.16 | 70.83 | 0.0766 | 0.0206 | |||
| TOL / Toll Brothers, Inc. | 0.00 | -53.75 | 0.16 | -50.00 | 0.0737 | -0.0862 | |||
| FTNT / Fortinet, Inc. | 0.00 | -89.93 | 0.15 | -88.99 | 0.0703 | -0.6189 | |||
| NVR / NVR, Inc. | 0.00 | 0.00 | 0.15 | 2.08 | 0.0688 | -0.0044 | |||
| PINS / Pinterest, Inc. | 0.00 | -5.70 | 0.14 | 9.52 | 0.0644 | 0.0004 | |||
| GE / General Electric Company | 0.00 | 0.14 | 0.0644 | 0.0644 | |||||
| GM / General Motors Company | 0.00 | -30.50 | 0.14 | -27.42 | 0.0632 | -0.0310 | |||
| INTC / Intel Corporation | 0.01 | 0.13 | 0.0628 | 0.0628 | |||||
| WM / Waste Management, Inc. | 0.00 | -92.18 | 0.13 | -91.16 | 0.0608 | -0.6260 | |||
| MCD / McDonald's Corporation | 0.00 | -56.38 | 0.12 | -55.04 | 0.0545 | -0.0720 | |||
| JNJ / Johnson & Johnson | 0.00 | 0.12 | 0.0542 | 0.0542 | |||||
| SMG / The Scotts Miracle-Gro Company | 0.00 | 391.38 | 0.11 | 211.11 | 0.0526 | 0.0330 | |||
| VEEV / Veeva Systems Inc. | 0.00 | -52.83 | 0.10 | -41.52 | 0.0470 | -0.0399 | |||
| TYIA / Johnson Controls International plc | 0.00 | -86.09 | 0.10 | -74.49 | 0.0467 | -0.1618 | |||
| URBN / Urban Outfitters, Inc. | 0.00 | -52.84 | 0.10 | -35.10 | 0.0460 | -0.0304 | |||
| 3IW / Invesco Ltd. | 0.01 | -74.47 | 0.10 | -73.70 | 0.0452 | -0.1395 | |||
| BROS / Dutch Bros Inc. | 0.00 | 0.09 | 0.0440 | 0.0440 | |||||
| NDAQ / Nasdaq, Inc. | 0.00 | 0.09 | 0.0439 | 0.0439 | |||||
| RBRK / Rubrik, Inc. | 0.00 | 0.09 | 0.0431 | 0.0431 | |||||
| AWI / Armstrong World Industries, Inc. | 0.00 | 0.09 | 0.0428 | 0.0428 | |||||
| SFM / Sprouts Farmers Market, Inc. | 0.00 | 0.09 | 0.0425 | 0.0425 | |||||
| ALK / Alaska Air Group, Inc. | 0.00 | -51.35 | 0.09 | -46.95 | 0.0409 | -0.0351 | |||
| DHI / D.R. Horton, Inc. | 0.00 | -80.36 | 0.08 | -80.14 | 0.0393 | -0.1747 | |||
| XOM / Exxon Mobil Corporation | 0.00 | -89.12 | 0.08 | -90.05 | 0.0380 | -0.3380 | |||
| SRPT / Sarepta Therapeutics, Inc. | 0.00 | 0.08 | 0.0375 | 0.0375 | |||||
| S&P 500 E-Mini Index / DE (N/A) | 0.08 | 0.0364 | 0.0364 | ||||||
| FIVE / Five Below, Inc. | 0.00 | -74.85 | 0.08 | -79.56 | 0.0351 | -0.1770 | |||
| ORCL / Oracle Corporation | 0.00 | -11.08 | 0.08 | 17.19 | 0.0351 | 0.0050 | |||
| COR / Cencora, Inc. | 0.00 | -86.63 | 0.07 | -83.52 | 0.0345 | -0.1851 | |||
| IBKR / Interactive Brokers Group, Inc. | 0.00 | 300.00 | 0.07 | 33.96 | 0.0335 | 0.0063 | |||
| KEYS / Keysight Technologies, Inc. | 0.00 | -91.90 | 0.07 | -91.62 | 0.0318 | -0.3513 | |||
| IONS / Ionis Pharmaceuticals, Inc. | 0.00 | 0.00 | 0.06 | 30.61 | 0.0302 | 0.0052 | |||
| TPR / Tapestry, Inc. | 0.00 | 0.06 | 0.0297 | 0.0297 | |||||
| CDNS / Cadence Design Systems, Inc. | 0.00 | -75.68 | 0.06 | -70.56 | 0.0294 | -0.0789 | |||
| RBLX / Roblox Corporation | 0.00 | -83.97 | 0.06 | -70.83 | 0.0294 | -0.0716 | |||
| MRNA / Moderna, Inc. | 0.00 | 35.10 | 0.06 | -10.77 | 0.0275 | -0.0032 | |||
| EHC / Encompass Health Corporation | 0.00 | -87.79 | 0.06 | -85.35 | 0.0273 | -0.1731 | |||
| NXT / Nextracker Inc. | 0.00 | 0.06 | 0.0265 | 0.0265 | |||||
| UNM / Unum Group | 0.00 | 0.06 | 0.0257 | 0.0257 | |||||
| BFAM / Bright Horizons Family Solutions Inc. | 0.00 | -55.59 | 0.05 | -56.80 | 0.0252 | -0.0380 | |||
| JNPR / Juniper Networks, Inc. | 0.00 | -1.13 | 0.05 | 9.09 | 0.0228 | 0.0001 | |||
| AA / Alcoa Corporation | 0.00 | 0.05 | 0.0226 | 0.0226 | |||||
| DT / Dynatrace, Inc. | 0.00 | 0.05 | 0.0222 | 0.0222 | |||||
| EXEL / Exelixis, Inc. | 0.00 | 0.00 | 0.04 | 18.18 | 0.0184 | 0.0017 | |||
| HEI / HEICO Corporation | 0.00 | 0.03 | 0.0162 | 0.0162 | |||||
| EQT / EQT Corporation | 0.00 | 0.03 | 0.0156 | 0.0156 | |||||
| CR / Crane Company | 0.00 | 0.03 | 0.0145 | 0.0145 | |||||
| RMBS / Rambus Inc. | 0.00 | 0.03 | 0.0135 | 0.0135 | |||||
| FOX / Fox Corporation | 0.00 | -0.38 | 0.03 | -3.70 | 0.0125 | -0.0014 | |||
| K / Kellanova | 0.00 | 0.02 | 0.0100 | 0.0100 | |||||
| KMX / CarMax, Inc. | 0.00 | 0.02 | 0.0099 | 0.0099 | |||||
| GEV / GE Vernova Inc. | 0.00 | -100.00 | 0.00 | -100.00 | -0.0279 | ||||
| IRM / Iron Mountain Incorporated | 0.00 | -100.00 | 0.00 | -100.00 | -0.4223 | ||||
| STZ / Constellation Brands, Inc. | 0.00 | -100.00 | 0.00 | -100.00 | -0.1271 | ||||
| DOCS / Doximity, Inc. | 0.00 | -100.00 | 0.00 | -100.00 | -0.0284 |