Statistik Asas
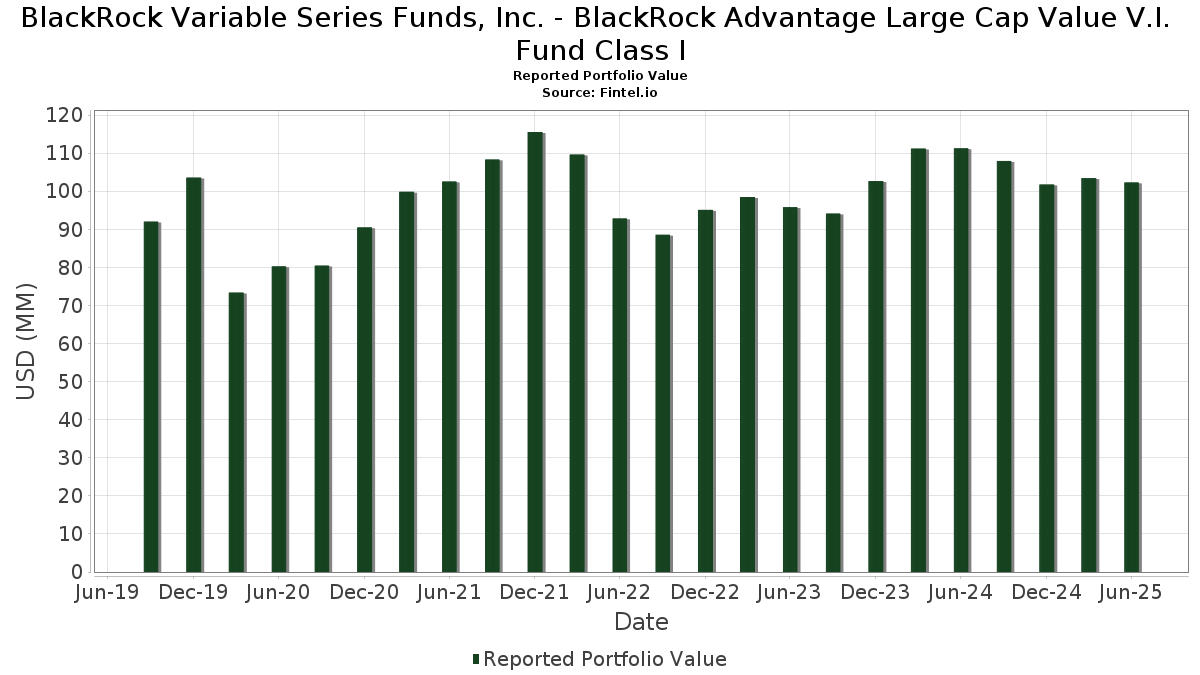
| Nilai Portfolio | $ 102,272,336 |
| Kedudukan Semasa | 224 |
Pegangan Terkini, Prestasi, AUM (dari 13F, 13D)
BlackRock Variable Series Funds, Inc. - BlackRock Advantage Large Cap Value V.I. Fund Class I telah mendedahkan 224 jumlah pegangan dalam pemfailan SEC terkini mereka. Nilai portfolio terkini dikira sebagai $ 102,272,336 USD. Aset Sebenar Di Bawah Pengurusan (AUM) ialah nilai ini ditambah dengan tunai (yang tidak didedahkan). Pegangan teratas BlackRock Variable Series Funds, Inc. - BlackRock Advantage Large Cap Value V.I. Fund Class I ialah JPMorgan Chase & Co. (US:JPM) , Berkshire Hathaway Inc. (US:BRK.B) , Walmart Inc. (US:WMT) , Amazon.com, Inc. (US:AMZN) , and Bank of America Corporation (US:BAC) . Kedudukan baharu BlackRock Variable Series Funds, Inc. - BlackRock Advantage Large Cap Value V.I. Fund Class I termasuk Corning Incorporated (US:GLW) , Blackstone Inc. (US:BX) , O'Reilly Automotive, Inc. (US:ORLY) , Armstrong World Industries, Inc. (US:AWI) , and Remitly Global, Inc. (US:RELY) .
Kenaikan Teratas Suku Tahun Ini
Kami menggunakan perubahan dalam peruntukan portfolio kerana ini adalah metrik yang paling bermakna. Perubahan boleh disebabkan oleh perdagangan atau perubahan dalam harga saham.
| Sekuriti | Saham (MM) |
Nilai (MM$) |
Portfolio % | ΔPortfolio % |
|---|---|---|---|---|
| 0.01 | 2.18 | 2.1769 | 2.0585 | |
| 0.01 | 1.74 | 1.7328 | 1.1834 | |
| 0.01 | 1.13 | 1.1293 | 0.9524 | |
| 0.00 | 1.24 | 1.2373 | 0.8811 | |
| 0.00 | 0.77 | 0.7713 | 0.7713 | |
| 0.02 | 1.55 | 1.5416 | 0.7520 | |
| 0.00 | 0.85 | 0.8432 | 0.7260 | |
| 0.02 | 0.90 | 0.8947 | 0.7216 | |
| 0.01 | 0.93 | 0.9321 | 0.6990 | |
| 0.01 | 0.69 | 0.6901 | 0.6901 |
Penurunan Teratas Suku Tahun Ini
Kami menggunakan perubahan dalam peruntukan portfolio kerana ini adalah metrik yang paling bermakna. Perubahan boleh disebabkan oleh perdagangan atau perubahan dalam harga saham.
| Sekuriti | Saham (MM) |
Nilai (MM$) |
Portfolio % | ΔPortfolio % |
|---|---|---|---|---|
| 2.03 | 2.03 | 2.0227 | -2.0995 | |
| 0.00 | 0.17 | 0.1743 | -1.0553 | |
| 0.00 | 0.25 | 0.2494 | -0.9357 | |
| 0.00 | 0.39 | 0.3870 | -0.7115 | |
| 0.00 | 1.19 | 1.1850 | -0.6499 | |
| 0.00 | 0.10 | 0.0988 | -0.6288 | |
| 0.00 | 0.43 | 0.4324 | -0.5874 | |
| 0.00 | 0.52 | 0.5199 | -0.5515 | |
| 0.00 | 0.01 | 0.0111 | -0.4988 | |
| 0.00 | 0.07 | 0.0664 | -0.4821 |
13F dan Pemfailan Dana
Borang ini telah difailkan pada 2025-08-28 untuk tempoh pelaporan 2025-06-30. Klik ikon pautan untuk melihat sejarah transaksi penuh.
Tingkatkan untuk membuka data premium dan eksport ke Excel ![]() .
.
| Sekuriti | Jenis | Purata Harga Saham | Saham (MM) |
ΔSaham (%) |
ΔSaham (%) |
Nilai ($MM) |
Portfolio (%) |
ΔPortfolio (%) |
|
|---|---|---|---|---|---|---|---|---|---|
| JPM / JPMorgan Chase & Co. | 0.01 | -1.77 | 3.07 | 16.09 | 3.0609 | 0.4005 | |||
| BRK.B / Berkshire Hathaway Inc. | 0.01 | 1.82 | 2.53 | -7.16 | 2.5242 | -0.2183 | |||
| WMT / Walmart Inc. | 0.03 | -5.07 | 2.45 | 5.75 | 2.4425 | 0.1115 | |||
| AMZN / Amazon.com, Inc. | 0.01 | 1,509.22 | 2.18 | 1,764.10 | 2.1769 | 2.0585 | |||
| BAC / Bank of America Corporation | 0.05 | -11.57 | 2.15 | 0.28 | 2.1477 | -0.0135 | |||
| US0669225197 / BlackRock Cash Funds: Institutional, SL Agency Shares | 2.03 | -50.48 | 2.03 | -50.49 | 2.0227 | -2.0995 | |||
| GOOGL / Alphabet Inc. | 0.01 | 179.26 | 1.74 | 218.53 | 1.7328 | 1.1834 | |||
| MS / Morgan Stanley | 0.01 | -6.41 | 1.68 | 13.00 | 1.6748 | 0.1793 | |||
| PFE / Pfizer Inc. | 0.06 | 34.41 | 1.57 | 28.56 | 1.5680 | 0.3375 | |||
| SCHW / The Charles Schwab Corporation | 0.02 | 69.02 | 1.55 | 97.07 | 1.5416 | 0.7520 | |||
| MDT / Medtronic plc | 0.02 | 15.59 | 1.37 | 12.06 | 1.3639 | 0.1366 | |||
| PM / Philip Morris International Inc. | 0.01 | -8.66 | 1.33 | 4.82 | 1.3249 | 0.0494 | |||
| TRV / The Travelers Companies, Inc. | 0.00 | 8.89 | 1.32 | 10.18 | 1.3181 | 0.1107 | |||
| EQIX / Equinix, Inc. | 0.00 | 259.22 | 1.24 | 251.27 | 1.2373 | 0.8811 | |||
| ETR / Entergy Corporation | 0.01 | 129.93 | 1.22 | 123.58 | 1.2208 | 0.6698 | |||
| PH / Parker-Hannifin Corporation | 0.00 | -21.50 | 1.21 | -9.76 | 1.2084 | -0.1434 | |||
| XOM / Exxon Mobil Corporation | 0.01 | 10.75 | 1.20 | 0.42 | 1.1924 | -0.0061 | |||
| UNH / UnitedHealth Group Incorporated | 0.00 | 9.40 | 1.19 | -34.85 | 1.1850 | -0.6499 | |||
| ICE / Intercontinental Exchange, Inc. | 0.01 | -1.79 | 1.15 | 4.45 | 1.1470 | 0.0391 | |||
| CAH / Cardinal Health, Inc. | 0.01 | 428.39 | 1.13 | 546.29 | 1.1293 | 0.9524 | |||
| DVN / Devon Energy Corporation | 0.04 | 38.45 | 1.13 | 17.83 | 1.1277 | 0.1614 | |||
| HD / The Home Depot, Inc. | 0.00 | -8.32 | 1.09 | -8.27 | 1.0850 | -0.1086 | |||
| PG / The Procter & Gamble Company | 0.01 | -1.80 | 1.08 | -8.26 | 1.0755 | -0.1066 | |||
| PNC / The PNC Financial Services Group, Inc. | 0.01 | -26.00 | 1.07 | -21.56 | 1.0645 | -0.3041 | |||
| GOOG / Alphabet Inc. | 0.01 | 71.48 | 1.06 | 193.11 | 1.0619 | 0.6727 | |||
| BSX / Boston Scientific Corporation | 0.01 | 32.48 | 1.05 | 41.16 | 1.0438 | 0.2971 | |||
| C / Citigroup Inc. | 0.01 | -29.25 | 1.05 | -15.11 | 1.0427 | -0.1975 | |||
| LMT / Lockheed Martin Corporation | 0.00 | 18.10 | 1.03 | 22.47 | 1.0282 | 0.1809 | |||
| SPGI / S&P Global Inc. | 0.00 | 35.92 | 1.02 | 41.05 | 1.0154 | 0.2890 | |||
| ED / Consolidated Edison, Inc. | 0.01 | 24.97 | 1.00 | 13.41 | 0.9960 | 0.1098 | |||
| REGN / Regeneron Pharmaceuticals, Inc. | 0.00 | 168.41 | 0.99 | 122.37 | 0.9926 | 0.5418 | |||
| AME / AMETEK, Inc. | 0.01 | 108.04 | 0.99 | 118.85 | 0.9853 | 0.5307 | |||
| CMCSA / Comcast Corporation | 0.03 | -13.57 | 0.97 | -16.45 | 0.9686 | -0.2006 | |||
| DIS / The Walt Disney Company | 0.01 | 221.24 | 0.93 | 304.33 | 0.9321 | 0.6990 | |||
| VZ / Verizon Communications Inc. | 0.02 | -1.77 | 0.90 | -6.33 | 0.9008 | -0.0692 | |||
| BMY / Bristol-Myers Squibb Company | 0.02 | 586.99 | 0.90 | 423.98 | 0.8947 | 0.7216 | |||
| US09248U7182 / BlackRock Liquidity Funds: T-Fund, Institutional Shares | 0.87 | 4.81 | 0.87 | 4.80 | 0.8720 | 0.0325 | |||
| FDX / FedEx Corporation | 0.00 | 91.34 | 0.86 | 78.51 | 0.8623 | 0.3746 | |||
| ABBV / AbbVie Inc. | 0.00 | 11.80 | 0.86 | -0.92 | 0.8597 | -0.0161 | |||
| META / Meta Platforms, Inc. | 0.00 | 466.83 | 0.85 | 628.45 | 0.8432 | 0.7260 | |||
| RTX / RTX Corporation | 0.01 | 52.92 | 0.78 | 68.61 | 0.7780 | 0.3123 | |||
| CME / CME Group Inc. | 0.00 | -28.68 | 0.77 | -25.89 | 0.7714 | -0.2791 | |||
| CRM / Salesforce, Inc. | 0.00 | 0.77 | 0.7713 | 0.7713 | |||||
| KDP / Keurig Dr Pepper Inc. | 0.02 | 366.82 | 0.76 | 396.08 | 0.7577 | 0.5955 | |||
| TXN / Texas Instruments Incorporated | 0.00 | 237.92 | 0.75 | 290.67 | 0.7532 | 0.5585 | |||
| MSI / Motorola Solutions, Inc. | 0.00 | -24.79 | 0.74 | -27.73 | 0.7383 | -0.2930 | |||
| KIM / Kimco Realty Corporation | 0.03 | -1.75 | 0.73 | -2.81 | 0.7261 | -0.0274 | |||
| JNJ / Johnson & Johnson | 0.00 | 42.94 | 0.70 | 31.65 | 0.7017 | 0.1639 | |||
| CSCO / Cisco Systems, Inc. | 0.01 | 111.67 | 0.70 | 138.10 | 0.6994 | 0.4028 | |||
| GLW / Corning Incorporated | 0.01 | 0.69 | 0.6901 | 0.6901 | |||||
| COST / Costco Wholesale Corporation | 0.00 | -10.44 | 0.68 | -6.22 | 0.6776 | -0.0518 | |||
| TJX / The TJX Companies, Inc. | 0.01 | -1.78 | 0.67 | -0.45 | 0.6671 | -0.0088 | |||
| ACN / Accenture plc | 0.00 | -37.96 | 0.66 | -40.60 | 0.6561 | -0.4579 | |||
| PKG / Packaging Corporation of America | 0.00 | -13.56 | 0.66 | -17.67 | 0.6556 | -0.1486 | |||
| WMB / The Williams Companies, Inc. | 0.01 | 133.39 | 0.64 | 145.38 | 0.6373 | 0.3751 | |||
| UPS / United Parcel Service, Inc. | 0.01 | 310.15 | 0.63 | 278.44 | 0.6308 | 0.4617 | |||
| FLS / Flowserve Corporation | 0.01 | 71.18 | 0.63 | 83.87 | 0.6258 | 0.2817 | |||
| HON / Honeywell International Inc. | 0.00 | 60.69 | 0.61 | 76.95 | 0.6127 | 0.2629 | |||
| FLEX / Flex Ltd. | 0.01 | 285.78 | 0.61 | 482.86 | 0.6108 | 0.5050 | |||
| MRVL / Marvell Technology, Inc. | 0.01 | 51.40 | 0.61 | 90.57 | 0.6055 | 0.2845 | |||
| LNG / Cheniere Energy, Inc. | 0.00 | 61.06 | 0.60 | 69.66 | 0.6031 | 0.2441 | |||
| ALL / The Allstate Corporation | 0.00 | -8.08 | 0.60 | -10.73 | 0.5983 | -0.0773 | |||
| GD / General Dynamics Corporation | 0.00 | -28.80 | 0.58 | -23.86 | 0.5835 | -0.1893 | |||
| BWA / BorgWarner Inc. | 0.02 | -1.76 | 0.57 | 14.80 | 0.5733 | 0.0694 | |||
| DD / DuPont de Nemours, Inc. | 0.01 | 8.47 | 0.57 | -0.35 | 0.5707 | -0.0073 | |||
| CUBE / CubeSmart | 0.01 | 0.46 | 0.57 | 0.00 | 0.5699 | -0.0054 | |||
| QCOM / QUALCOMM Incorporated | 0.00 | -20.43 | 0.57 | -17.49 | 0.5649 | -0.1261 | |||
| VTR / Ventas, Inc. | 0.01 | -10.59 | 0.55 | -17.86 | 0.5513 | -0.1261 | |||
| CMI / Cummins Inc. | 0.00 | -1.82 | 0.55 | 2.62 | 0.5473 | 0.0090 | |||
| HBAN / Huntington Bancshares Incorporated | 0.03 | 1,693.66 | 0.55 | 2,269.57 | 0.5444 | 0.5213 | |||
| MTZ / MasTec, Inc. | 0.00 | 13.44 | 0.54 | 65.75 | 0.5411 | 0.2115 | |||
| RL / Ralph Lauren Corporation | 0.00 | 159.97 | 0.54 | 222.75 | 0.5386 | 0.3703 | |||
| UNP / Union Pacific Corporation | 0.00 | 4,209.43 | 0.53 | 4,672.73 | 0.5243 | 0.5119 | |||
| TMO / Thermo Fisher Scientific Inc. | 0.00 | -25.91 | 0.52 | -39.70 | 0.5206 | -0.3495 | |||
| BKNG / Booking Holdings Inc. | 0.00 | -61.04 | 0.52 | -51.03 | 0.5199 | -0.5515 | |||
| AAPL / Apple Inc. | 0.00 | 11.52 | 0.52 | 2.97 | 0.5193 | 0.0106 | |||
| AXP / American Express Company | 0.00 | -1.88 | 0.52 | 16.48 | 0.5149 | 0.0683 | |||
| PCG / PG&E Corporation | 0.03 | 480.51 | 0.48 | 373.53 | 0.4823 | 0.3790 | |||
| MCO / Moody's Corporation | 0.00 | -1.93 | 0.48 | 5.69 | 0.4819 | 0.0215 | |||
| MSFT / Microsoft Corporation | 0.00 | -22.24 | 0.48 | 3.03 | 0.4754 | 0.0098 | |||
| WCN / Waste Connections, Inc. | 0.00 | 1,480.13 | 0.46 | 1,603.70 | 0.4592 | 0.4333 | |||
| HAL / Halliburton Company | 0.02 | -13.81 | 0.44 | -30.76 | 0.4384 | -0.2005 | |||
| APH / Amphenol Corporation | 0.00 | -71.58 | 0.43 | -57.26 | 0.4324 | -0.5874 | |||
| ADBE / Adobe Inc. | 0.00 | 10.56 | 0.43 | 11.43 | 0.4285 | 0.0408 | |||
| AMD / Advanced Micro Devices, Inc. | 0.00 | 26.67 | 0.42 | 75.52 | 0.4223 | 0.1787 | |||
| FOXA / Fox Corporation | 0.01 | 24.09 | 0.41 | 22.92 | 0.4125 | 0.0737 | |||
| UNM / Unum Group | 0.01 | -3.55 | 0.41 | -4.41 | 0.4116 | -0.0227 | |||
| LAD / Lithia Motors, Inc. | 0.00 | 210.43 | 0.41 | 258.26 | 0.4112 | 0.2951 | |||
| NEM / Newmont Corporation | 0.01 | 204.76 | 0.41 | 269.37 | 0.4094 | 0.2971 | |||
| YUM / Yum! Brands, Inc. | 0.00 | 1,673.38 | 0.40 | 1,823.81 | 0.4038 | 0.3813 | |||
| CTAS / Cintas Corporation | 0.00 | -54.75 | 0.40 | -50.99 | 0.3978 | -0.4203 | |||
| SPG / Simon Property Group, Inc. | 0.00 | -63.27 | 0.39 | -64.53 | 0.3870 | -0.7115 | |||
| ETN / Eaton Corporation plc | 0.00 | -64.15 | 0.39 | -52.98 | 0.3868 | -0.4421 | |||
| PNR / Pentair plc | 0.00 | 83.63 | 0.39 | 115.64 | 0.3859 | 0.2052 | |||
| OGE / OGE Energy Corp. | 0.01 | -48.01 | 0.39 | -49.87 | 0.3850 | -0.3888 | |||
| HEIA / Heico Corp. - Class A | 0.00 | -15.83 | 0.38 | 3.23 | 0.3829 | 0.0086 | |||
| MCD / McDonald's Corporation | 0.00 | 35.57 | 0.38 | 26.82 | 0.3822 | 0.0781 | |||
| T / AT&T Inc. | 0.01 | -12.81 | 0.38 | -10.77 | 0.3803 | -0.0498 | |||
| COP / ConocoPhillips | 0.00 | -33.35 | 0.38 | -43.07 | 0.3773 | -0.2912 | |||
| NDAQ / Nasdaq, Inc. | 0.00 | 14.29 | 0.37 | 34.67 | 0.3688 | 0.0926 | |||
| NUE / Nucor Corporation | 0.00 | -41.39 | 0.35 | -37.03 | 0.3519 | -0.2109 | |||
| IVZ / Invesco Ltd. | 0.02 | -22.52 | 0.35 | -19.45 | 0.3517 | -0.0889 | |||
| BX / Blackstone Inc. | 0.00 | 0.35 | 0.3473 | 0.3473 | |||||
| EIX / Edison International | 0.01 | 1,559.45 | 0.34 | 1,395.65 | 0.3434 | 0.3196 | |||
| DAL / Delta Air Lines, Inc. | 0.01 | -15.42 | 0.34 | -4.56 | 0.3344 | -0.0192 | |||
| NNN / NNN REIT, Inc. | 0.01 | 170.89 | 0.33 | 175.21 | 0.3327 | 0.2103 | |||
| NEE / NextEra Energy, Inc. | 0.00 | 189.15 | 0.33 | 184.35 | 0.3269 | 0.2104 | |||
| CNC / Centene Corporation | 0.01 | -48.93 | 0.33 | -54.39 | 0.3267 | -0.3953 | |||
| ESTC / Elastic N.V. | 0.00 | 1,258.25 | 0.33 | 1,204.00 | 0.3257 | 0.3001 | |||
| INTC / Intel Corporation | 0.01 | 10.44 | 0.31 | 9.19 | 0.3086 | 0.0227 | |||
| VRSN / VeriSign, Inc. | 0.00 | 0.30 | 0.3043 | 0.3043 | |||||
| BMRN / BioMarin Pharmaceutical Inc. | 0.01 | -31.98 | 0.30 | -47.08 | 0.2985 | -0.2709 | |||
| EXPD / Expeditors International of Washington, Inc. | 0.00 | -11.08 | 0.30 | -15.62 | 0.2973 | -0.0578 | |||
| GRMN / Garmin Ltd. | 0.00 | 76.57 | 0.29 | 69.94 | 0.2934 | 0.1190 | |||
| DHI / D.R. Horton, Inc. | 0.00 | -26.39 | 0.29 | -25.32 | 0.2885 | -0.1015 | |||
| GM / General Motors Company | 0.01 | -13.83 | 0.29 | -9.75 | 0.2868 | -0.0342 | |||
| ADSK / Autodesk, Inc. | 0.00 | -46.63 | 0.28 | -36.90 | 0.2767 | -0.1658 | |||
| AR / Antero Resources Corporation | 0.01 | 0.27 | 0.2706 | 0.2706 | |||||
| EW / Edwards Lifesciences Corporation | 0.00 | -35.24 | 0.27 | -30.18 | 0.2659 | -0.1180 | |||
| DHR / Danaher Corporation | 0.00 | 0.00 | 0.25 | -3.80 | 0.2531 | -0.0119 | |||
| CL / Colgate-Palmolive Company | 0.00 | -78.11 | 0.25 | -78.84 | 0.2494 | -0.9357 | |||
| SMG / The Scotts Miracle-Gro Company | 0.00 | 2,484.25 | 0.25 | 1,553.33 | 0.2483 | 0.2319 | |||
| PGR / The Progressive Corporation | 0.00 | -56.64 | 0.25 | -59.17 | 0.2468 | -0.3623 | |||
| MRK / Merck & Co., Inc. | 0.00 | -6.46 | 0.25 | -17.51 | 0.2447 | -0.0546 | |||
| TOL / Toll Brothers, Inc. | 0.00 | -25.24 | 0.24 | -19.21 | 0.2436 | -0.0606 | |||
| ECL / Ecolab Inc. | 0.00 | -41.06 | 0.23 | -37.43 | 0.2339 | -0.1428 | |||
| TTWO / Take-Two Interactive Software, Inc. | 0.00 | 0.23 | 0.2297 | 0.2297 | |||||
| TRGP / Targa Resources Corp. | 0.00 | 69.85 | 0.22 | 47.95 | 0.2162 | 0.0683 | |||
| CI / The Cigna Group | 0.00 | -44.52 | 0.21 | -44.44 | 0.2055 | -0.1665 | |||
| FIX / Comfort Systems USA, Inc. | 0.00 | -36.07 | 0.20 | 6.38 | 0.2001 | 0.0103 | |||
| RS / Reliance, Inc. | 0.00 | 72.10 | 0.20 | 98.98 | 0.1951 | 0.0914 | |||
| NTRA / Natera, Inc. | 0.00 | 0.00 | 0.20 | 19.63 | 0.1949 | 0.0303 | |||
| INTU / Intuit Inc. | 0.00 | 0.19 | 0.1910 | 0.1910 | |||||
| ORLY / O'Reilly Automotive, Inc. | 0.00 | 0.19 | 0.1848 | 0.1848 | |||||
| AWI / Armstrong World Industries, Inc. | 0.00 | 0.18 | 0.1809 | 0.1809 | |||||
| NVDA / NVIDIA Corporation | 0.00 | -63.08 | 0.18 | -46.22 | 0.1778 | -0.1555 | |||
| NYT / The New York Times Company | 0.00 | 115.43 | 0.18 | 143.06 | 0.1747 | 0.1022 | |||
| CVX / Chevron Corporation | 0.00 | -83.29 | 0.17 | -85.75 | 0.1743 | -1.0553 | |||
| UBER / Uber Technologies, Inc. | 0.00 | -63.38 | 0.17 | -43.42 | 0.1723 | -0.1309 | |||
| ADI / Analog Devices, Inc. | 0.00 | 731.03 | 0.17 | 975.00 | 0.1717 | 0.1538 | |||
| TYIA / Johnson Controls International plc | 0.00 | -21.22 | 0.17 | 44.92 | 0.1713 | 0.0523 | |||
| IDA / IDACORP, Inc. | 0.00 | 0.00 | 0.17 | -0.60 | 0.1675 | -0.0026 | |||
| BIIB / Biogen Inc. | 0.00 | -71.38 | 0.16 | -73.84 | 0.1644 | -0.4672 | |||
| OVV / Ovintiv Inc. | 0.00 | 81.11 | 0.16 | 62.00 | 0.1617 | 0.0603 | |||
| OC / Owens Corning | 0.00 | 103.99 | 0.16 | 96.34 | 0.1615 | 0.0785 | |||
| HUN / Huntsman Corporation | 0.02 | 0.00 | 0.16 | -33.88 | 0.1597 | -0.0845 | |||
| KEYS / Keysight Technologies, Inc. | 0.00 | 13.50 | 0.16 | 24.22 | 0.1594 | 0.0299 | |||
| UTHR / United Therapeutics Corporation | 0.00 | 0.00 | 0.16 | -7.14 | 0.1565 | -0.0129 | |||
| CAT / Caterpillar Inc. | 0.00 | -77.15 | 0.15 | -73.16 | 0.1460 | -0.4018 | |||
| RELY / Remitly Global, Inc. | 0.01 | 0.14 | 0.1446 | 0.1446 | |||||
| WAB / Westinghouse Air Brake Technologies Corporation | 0.00 | 0.00 | 0.14 | 15.20 | 0.1445 | 0.0182 | |||
| INGR / Ingredion Incorporated | 0.00 | -57.12 | 0.14 | -57.10 | 0.1422 | -0.1914 | |||
| KNX / Knight-Swift Transportation Holdings Inc. | 0.00 | -22.81 | 0.14 | -21.59 | 0.1382 | -0.0394 | |||
| FI / Fiserv, Inc. | 0.00 | -6.07 | 0.13 | 49.44 | 0.1331 | 0.0488 | |||
| NVR / NVR, Inc. | 0.00 | 0.00 | 0.13 | 1.54 | 0.1326 | 0.0014 | |||
| NI / NiSource Inc. | 0.00 | -28.89 | 0.13 | 3.15 | 0.1309 | -0.0059 | |||
| ONTO / Onto Innovation Inc. | 0.00 | 154.89 | 0.13 | 113.33 | 0.1286 | 0.0674 | |||
| INCY / Incyte Corporation | 0.00 | 0.00 | 0.13 | 12.28 | 0.1283 | 0.0132 | |||
| BBY / Best Buy Co., Inc. | 0.00 | 144.22 | 0.13 | 122.81 | 0.1273 | 0.0696 | |||
| CHRD / Chord Energy Corporation | 0.00 | 0.12 | 0.1223 | 0.1223 | |||||
| CR / Crane Company | 0.00 | 0.12 | 0.1205 | 0.1205 | |||||
| CHYM / Chime Financial, Inc. | 0.00 | 0.12 | 0.1187 | 0.1187 | |||||
| AZO / AutoZone, Inc. | 0.00 | 0.12 | 0.1185 | 0.1185 | |||||
| LRCX / Lam Research Corporation | 0.00 | 42.79 | 0.11 | 91.53 | 0.1134 | 0.0536 | |||
| AN / AutoNation, Inc. | 0.00 | -54.20 | 0.11 | -45.15 | 0.1134 | -0.0774 | |||
| XP / XP Inc. | 0.01 | 0.11 | 0.1095 | 0.1095 | |||||
| Etoro Group Ltd., Class A / EC (VGG320891077) | 0.00 | 0.11 | 0.1060 | 0.1060 | |||||
| GILD / Gilead Sciences, Inc. | 0.00 | -86.16 | 0.10 | -86.29 | 0.0988 | -0.6288 | |||
| WM / Waste Management, Inc. | 0.00 | 0.00 | 0.10 | -1.02 | 0.0973 | -0.0020 | |||
| MU / Micron Technology, Inc. | 0.00 | -58.27 | 0.10 | -40.74 | 0.0962 | -0.0678 | |||
| IBKR / Interactive Brokers Group, Inc. | 0.00 | 1,220.00 | 0.09 | 355.00 | 0.0912 | 0.0704 | |||
| SLDE / Slide Insurance Holdings, Inc. | 0.00 | 0.09 | 0.0863 | 0.0863 | |||||
| WELL / Welltower Inc. | 0.00 | 0.09 | 0.0854 | 0.0854 | |||||
| ALLE / Allegion plc | 0.00 | -83.02 | 0.09 | -79.62 | 0.0850 | -0.3555 | |||
| CRDO / Credo Technology Group Holding Ltd | 0.00 | 0.08 | 0.0816 | 0.0816 | |||||
| FICO / Fair Isaac Corporation | 0.00 | -27.87 | 0.08 | -28.57 | 0.0802 | -0.0330 | |||
| BMI / Badger Meter, Inc. | 0.00 | 0.00 | 0.07 | 28.57 | 0.0721 | 0.0156 | |||
| AA / Alcoa Corporation | 0.00 | 37.17 | 0.07 | 20.00 | 0.0667 | 0.0152 | |||
| KO / The Coca-Cola Company | 0.00 | -87.64 | 0.07 | -87.87 | 0.0664 | -0.4821 | |||
| GAP / The Gap, Inc. | 0.00 | 155.65 | 0.07 | 140.74 | 0.0655 | 0.0378 | |||
| PINS / Pinterest, Inc. | 0.00 | 5.43 | 0.07 | 22.64 | 0.0653 | 0.0113 | |||
| NXT / Nextracker Inc. | 0.00 | 0.06 | 0.0635 | 0.0635 | |||||
| ALK / Alaska Air Group, Inc. | 0.00 | -17.32 | 0.06 | -9.37 | 0.0580 | -0.0029 | |||
| DUK / Duke Energy Corporation | 0.00 | 0.00 | 0.06 | -3.45 | 0.0569 | -0.0024 | |||
| VEEV / Veeva Systems Inc. | 0.00 | 0.06 | 0.0555 | 0.0555 | |||||
| MLI / Mueller Industries, Inc. | 0.00 | 0.05 | 0.0510 | 0.0510 | |||||
| JNPR / Juniper Networks, Inc. | 0.00 | -1.46 | 0.05 | 10.87 | 0.0509 | 0.0037 | |||
| MRNA / Moderna, Inc. | 0.00 | 64.36 | 0.05 | 9.52 | 0.0465 | 0.0040 | |||
| GDDY / GoDaddy Inc. | 0.00 | -62.18 | 0.05 | 4.65 | 0.0449 | -0.0033 | |||
| VLTO / Veralto Corporation | 0.00 | 0.04 | 0.0425 | 0.0425 | |||||
| DT / Dynatrace, Inc. | 0.00 | 0.04 | 0.0420 | 0.0420 | |||||
| KMX / CarMax, Inc. | 0.00 | 0.04 | 0.0416 | 0.0416 | |||||
| ACHC / Acadia Healthcare Company, Inc. | 0.00 | 193.30 | 0.04 | 116.67 | 0.0396 | 0.0214 | |||
| EVR / Evercore Inc. | 0.00 | -90.13 | 0.04 | -64.15 | 0.0380 | -0.0751 | |||
| TEAM / Atlassian Corporation | 0.00 | 0.04 | 0.0375 | 0.0375 | |||||
| SFM / Sprouts Farmers Market, Inc. | 0.00 | 0.04 | 0.0375 | 0.0375 | |||||
| DOW / Dow Inc. | 0.00 | 0.04 | 0.0369 | 0.0369 | |||||
| SRPT / Sarepta Therapeutics, Inc. | 0.00 | 0.04 | 0.0364 | 0.0364 | |||||
| CTSH / Cognizant Technology Solutions Corporation | 0.00 | 0.04 | 0.0350 | 0.0350 | |||||
| RBRK / Rubrik, Inc. | 0.00 | 0.03 | 0.0344 | 0.0344 | |||||
| RMBS / Rambus Inc. | 0.00 | 0.03 | 0.0332 | 0.0332 | |||||
| ROK / Rockwell Automation, Inc. | 0.00 | -79.21 | 0.03 | -76.43 | 0.0331 | -0.0961 | |||
| S&P 500 E-Mini Index / DE (N/A) | 0.03 | 0.0331 | 0.0331 | ||||||
| FOX / Fox Corporation | 0.00 | -1.08 | 0.03 | -2.94 | 0.0330 | -0.0014 | |||
| QRVO / Qorvo, Inc. | 0.00 | 0.03 | 0.0322 | 0.0322 | |||||
| URBN / Urban Outfitters, Inc. | 0.00 | -54.91 | 0.03 | -38.78 | 0.0309 | -0.0191 | |||
| GEHC / GE HealthCare Technologies Inc. | 0.00 | 0.03 | 0.0275 | 0.0275 | |||||
| BKH / Black Hills Corporation | 0.00 | 0.00 | 0.03 | -10.34 | 0.0269 | -0.0024 | |||
| XRAY / DENTSPLY SIRONA Inc. | 0.00 | 99.28 | 0.03 | -50.00 | 0.0261 | -0.0282 | |||
| SFD / Smithfield Foods, Inc. | 0.00 | 0.02 | 0.0226 | 0.0226 | |||||
| ITW / Illinois Tool Works Inc. | 0.00 | 0.00 | 0.02 | 0.00 | 0.0217 | -0.0003 | |||
| BFAM / Bright Horizons Family Solutions Inc. | 0.00 | -80.00 | 0.02 | -80.56 | 0.0211 | -0.0883 | |||
| DOV / Dover Corporation | 0.00 | 0.00 | 0.02 | 5.00 | 0.0210 | 0.0007 | |||
| THC / Tenet Healthcare Corporation | 0.00 | -90.00 | 0.01 | -87.72 | 0.0149 | -0.1002 | |||
| DXC / DXC Technology Company | 0.00 | 0.00 | 0.01 | -12.50 | 0.0148 | -0.0019 | |||
| FIVE / Five Below, Inc. | 0.00 | -66.34 | 0.01 | -75.93 | 0.0136 | -0.0475 | |||
| CAI / Caris Life Sciences, Inc. | 0.00 | 0.01 | 0.0135 | 0.0135 | |||||
| BJ / BJ's Wholesale Club Holdings, Inc. | 0.00 | 0.01 | 0.0134 | 0.0134 | |||||
| ZG / Zillow Group, Inc. | 0.00 | 0.00 | 0.01 | 0.00 | 0.0126 | 0.0002 | |||
| MNST / Monster Beverage Corporation | 0.00 | -98.36 | 0.01 | -97.95 | 0.0111 | -0.4988 | |||
| PSA / Public Storage | 0.00 | -96.64 | 0.01 | -97.01 | 0.0108 | -0.3251 | |||
| DNB / Dun & Bradstreet Holdings, Inc. | 0.00 | 0.01 | 0.0107 | 0.0107 | |||||
| VOYG / Voyager Technologies, Inc. | 0.00 | 0.01 | 0.0055 | 0.0055 | |||||
| UA / Under Armour, Inc. | 0.00 | -2.38 | 0.00 | 0.00 | 0.0048 | 0.0002 | |||
| KRMN / Karman Holdings Inc. | 0.00 | -100.00 | 0.00 | -100.00 | -0.0530 | ||||
| IRM / Iron Mountain Incorporated | 0.00 | -100.00 | 0.00 | -100.00 | -0.4353 | ||||
| CIVI / Civitas Resources, Inc. | 0.00 | -100.00 | 0.00 | -100.00 | -0.0204 | ||||
| MTSR / Metsera, Inc. | 0.00 | -100.00 | 0.00 | -100.00 | -0.0267 | ||||
| MTSR / Metsera, Inc. | 0.00 | -100.00 | 0.00 | -100.00 | -0.0267 | ||||
| SAIL / SailPoint, Inc. | 0.00 | -100.00 | 0.00 | -100.00 | -0.0203 | ||||
| MHK / Mohawk Industries, Inc. | 0.00 | -100.00 | 0.00 | -100.00 | -0.0382 | ||||
| BBNX / Beta Bionics, Inc. | 0.00 | -100.00 | 0.00 | -100.00 | -0.0212 | ||||
| EHC / Encompass Health Corporation | 0.00 | -100.00 | 0.00 | -100.00 | -0.1297 | ||||
| HLI / Houlihan Lokey, Inc. | 0.00 | -100.00 | 0.00 | -100.00 | -0.0231 | ||||
| FLOC / Flowco Holdings Inc. | 0.00 | -100.00 | 0.00 | -100.00 | -0.0347 | ||||
| IBM / International Business Machines Corporation | 0.00 | -100.00 | 0.00 | -100.00 | -0.0874 | ||||
| ETSY / Etsy, Inc. | 0.00 | -100.00 | 0.00 | -100.00 | -0.1489 |