Statistik Asas
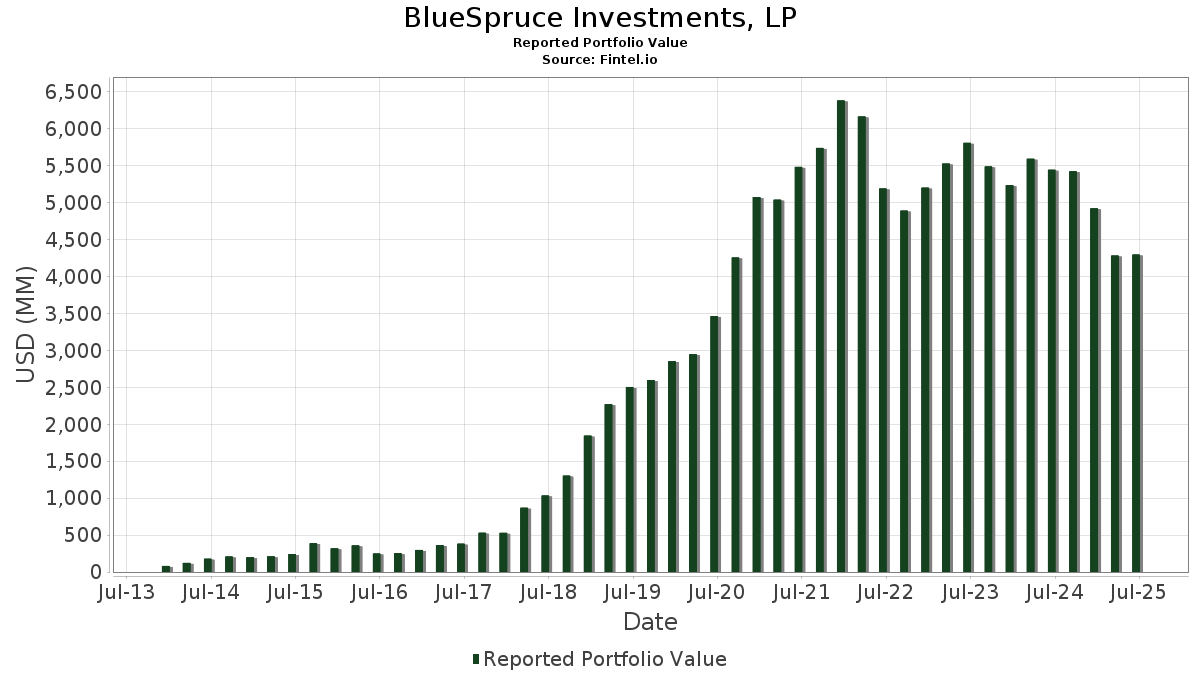
| Nilai Portfolio | $ 4,296,241,761 |
| Kedudukan Semasa | 34 |
Pegangan Terkini, Prestasi, AUM (dari 13F, 13D)
BlueSpruce Investments, LP telah mendedahkan 34 jumlah pegangan dalam pemfailan SEC terkini mereka. Nilai portfolio terkini dikira sebagai $ 4,296,241,761 USD. Aset Sebenar Di Bawah Pengurusan (AUM) ialah nilai ini ditambah dengan tunai (yang tidak didedahkan). Pegangan teratas BlueSpruce Investments, LP ialah Microsoft Corporation (US:MSFT) , Taiwan Semiconductor Manufacturing Company Limited - Depositary Receipt (Common Stock) (US:TSM) , Amazon.com, Inc. (US:AMZN) , Meta Platforms, Inc. (US:META) , and Danaher Corporation (US:DHR) . Kedudukan baharu BlueSpruce Investments, LP termasuk Intuitive Surgical, Inc. (US:ISRG) , Costco Wholesale Corporation (US:COST) , .
Kenaikan Teratas Suku Tahun Ini
Kami menggunakan perubahan dalam peruntukan portfolio kerana ini adalah metrik yang paling bermakna. Perubahan boleh disebabkan oleh perdagangan atau perubahan dalam harga saham.
| Sekuriti | Saham (MM) |
Nilai (MM$) |
Portfolio % | ΔPortfolio % |
|---|---|---|---|---|
| 3.93 | 220.71 | 5.1373 | 5.1188 | |
| 1.34 | 667.45 | 15.5356 | 3.1544 | |
| 0.75 | 117.33 | 2.7310 | 2.7177 | |
| 2.09 | 474.00 | 11.0329 | 1.7393 | |
| 0.57 | 424.40 | 9.8784 | 0.8584 | |
| 0.01 | 0.76 | 0.0177 | 0.0177 | |
| 0.00 | 0.58 | 0.0136 | 0.0136 | |
| 0.00 | 0.58 | 0.0136 | 0.0136 | |
| 0.00 | 0.57 | 0.0132 | 0.0132 | |
| 0.00 | 0.54 | 0.0126 | 0.0126 |
Penurunan Teratas Suku Tahun Ini
Kami menggunakan perubahan dalam peruntukan portfolio kerana ini adalah metrik yang paling bermakna. Perubahan boleh disebabkan oleh perdagangan atau perubahan dalam harga saham.
| Sekuriti | Saham (MM) |
Nilai (MM$) |
Portfolio % | ΔPortfolio % |
|---|---|---|---|---|
| 0.00 | 0.87 | 0.0203 | -6.7488 | |
| 0.57 | 298.47 | 6.9473 | -2.2888 | |
| 0.59 | 329.74 | 7.6750 | -1.7547 | |
| 2.12 | 465.14 | 10.8268 | -0.8546 | |
| 2.12 | 417.96 | 9.7285 | -0.8394 | |
| 0.88 | 346.64 | 8.0685 | -0.7390 | |
| 0.67 | 269.93 | 6.2830 | -0.2590 | |
| 0.91 | 248.13 | 5.7754 | -0.1487 | |
| 0.00 | 0.43 | 0.0100 | -0.0052 | |
| 0.00 | 0.65 | 0.0152 | -0.0047 |
13F dan Pemfailan Dana
Borang ini telah difailkan pada 2025-08-14 untuk tempoh pelaporan 2025-06-30. Klik ikon pautan untuk melihat sejarah transaksi penuh.
Tingkatkan untuk membuka data premium dan eksport ke Excel ![]() .
.
| Sekuriti | Jenis | Purata Harga Saham | Saham (MM) |
ΔSaham (%) |
ΔSaham (%) |
Nilai ($MM) |
Portfolio (%) |
ΔPortfolio (%) |
|
|---|---|---|---|---|---|---|---|---|---|
| MSFT / Microsoft Corporation | 1.34 | -5.00 | 667.45 | 25.88 | 15.5356 | 3.1544 | |||
| TSM / Taiwan Semiconductor Manufacturing Company Limited - Depositary Receipt (Common Stock) | 2.09 | -12.71 | 474.00 | 19.09 | 11.0329 | 1.7393 | |||
| AMZN / Amazon.com, Inc. | 2.12 | -19.37 | 465.14 | -7.02 | 10.8268 | -0.8546 | |||
| META / Meta Platforms, Inc. | 0.57 | -14.21 | 424.40 | 9.87 | 9.8784 | 0.8584 | |||
| DHR / Danaher Corporation | 2.12 | -4.16 | 417.96 | -7.65 | 9.7285 | -0.8394 | |||
| SYK / Stryker Corporation | 0.88 | -13.53 | 346.64 | -8.10 | 8.0685 | -0.7390 | |||
| MA / Mastercard Incorporated | 0.59 | -20.36 | 329.74 | -18.35 | 7.6750 | -1.7547 | |||
| SPGI / S&P Global Inc. | 0.57 | -27.29 | 298.47 | -24.54 | 6.9473 | -2.2888 | |||
| TMO / Thermo Fisher Scientific Inc. | 0.67 | 18.24 | 269.93 | -3.65 | 6.2830 | -0.2590 | |||
| CRM / Salesforce, Inc. | 0.91 | -3.75 | 248.13 | -2.20 | 5.7754 | -0.1487 | |||
| CMG / Chipotle Mexican Grill, Inc. | 3.93 | 24,760.74 | 220.71 | 27,732.28 | 5.1373 | 5.1188 | |||
| ZTS / Zoetis Inc. | 0.75 | 21,663.12 | 117.33 | 20,520.21 | 2.7310 | 2.7177 | |||
| NVDA / NVIDIA Corporation | 0.01 | 0.00 | 1.18 | 45.74 | 0.0275 | 0.0086 | |||
| NOW / ServiceNow, Inc. | 0.00 | 38.27 | 1.11 | 78.53 | 0.0259 | 0.0114 | |||
| IDXX / IDEXX Laboratories, Inc. | 0.00 | 0.00 | 1.10 | 27.73 | 0.0256 | 0.0055 | |||
| ASML / ASML Holding N.V. - Depositary Receipt (Common Stock) | 0.00 | 41.98 | 1.04 | 71.93 | 0.0241 | 0.0100 | |||
| SNPS / Synopsys, Inc. | 0.00 | 0.00 | 0.94 | 19.64 | 0.0218 | 0.0035 | |||
| ADBE / Adobe Inc. | 0.00 | -99.70 | 0.87 | -99.70 | 0.0203 | -6.7488 | |||
| MSCI / MSCI Inc. | 0.00 | 0.00 | 0.84 | 1.94 | 0.0196 | 0.0003 | |||
| ADSK / Autodesk, Inc. | 0.00 | -17.08 | 0.84 | -1.99 | 0.0195 | -0.0005 | |||
| AVGO / Broadcom Inc. | 0.00 | 0.00 | 0.80 | 64.61 | 0.0186 | 0.0073 | |||
| A / Agilent Technologies, Inc. | 0.01 | 0.76 | 0.0177 | 0.0177 | |||||
| CPRT / Copart, Inc. | 0.01 | 3.59 | 0.69 | -10.12 | 0.0161 | -0.0019 | |||
| INTU / Intuit Inc. | 0.00 | -40.40 | 0.65 | -23.65 | 0.0152 | -0.0047 | |||
| ANET / Arista Networks Inc | 0.01 | 0.00 | 0.63 | 31.93 | 0.0146 | 0.0035 | |||
| PTC / PTC Inc. | 0.00 | 0.00 | 0.61 | 11.13 | 0.0142 | 0.0014 | |||
| ISRG / Intuitive Surgical, Inc. | 0.00 | 0.58 | 0.0136 | 0.0136 | |||||
| MCO / Moody's Corporation | 0.00 | 0.58 | 0.0136 | 0.0136 | |||||
| CDNS / Cadence Design Systems, Inc. | 0.00 | -33.50 | 0.57 | -19.52 | 0.0134 | -0.0033 | |||
| COST / Costco Wholesale Corporation | 0.00 | 0.57 | 0.0132 | 0.0132 | |||||
| YUM / Yum! Brands, Inc. | 0.00 | 0.00 | 0.56 | -5.86 | 0.0131 | -0.0009 | |||
| FI / Fiserv, Inc. | 0.00 | 0.54 | 0.0126 | 0.0126 | |||||
| WMT / Walmart Inc. | 0.00 | 0.00 | 0.43 | 11.66 | 0.0100 | 0.0010 | |||
| TDG / TransDigm Group Incorporated | 0.00 | -40.04 | 0.43 | -34.05 | 0.0100 | -0.0052 | |||
| ADP / Automatic Data Processing, Inc. | 0.00 | -100.00 | 0.00 | 0.0000 | |||||
| ABT / Abbott Laboratories | 0.00 | -100.00 | 0.00 | 0.0000 | |||||
| GE / General Electric Company | 0.00 | -100.00 | 0.00 | 0.0000 | |||||
| CTAS / Cintas Corporation | 0.00 | -100.00 | 0.00 | 0.0000 | |||||
| AMAT / Applied Materials, Inc. | 0.00 | -100.00 | 0.00 | 0.0000 |