Statistik Asas
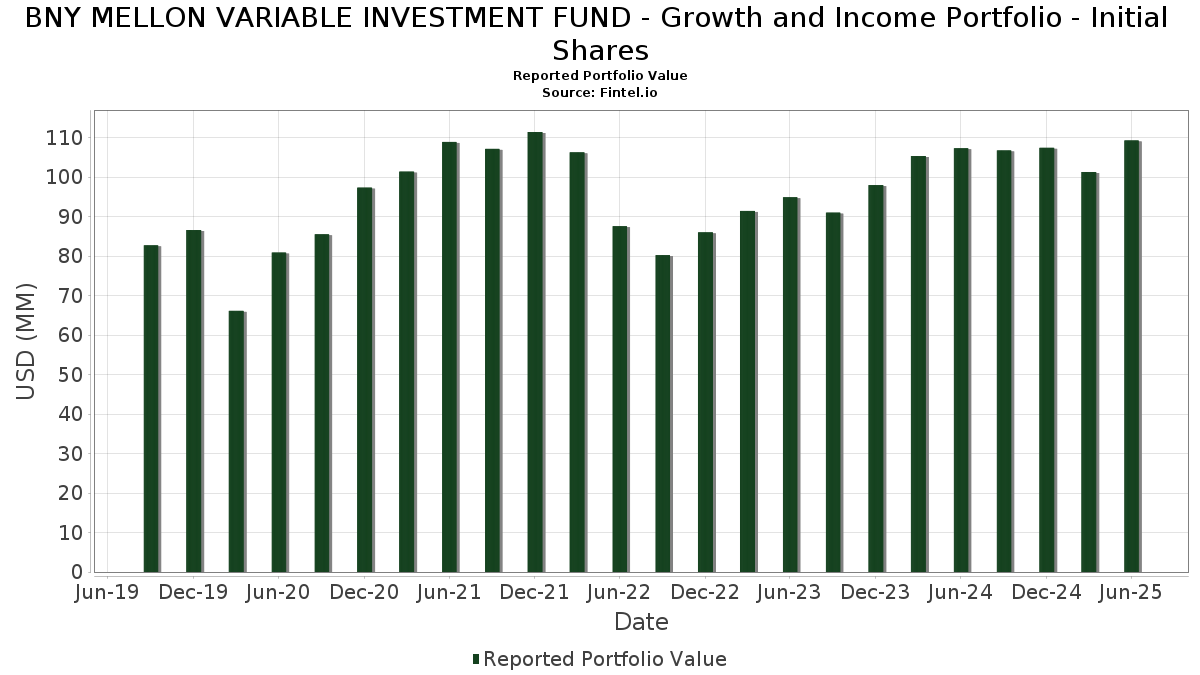
| Nilai Portfolio | $ 109,271,012 |
| Kedudukan Semasa | 111 |
Pegangan Terkini, Prestasi, AUM (dari 13F, 13D)
BNY MELLON VARIABLE INVESTMENT FUND - Growth and Income Portfolio - Initial Shares telah mendedahkan 111 jumlah pegangan dalam pemfailan SEC terkini mereka. Nilai portfolio terkini dikira sebagai $ 109,271,012 USD. Aset Sebenar Di Bawah Pengurusan (AUM) ialah nilai ini ditambah dengan tunai (yang tidak didedahkan). Pegangan teratas BNY MELLON VARIABLE INVESTMENT FUND - Growth and Income Portfolio - Initial Shares ialah NVIDIA Corporation (US:NVDA) , Microsoft Corporation (US:MSFT) , Amazon.com, Inc. (US:AMZN) , Apple Inc. (US:AAPL) , and Alphabet Inc. (US:GOOG) . Kedudukan baharu BNY MELLON VARIABLE INVESTMENT FUND - Growth and Income Portfolio - Initial Shares termasuk Mastercard Incorporated (US:MA) , Intuit Inc. (US:INTU) , Spotify Technology S.A. (CH:SPF) , Bentley Systems, Incorporated (US:BSY) , and The TJX Companies, Inc. (US:TJX) .
Kenaikan Teratas Suku Tahun Ini
Kami menggunakan perubahan dalam peruntukan portfolio kerana ini adalah metrik yang paling bermakna. Perubahan boleh disebabkan oleh perdagangan atau perubahan dalam harga saham.
| Sekuriti | Saham (MM) |
Nilai (MM$) |
Portfolio % | ΔPortfolio % |
|---|---|---|---|---|
| 2.04 | 2.04 | 1.8681 | 1.8681 | |
| 0.00 | 1.75 | 1.6053 | 1.6053 | |
| 0.00 | 1.88 | 1.7273 | 1.1488 | |
| 0.06 | 9.24 | 8.4721 | 1.0046 | |
| 0.00 | 0.82 | 0.7503 | 0.7503 | |
| 0.00 | 0.67 | 0.6135 | 0.6135 | |
| 0.01 | 0.66 | 0.6064 | 0.6064 | |
| 0.00 | 0.87 | 0.7966 | 0.5669 | |
| 0.00 | 0.52 | 0.4805 | 0.4805 | |
| 0.00 | 0.44 | 0.4029 | 0.4029 |
Penurunan Teratas Suku Tahun Ini
Kami menggunakan perubahan dalam peruntukan portfolio kerana ini adalah metrik yang paling bermakna. Perubahan boleh disebabkan oleh perdagangan atau perubahan dalam harga saham.
| Sekuriti | Saham (MM) |
Nilai (MM$) |
Portfolio % | ΔPortfolio % |
|---|---|---|---|---|
| 0.02 | 4.81 | 4.4144 | -1.4873 | |
| 0.02 | 5.31 | 4.8700 | -0.9007 | |
| 0.01 | 0.32 | 0.2898 | -0.8319 | |
| 0.00 | 0.78 | 0.7108 | -0.7721 | |
| 0.00 | 1.62 | 1.4830 | -0.6273 | |
| 0.01 | 0.95 | 0.8752 | -0.5618 | |
| 0.01 | 0.36 | 0.3301 | -0.5221 | |
| 0.02 | 2.99 | 2.7430 | -0.4694 | |
| 0.05 | 1.51 | 1.3800 | -0.4600 | |
| 0.00 | 0.24 | 0.2160 | -0.3935 |
13F dan Pemfailan Dana
Borang ini telah difailkan pada 2025-08-26 untuk tempoh pelaporan 2025-06-30. Klik ikon pautan untuk melihat sejarah transaksi penuh.
Tingkatkan untuk membuka data premium dan eksport ke Excel ![]() .
.
| Sekuriti | Jenis | Purata Harga Saham | Saham (MM) |
ΔSaham (%) |
ΔSaham (%) |
Nilai ($MM) |
Portfolio (%) |
ΔPortfolio (%) |
|
|---|---|---|---|---|---|---|---|---|---|
| NVDA / NVIDIA Corporation | 0.06 | -5.38 | 9.24 | 37.93 | 8.4721 | 1.0046 | |||
| MSFT / Microsoft Corporation | 0.01 | -1.54 | 5.81 | 30.46 | 5.3287 | 0.3629 | |||
| AMZN / Amazon.com, Inc. | 0.02 | -11.02 | 5.31 | 2.59 | 4.8700 | -0.9007 | |||
| AAPL / Apple Inc. | 0.02 | -1.54 | 4.81 | -9.07 | 4.4144 | -1.4873 | |||
| GOOG / Alphabet Inc. | 0.02 | -8.57 | 2.99 | 3.82 | 2.7430 | -0.4694 | |||
| JPM / JPMorgan Chase & Co. | 0.01 | 4.36 | 2.10 | 23.37 | 1.9219 | 0.0274 | |||
| DREYFUS INSTITUTIONAL PREFERRED GOVERNMENT PLUS MONEY MARKET FUND / STIV (000000000) | 2.04 | 2.04 | 1.8681 | 1.8681 | |||||
| HUBB / Hubbell Incorporated | 0.00 | -4.76 | 1.91 | 17.52 | 1.7471 | -0.0599 | |||
| GS / The Goldman Sachs Group, Inc. | 0.00 | 180.21 | 1.88 | 263.71 | 1.7273 | 1.1488 | |||
| CSCO / Cisco Systems, Inc. | 0.03 | 5.35 | 1.83 | 18.45 | 1.6786 | -0.0443 | |||
| MA / Mastercard Incorporated | 0.00 | 1.75 | 1.6053 | 1.6053 | |||||
| AVGO / Broadcom Inc. | 0.01 | -7.84 | 1.69 | 51.71 | 1.5469 | 0.3073 | |||
| GOOGL / Alphabet Inc. | 0.01 | -1.55 | 1.63 | 12.19 | 1.4939 | -0.1250 | |||
| BRK.B / Berkshire Hathaway Inc. | 0.00 | -6.33 | 1.62 | -14.58 | 1.4830 | -0.6273 | |||
| NFLX / Netflix, Inc. | 0.00 | -1.52 | 1.56 | 41.42 | 1.4278 | 0.2003 | |||
| T / AT&T Inc. | 0.05 | -10.90 | 1.51 | -8.79 | 1.3800 | -0.4600 | |||
| JNJ / Johnson & Johnson | 0.01 | 39.13 | 1.48 | 28.15 | 1.3609 | 0.0698 | |||
| DIS / The Walt Disney Company | 0.01 | -1.85 | 1.39 | 23.29 | 1.2725 | 0.0180 | |||
| LHX / L3Harris Technologies, Inc. | 0.01 | 1.17 | 1.38 | 21.19 | 1.2697 | -0.0035 | |||
| BAC / Bank of America Corporation | 0.03 | -16.52 | 1.35 | -5.33 | 1.2390 | -0.3522 | |||
| HWM / Howmet Aerospace Inc. | 0.01 | -20.67 | 1.22 | 13.82 | 1.1179 | -0.0762 | |||
| MDT / Medtronic plc | 0.01 | 3.72 | 1.22 | 0.66 | 1.1179 | -0.2329 | |||
| DHR / Danaher Corporation | 0.01 | -1.93 | 1.18 | -5.51 | 1.0848 | -0.3108 | |||
| AIZ / Assurant, Inc. | 0.01 | -2.15 | 1.17 | -7.88 | 1.0722 | -0.3427 | |||
| ALC / Alcon Inc. | 0.01 | 1.64 | 1.16 | -5.53 | 1.0660 | -0.3051 | |||
| AME / AMETEK, Inc. | 0.01 | 1.71 | 1.10 | 6.92 | 1.0065 | -0.1380 | |||
| ICE / Intercontinental Exchange, Inc. | 0.01 | -14.66 | 1.08 | -9.26 | 0.9892 | -0.3357 | |||
| EQT / EQT Corporation | 0.02 | -19.19 | 1.07 | -11.77 | 0.9832 | -0.3721 | |||
| COF / Capital One Financial Corporation | 0.00 | 22.03 | 0.99 | 44.80 | 0.9076 | 0.1456 | |||
| RCL / Royal Caribbean Cruises Ltd. | 0.00 | 0.03 | 0.98 | 52.48 | 0.9009 | 0.1825 | |||
| CSGP / CoStar Group, Inc. | 0.01 | -27.03 | 0.95 | -25.99 | 0.8752 | -0.5618 | |||
| ISRG / Intuitive Surgical, Inc. | 0.00 | -1.57 | 0.95 | 7.94 | 0.8733 | -0.1098 | |||
| SHOP / Shopify Inc. | 0.01 | -24.43 | 0.93 | -8.67 | 0.8500 | -0.2820 | |||
| AON / Aon plc | 0.00 | 2.49 | 0.92 | -8.33 | 0.8471 | -0.2770 | |||
| XOM / Exxon Mobil Corporation | 0.01 | 1.53 | 0.92 | -7.98 | 0.8466 | -0.2718 | |||
| CRH / CRH plc | 0.01 | 28.84 | 0.92 | 34.45 | 0.8446 | 0.0808 | |||
| IP / International Paper Company | 0.02 | 25.09 | 0.92 | 9.83 | 0.8403 | -0.0901 | |||
| AIG / American International Group, Inc. | 0.01 | 15.05 | 0.88 | 13.35 | 0.8096 | -0.0594 | |||
| CSX / CSX Corporation | 0.03 | 9.22 | 0.88 | 21.15 | 0.8093 | -0.0032 | |||
| NOW / ServiceNow, Inc. | 0.00 | 17.92 | 0.87 | 52.18 | 0.8002 | 0.1613 | |||
| GEV / GE Vernova Inc. | 0.00 | 143.26 | 0.87 | 321.36 | 0.7966 | 0.5669 | |||
| CME / CME Group Inc. | 0.00 | -21.75 | 0.86 | -18.74 | 0.7919 | -0.3923 | |||
| XYZ / Block, Inc. | 0.01 | -1.60 | 0.84 | 22.99 | 0.7710 | 0.0091 | |||
| SNPS / Synopsys, Inc. | 0.00 | 6.89 | 0.83 | 27.82 | 0.7586 | 0.0368 | |||
| INTU / Intuit Inc. | 0.00 | 0.82 | 0.7503 | 0.7503 | |||||
| CEG / Constellation Energy Corporation | 0.00 | 7.68 | 0.79 | 72.21 | 0.7223 | 0.2128 | |||
| AXON / Axon Enterprise, Inc. | 0.00 | 0.00 | 0.78 | 57.58 | 0.7158 | 0.1630 | |||
| UNH / UnitedHealth Group Incorporated | 0.00 | -2.17 | 0.78 | -41.73 | 0.7108 | -0.7721 | |||
| PSX / Phillips 66 | 0.01 | 23.73 | 0.76 | 19.69 | 0.6969 | -0.0119 | |||
| MPC / Marathon Petroleum Corporation | 0.00 | 30.28 | 0.76 | 48.53 | 0.6938 | 0.1260 | |||
| LVS / Las Vegas Sands Corp. | 0.02 | -17.57 | 0.69 | -7.15 | 0.6315 | -0.1954 | |||
| FHN / First Horizon Corporation | 0.03 | -2.14 | 0.69 | 6.84 | 0.6304 | -0.0871 | |||
| 2IS / Trane Technologies plc | 0.00 | -35.47 | 0.67 | -16.17 | 0.6136 | -0.2768 | |||
| SPF / Spotify Technology S.A. | 0.00 | 0.67 | 0.6135 | 0.6135 | |||||
| BSY / Bentley Systems, Incorporated | 0.01 | 0.66 | 0.6064 | 0.6064 | |||||
| PM / Philip Morris International Inc. | 0.00 | -17.40 | 0.66 | -5.32 | 0.6050 | -0.1710 | |||
| ZTS / Zoetis Inc. | 0.00 | -1.55 | 0.63 | -6.76 | 0.5819 | -0.1768 | |||
| DXCM / DexCom, Inc. | 0.01 | -11.95 | 0.63 | 12.50 | 0.5780 | -0.0464 | |||
| VLTO / Veralto Corporation | 0.01 | 36.46 | 0.61 | 41.20 | 0.5601 | 0.0784 | |||
| HUBS / HubSpot, Inc. | 0.00 | -17.19 | 0.61 | -19.31 | 0.5557 | -0.2816 | |||
| VRT / Vertiv Holdings Co | 0.00 | 16.90 | 0.60 | 108.28 | 0.5545 | 0.2303 | |||
| MU / Micron Technology, Inc. | 0.00 | -31.56 | 0.60 | -2.90 | 0.5535 | -0.1397 | |||
| TE Connectivity PLC / EC (IE000IVNQZ81) | 0.00 | 134.57 | 0.60 | 180.66 | 0.5456 | 0.3087 | |||
| DLB / Dolby Laboratories, Inc. | 0.01 | -14.33 | 0.59 | -20.81 | 0.5413 | -0.2895 | |||
| DDOG / Datadog, Inc. | 0.00 | 63.46 | 0.58 | 121.21 | 0.5361 | 0.2416 | |||
| FCX / Freeport-McMoRan Inc. | 0.01 | -3.09 | 0.58 | 11.09 | 0.5331 | -0.0510 | |||
| BSX / Boston Scientific Corporation | 0.01 | -1.55 | 0.58 | 4.69 | 0.5325 | -0.0851 | |||
| SCHW / The Charles Schwab Corporation | 0.01 | 62.19 | 0.57 | 169.52 | 0.5192 | 0.2863 | |||
| AMAT / Applied Materials, Inc. | 0.00 | 42.42 | 0.56 | 79.74 | 0.5128 | 0.1658 | |||
| CASY / Casey's General Stores, Inc. | 0.00 | -1.59 | 0.54 | 15.77 | 0.4921 | -0.0250 | |||
| LH / Labcorp Holdings Inc. | 0.00 | -2.13 | 0.53 | 10.40 | 0.4876 | -0.0494 | |||
| TJX / The TJX Companies, Inc. | 0.00 | 0.52 | 0.4805 | 0.4805 | |||||
| FERG / Ferguson Enterprises Inc. | 0.00 | 57.00 | 0.52 | 113.58 | 0.4767 | 0.2051 | |||
| IBM / International Business Machines Corporation | 0.00 | -3.08 | 0.52 | 14.86 | 0.4757 | -0.0277 | |||
| LLY / Eli Lilly and Company | 0.00 | -2.53 | 0.51 | -8.11 | 0.4681 | -0.1505 | |||
| MDB / MongoDB, Inc. | 0.00 | 63.32 | 0.49 | 95.62 | 0.4509 | 0.1705 | |||
| ILMN / Illumina, Inc. | 0.00 | -25.75 | 0.47 | -10.78 | 0.4334 | -0.1567 | |||
| PLNT / Planet Fitness, Inc. | 0.00 | -25.65 | 0.47 | -16.04 | 0.4321 | -0.1939 | |||
| WY / Weyerhaeuser Company | 0.02 | 62.32 | 0.47 | 42.51 | 0.4273 | 0.0625 | |||
| RGEN / Repligen Corporation | 0.00 | 22.92 | 0.47 | 20.16 | 0.4268 | -0.0050 | |||
| EL / The Estée Lauder Companies Inc. | 0.01 | 46.13 | 0.45 | 79.45 | 0.4165 | 0.1335 | |||
| CCK / Crown Holdings, Inc. | 0.00 | -11.38 | 0.45 | 2.26 | 0.4152 | -0.0786 | |||
| MET / MetLife, Inc. | 0.01 | -15.34 | 0.44 | -15.30 | 0.4068 | -0.1765 | |||
| CSL / Carlisle Companies Incorporated | 0.00 | 0.44 | 0.4029 | 0.4029 | |||||
| D / Dominion Energy, Inc. | 0.01 | -36.49 | 0.43 | -36.02 | 0.3927 | -0.3531 | |||
| TYIA / Johnson Controls International plc | 0.00 | -25.98 | 0.41 | -2.37 | 0.3779 | -0.0929 | |||
| BAX / Baxter International Inc. | 0.01 | -12.97 | 0.40 | -22.99 | 0.3689 | -0.2136 | |||
| VOYA / Voya Financial, Inc. | 0.01 | 20.27 | 0.40 | 26.11 | 0.3638 | 0.0128 | |||
| PR / Permian Resources Corporation | 0.03 | 0.39 | 0.3615 | 0.3615 | |||||
| CHWY / Chewy, Inc. | 0.01 | -45.00 | 0.38 | -27.87 | 0.3517 | -0.2413 | |||
| FANG / Diamondback Energy, Inc. | 0.00 | 26.17 | 0.38 | 8.26 | 0.3492 | -0.0423 | |||
| NEM / Newmont Corporation | 0.01 | -60.97 | 0.36 | -52.88 | 0.3301 | -0.5221 | |||
| DAL / Delta Air Lines, Inc. | 0.01 | -1.91 | 0.35 | 10.51 | 0.3189 | -0.0315 | |||
| HON / Honeywell International Inc. | 0.00 | 0.34 | 0.3115 | 0.3115 | |||||
| RRJ / RenaissanceRe Holdings Ltd. | 0.00 | -3.13 | 0.33 | -2.08 | 0.3033 | -0.0728 | |||
| BMY / Bristol-Myers Squibb Company | 0.01 | -58.61 | 0.32 | -68.59 | 0.2898 | -0.8319 | |||
| TEAM / Atlassian Corporation | 0.00 | 27.38 | 0.32 | 22.09 | 0.2893 | 0.0008 | |||
| RDDT / Reddit, Inc. | 0.00 | -44.84 | 0.31 | -20.72 | 0.2842 | -0.1522 | |||
| NTRA / Natera, Inc. | 0.00 | -1.56 | 0.31 | 17.49 | 0.2838 | -0.0096 | |||
| INSM / Insmed Incorporated | 0.00 | 0.30 | 0.2734 | 0.2734 | |||||
| MS / Morgan Stanley | 0.00 | -65.66 | 0.30 | -48.25 | 0.2713 | -0.3131 | |||
| ALGN / Align Technology, Inc. | 0.00 | -57.48 | 0.29 | -49.39 | 0.2673 | -0.3740 | |||
| OMC / Omnicom Group Inc. | 0.00 | -15.56 | 0.28 | -26.96 | 0.2566 | -0.1692 | |||
| BNTX / BioNTech SE - Depositary Receipt (Common Stock) | 0.00 | -1.55 | 0.27 | 15.38 | 0.2478 | -0.0139 | |||
| FRPT / Freshpet, Inc. | 0.00 | 19.66 | 0.26 | -2.27 | 0.2374 | -0.0578 | |||
| USB / U.S. Bancorp | 0.01 | 19.36 | 0.25 | 27.92 | 0.2312 | 0.0115 | |||
| GILD / Gilead Sciences, Inc. | 0.00 | -56.45 | 0.24 | -56.96 | 0.2160 | -0.3935 | |||
| GM / General Motors Company | 0.00 | -2.14 | 0.23 | 2.21 | 0.2123 | -0.0398 | |||
| MMM / 3M Company | 0.00 | -31.39 | 0.23 | -28.88 | 0.2105 | -0.1493 | |||
| HES / Hess Corporation | 0.00 | -27.75 | 0.22 | -37.43 | 0.2060 | -0.1937 | |||
| KVUE / Kenvue Inc. | 0.01 | -50.24 | 0.19 | -56.69 | 0.1758 | -0.3164 |