Statistik Asas
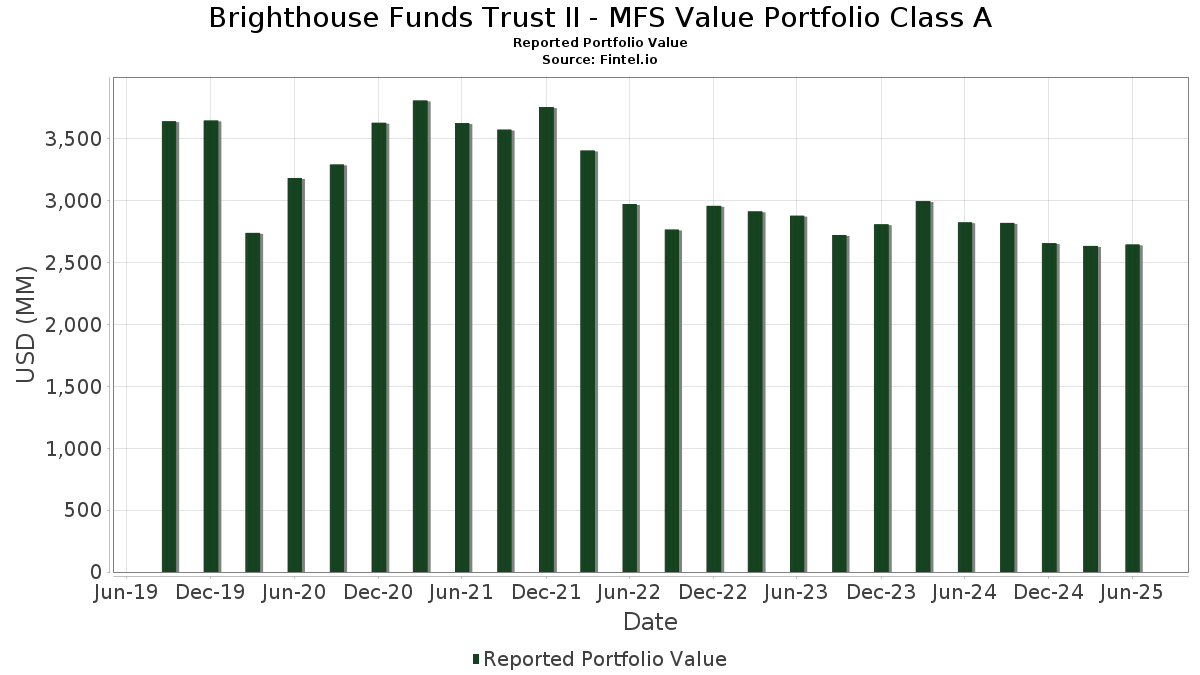
| Nilai Portfolio | $ 2,645,617,178 |
| Kedudukan Semasa | 79 |
Pegangan Terkini, Prestasi, AUM (dari 13F, 13D)
Brighthouse Funds Trust II - MFS Value Portfolio Class A telah mendedahkan 79 jumlah pegangan dalam pemfailan SEC terkini mereka. Nilai portfolio terkini dikira sebagai $ 2,645,617,178 USD. Aset Sebenar Di Bawah Pengurusan (AUM) ialah nilai ini ditambah dengan tunai (yang tidak didedahkan). Pegangan teratas Brighthouse Funds Trust II - MFS Value Portfolio Class A ialah JPMorgan Chase & Co. (US:JPM) , The Progressive Corporation (US:PGR) , The Cigna Group (US:CI) , McKesson Corporation (US:MCK) , and RTX Corporation (US:RTX) . Kedudukan baharu Brighthouse Funds Trust II - MFS Value Portfolio Class A termasuk Federal Home Loan Bank Discount Notes (US:US313385HP48) , LPL Financial Holdings Inc. (US:LPLA) , .
Kenaikan Teratas Suku Tahun Ini
Kami menggunakan perubahan dalam peruntukan portfolio kerana ini adalah metrik yang paling bermakna. Perubahan boleh disebabkan oleh perdagangan atau perubahan dalam harga saham.
| Sekuriti | Saham (MM) |
Nilai (MM$) |
Portfolio % | ΔPortfolio % |
|---|---|---|---|---|
| 31.02 | 1.1747 | 1.1747 | ||
| 0.42 | 33.87 | 1.2826 | 0.6165 | |
| 0.43 | 123.38 | 4.6727 | 0.5815 | |
| 0.36 | 48.48 | 1.8360 | 0.4166 | |
| 0.31 | 63.94 | 2.4214 | 0.3820 | |
| 0.02 | 9.28 | 0.3513 | 0.3513 | |
| 0.20 | 64.37 | 2.4377 | 0.3101 | |
| 0.04 | 36.05 | 1.3652 | 0.2931 | |
| 0.04 | 37.87 | 1.4344 | 0.2608 | |
| 0.16 | 34.74 | 1.3157 | 0.2518 |
Penurunan Teratas Suku Tahun Ini
Kami menggunakan perubahan dalam peruntukan portfolio kerana ini adalah metrik yang paling bermakna. Perubahan boleh disebabkan oleh perdagangan atau perubahan dalam harga saham.
| Sekuriti | Saham (MM) |
Nilai (MM$) |
Portfolio % | ΔPortfolio % |
|---|---|---|---|---|
| 0.35 | 8.75 | 0.3313 | -0.4787 | |
| 0.41 | 109.30 | 4.1396 | -0.4032 | |
| 0.52 | 46.58 | 1.7641 | -0.3721 | |
| 0.27 | 59.29 | 2.2454 | -0.3479 | |
| 2.00 | 27.83 | 1.0539 | -0.2901 | |
| 0.14 | 48.58 | 1.8399 | -0.2899 | |
| 0.15 | 10.37 | 0.3928 | -0.2868 | |
| 0.25 | 35.22 | 1.3338 | -0.2787 | |
| 0.46 | 49.88 | 1.8889 | -0.2675 | |
| 1.07 | 22.43 | 0.8494 | -0.2536 |
13F dan Pemfailan Dana
Borang ini telah difailkan pada 2025-08-27 untuk tempoh pelaporan 2025-06-30. Klik ikon pautan untuk melihat sejarah transaksi penuh.
Tingkatkan untuk membuka data premium dan eksport ke Excel ![]() .
.
| Sekuriti | Jenis | Purata Harga Saham | Saham (MM) |
ΔSaham (%) |
ΔSaham (%) |
Nilai ($MM) |
Portfolio (%) |
ΔPortfolio (%) |
|
|---|---|---|---|---|---|---|---|---|---|
| JPM / JPMorgan Chase & Co. | 0.43 | -3.17 | 123.38 | 14.44 | 4.6727 | 0.5815 | |||
| PGR / The Progressive Corporation | 0.41 | -3.17 | 109.30 | -8.70 | 4.1396 | -0.4032 | |||
| CI / The Cigna Group | 0.26 | -3.17 | 85.70 | -2.70 | 3.2455 | -0.0968 | |||
| MCK / McKesson Corporation | 0.11 | -12.45 | 80.42 | -4.67 | 3.0457 | -0.1554 | |||
| RTX / RTX Corporation | 0.47 | -3.17 | 69.20 | 6.74 | 2.6207 | 0.1607 | |||
| AXP / American Express Company | 0.20 | -3.17 | 64.37 | 14.80 | 2.4377 | 0.3101 | |||
| BA / The Boeing Company | 0.31 | -3.17 | 63.94 | 18.96 | 2.4214 | 0.3820 | |||
| MMC / Marsh & McLennan Companies, Inc. | 0.27 | -3.17 | 59.29 | -13.24 | 2.2454 | -0.3479 | |||
| MS / Morgan Stanley | 0.39 | -16.22 | 54.38 | 1.16 | 2.0594 | 0.0195 | |||
| DUK / Duke Energy Corporation | 0.45 | -3.17 | 52.91 | -6.32 | 2.0040 | -0.1394 | |||
| JNJ / Johnson & Johnson | 0.35 | -3.17 | 52.91 | -10.81 | 2.0038 | -0.2474 | |||
| ADI / Analog Devices, Inc. | 0.22 | -3.17 | 52.24 | 14.28 | 1.9783 | 0.2438 | |||
| GD / General Dynamics Corporation | 0.17 | -3.17 | 50.95 | 3.61 | 1.9294 | 0.0635 | |||
| NDAQ / Nasdaq, Inc. | 0.57 | -3.17 | 50.72 | 14.14 | 1.9209 | 0.2346 | |||
| XOM / Exxon Mobil Corporation | 0.46 | -3.17 | 49.88 | -12.23 | 1.8889 | -0.2675 | |||
| SO / The Southern Company | 0.53 | -3.17 | 48.90 | -3.30 | 1.8521 | -0.0669 | |||
| AON / Aon plc | 0.14 | -3.17 | 48.58 | -13.44 | 1.8399 | -0.2899 | |||
| KKR / KKR & Co. Inc. | 0.36 | 12.64 | 48.48 | 29.61 | 1.8360 | 0.4166 | |||
| TRV / The Travelers Companies, Inc. | 0.18 | -3.17 | 48.07 | -2.04 | 1.8205 | -0.0416 | |||
| COP / ConocoPhillips | 0.52 | -3.17 | 46.58 | -17.26 | 1.7641 | -0.3721 | |||
| D / Dominion Energy, Inc. | 0.82 | 2.52 | 46.33 | 3.34 | 1.7548 | 0.0534 | |||
| LOW / Lowe's Companies, Inc. | 0.21 | -3.17 | 46.16 | -7.89 | 1.7480 | -0.1534 | |||
| ACN / Accenture plc | 0.15 | 8.12 | 45.95 | 3.57 | 1.7403 | 0.0566 | |||
| CB / Chubb Limited | 0.16 | -3.17 | 45.33 | -7.11 | 1.7167 | -0.1349 | |||
| UNP / Union Pacific Corporation | 0.19 | -3.17 | 44.81 | -5.69 | 1.6972 | -0.1060 | |||
| C / Citigroup Inc. | 0.53 | -3.17 | 44.75 | 16.10 | 1.6948 | 0.2322 | |||
| PNC / The PNC Financial Services Group, Inc. | 0.24 | -3.17 | 44.37 | 2.70 | 1.6805 | 0.0409 | |||
| HON / Honeywell International Inc. | 0.19 | -3.17 | 44.04 | 6.49 | 1.6678 | 0.0986 | |||
| PLD / Prologis, Inc. | 0.40 | 8.48 | 41.71 | 2.01 | 1.5798 | 0.0280 | |||
| TXN / Texas Instruments Incorporated | 0.19 | -3.17 | 40.47 | 11.87 | 1.5327 | 0.1600 | |||
| ABT / Abbott Laboratories | 0.29 | -3.17 | 39.55 | -0.72 | 1.4980 | -0.0138 | |||
| ABBV / AbbVie Inc. | 0.21 | -3.17 | 39.42 | -14.22 | 1.4928 | -0.2508 | |||
| BLK / BlackRock, Inc. | 0.04 | 10.47 | 37.87 | 22.46 | 1.4344 | 0.2608 | |||
| KLAC / KLA Corporation | 0.04 | -3.17 | 36.05 | 27.59 | 1.3652 | 0.2931 | |||
| CVX / Chevron Corporation | 0.25 | -3.17 | 35.22 | -17.12 | 1.3338 | -0.2787 | |||
| MAR / Marriott International, Inc. | 0.13 | -3.17 | 34.81 | 11.06 | 1.3184 | 0.1290 | |||
| NXPI / NXP Semiconductors N.V. | 0.16 | 7.79 | 34.74 | 23.91 | 1.3157 | 0.2518 | |||
| PFE / Pfizer Inc. | 1.41 | -3.17 | 34.16 | -7.37 | 1.2937 | -0.1057 | |||
| WFC / Wells Fargo & Company | 0.42 | 72.87 | 33.87 | 92.94 | 1.2826 | 0.6165 | |||
| US313385HP48 / Federal Home Loan Bank Discount Notes | 31.02 | 1.1747 | 1.1747 | ||||||
| ELV / Elevance Health, Inc. | 0.08 | -3.17 | 30.61 | -13.41 | 1.1591 | -0.1822 | |||
| XEL / Xcel Energy Inc. | 0.45 | 24.22 | 30.48 | 19.50 | 1.1545 | 0.1865 | |||
| NOC / Northrop Grumman Corporation | 0.06 | -3.17 | 30.48 | -5.44 | 1.1545 | -0.0689 | |||
| NESN / Nestlé S.A. | 0.30 | -14.75 | 30.04 | -16.28 | 1.1375 | -0.2238 | |||
| ETN / Eaton Corporation plc | 0.08 | -3.17 | 29.74 | 27.17 | 1.1265 | 0.2389 | |||
| MDLZ / Mondelez International, Inc. | 0.44 | -3.17 | 29.57 | -3.76 | 1.1200 | -0.0460 | |||
| PCAR / PACCAR Inc | 0.31 | -3.17 | 29.09 | -5.47 | 1.1016 | -0.0660 | |||
| ITW / Illinois Tool Works Inc. | 0.11 | 13.14 | 27.88 | 12.79 | 1.0558 | 0.1179 | |||
| PCG / PG&E Corporation | 2.00 | -3.17 | 27.83 | -21.43 | 1.0539 | -0.2901 | |||
| PEP / PepsiCo, Inc. | 0.21 | -3.17 | 27.15 | -14.73 | 1.0283 | -0.1800 | |||
| EFX / Equifax Inc. | 0.10 | -3.17 | 26.62 | 3.11 | 1.0081 | 0.0285 | |||
| KVUE / Kenvue Inc. | 1.07 | -11.59 | 22.43 | -22.84 | 0.8494 | -0.2536 | |||
| EOG / EOG Resources, Inc. | 0.16 | -3.17 | 19.59 | -9.69 | 0.7418 | -0.0812 | |||
| EXC / Exelon Corporation | 0.45 | -3.17 | 19.54 | -8.76 | 0.7399 | -0.0726 | |||
| MRK / Merck & Co., Inc. | 0.24 | -3.17 | 19.31 | -14.61 | 0.7313 | -0.1268 | |||
| KMB / Kimberly-Clark Corporation | 0.13 | -3.17 | 16.82 | -12.23 | 0.6370 | -0.0902 | |||
| RKT / Reckitt Benckiser Group plc | 0.24 | -3.17 | 16.01 | -2.52 | 0.6064 | -0.0169 | |||
| TGT / Target Corporation | 0.16 | -17.66 | 15.99 | -22.17 | 0.6056 | -0.1740 | |||
| CRH / CRH plc | 0.17 | 41.62 | 15.78 | 47.80 | 0.5975 | 0.1924 | |||
| AEP / American Electric Power Company, Inc. | 0.11 | -3.17 | 11.59 | -8.06 | 0.4388 | -0.0394 | |||
| SHW / The Sherwin-Williams Company | 0.03 | -3.17 | 11.12 | -4.79 | 0.4212 | -0.0220 | |||
| CNI / Canadian National Railway Company | 0.11 | -3.17 | 10.97 | 3.36 | 0.4154 | 0.0127 | |||
| DD / DuPont de Nemours, Inc. | 0.15 | -36.95 | 10.37 | -42.09 | 0.3928 | -0.2868 | |||
| GWW / W.W. Grainger, Inc. | 0.01 | -3.18 | 10.12 | 1.97 | 0.3831 | 0.0066 | |||
| LPLA / LPL Financial Holdings Inc. | 0.02 | 9.28 | 0.3513 | 0.3513 | |||||
| CTVA / Corteva, Inc. | 0.12 | -48.97 | 9.20 | -39.57 | 0.3482 | -0.2292 | |||
| DGE / Diageo plc | 0.35 | -57.50 | 8.75 | -59.02 | 0.3313 | -0.4787 | |||
| TT / Trane Technologies plc | 0.02 | -3.17 | 8.43 | 25.72 | 0.3192 | 0.0648 | |||
| OTIS / Otis Worldwide Corporation | 0.08 | -3.17 | 8.16 | -7.09 | 0.3091 | -0.0242 | |||
| PSA / Public Storage | 0.03 | -3.17 | 8.00 | -5.07 | 0.3028 | -0.0168 | |||
| CDW / CDW Corporation | 0.04 | 38.16 | 7.15 | 53.96 | 0.2707 | 0.0945 | |||
| National Bank Financial Inc / RA (000000000) | 1.10 | 0.0417 | 0.0417 | ||||||
| TD Prime Services LLC / RA (000000000) | 1.10 | 0.0417 | 0.0417 | ||||||
| US83370G5999 / Societe Generale SA, ELN, (linked to Nasdaq 100 Index) | 1.10 | 0.0417 | 0.0417 | ||||||
| BNSB34 / The Bank of Nova Scotia - Depositary Receipt (Common Stock) | 1.10 | 0.0417 | 0.0417 | ||||||
| ING Financial Markets LLC / RA (000000000) | 1.00 | 0.0379 | 0.0379 | ||||||
| Barclays Capital Inc / RA (000000000) | 1.00 | 0.0379 | 0.0379 | ||||||
| ING Financial Markets LLC / RA (000000000) | 0.30 | 0.0114 | 0.0114 | ||||||
| FIXED INC CLEARING CORP.REPO / RA (000000000) | 0.02 | 0.0007 | 0.0007 |