Statistik Asas
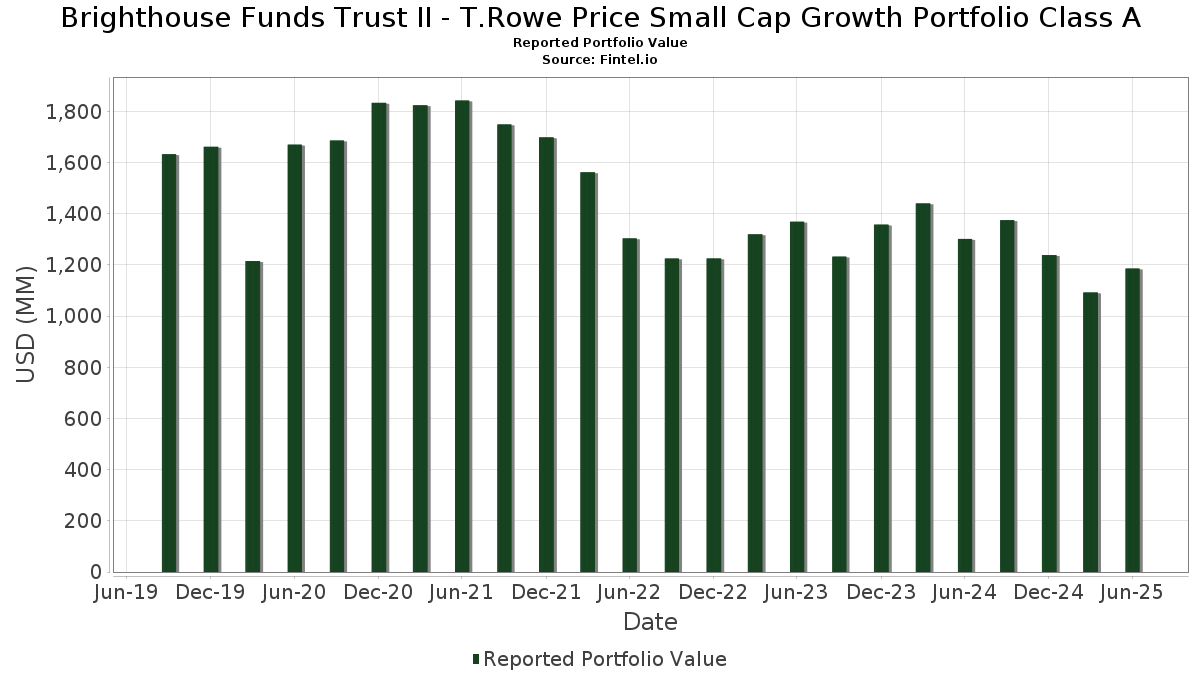
| Nilai Portfolio | $ 1,185,788,950 |
| Kedudukan Semasa | 356 |
Pegangan Terkini, Prestasi, AUM (dari 13F, 13D)
Brighthouse Funds Trust II - T.Rowe Price Small Cap Growth Portfolio Class A telah mendedahkan 356 jumlah pegangan dalam pemfailan SEC terkini mereka. Nilai portfolio terkini dikira sebagai $ 1,185,788,950 USD. Aset Sebenar Di Bawah Pengurusan (AUM) ialah nilai ini ditambah dengan tunai (yang tidak didedahkan). Pegangan teratas Brighthouse Funds Trust II - T.Rowe Price Small Cap Growth Portfolio Class A ialah Rambus Inc. (US:RMBS) , Fabrinet (US:FN) , Carpenter Technology Corporation (US:CRS) , Planet Fitness, Inc. (US:PLNT) , and APi Group Corporation (US:APG) . Kedudukan baharu Brighthouse Funds Trust II - T.Rowe Price Small Cap Growth Portfolio Class A termasuk Waystar Holding Corp. (US:WAY) , American Healthcare REIT, Inc. (US:AHR) , Marqeta, Inc. (US:MQ) , Itron, Inc. (US:ITRI) , and Liberty Live Group (US:LLYVK) .
Kenaikan Teratas Suku Tahun Ini
Kami menggunakan perubahan dalam peruntukan portfolio kerana ini adalah metrik yang paling bermakna. Perubahan boleh disebabkan oleh perdagangan atau perubahan dalam harga saham.
| Sekuriti | Saham (MM) |
Nilai (MM$) |
Portfolio % | ΔPortfolio % |
|---|---|---|---|---|
| 15.00 | 1.3737 | 1.3737 | ||
| 12.00 | 1.0989 | 1.0989 | ||
| 10.00 | 0.9158 | 0.9158 | ||
| 9.10 | 0.8334 | 0.8334 | ||
| 5.00 | 0.4579 | 0.4579 | ||
| 0.10 | 4.49 | 0.4112 | 0.4112 | |
| 0.11 | 9.55 | 0.8749 | 0.4064 | |
| 0.03 | 6.92 | 0.6339 | 0.3767 | |
| 0.10 | 4.04 | 0.3695 | 0.3695 | |
| 0.04 | 5.55 | 0.5079 | 0.3687 |
Penurunan Teratas Suku Tahun Ini
Kami menggunakan perubahan dalam peruntukan portfolio kerana ini adalah metrik yang paling bermakna. Perubahan boleh disebabkan oleh perdagangan atau perubahan dalam harga saham.
| Sekuriti | Saham (MM) |
Nilai (MM$) |
Portfolio % | ΔPortfolio % |
|---|---|---|---|---|
| 0.01 | 2.68 | 0.2459 | -0.6465 | |
| 0.01 | 0.71 | 0.0654 | -0.5329 | |
| 0.02 | 1.69 | 0.1544 | -0.5026 | |
| 0.04 | 4.23 | 0.3875 | -0.5019 | |
| 0.06 | 1.88 | 0.1723 | -0.4724 | |
| 0.05 | 6.62 | 0.6063 | -0.4606 | |
| 0.03 | 3.98 | 0.3641 | -0.4375 | |
| 0.04 | 4.29 | 0.3931 | -0.4263 | |
| 0.02 | 5.08 | 0.4656 | -0.3726 | |
| 0.01 | 1.40 | 0.1286 | -0.3227 |
13F dan Pemfailan Dana
Borang ini telah difailkan pada 2025-08-27 untuk tempoh pelaporan 2025-06-30. Klik ikon pautan untuk melihat sejarah transaksi penuh.
Tingkatkan untuk membuka data premium dan eksport ke Excel ![]() .
.
| Sekuriti | Jenis | Purata Harga Saham | Saham (MM) |
ΔSaham (%) |
ΔSaham (%) |
Nilai ($MM) |
Portfolio (%) |
ΔPortfolio (%) |
|
|---|---|---|---|---|---|---|---|---|---|
| US63306A4114 / National Bank of Canada into Bristol-Myers Squibb Co. | 15.00 | 1.3737 | 1.3737 | ||||||
| RMBS / Rambus Inc. | 0.20 | 5.68 | 12.53 | 30.67 | 1.1470 | 0.2001 | |||
| BNSB34 / The Bank of Nova Scotia - Depositary Receipt (Common Stock) | 12.00 | 1.0989 | 1.0989 | ||||||
| FN / Fabrinet | 0.04 | 2.53 | 11.55 | 52.97 | 1.0576 | 0.3118 | |||
| CRS / Carpenter Technology Corporation | 0.04 | 7.70 | 10.94 | 64.29 | 1.0014 | 0.3439 | |||
| PLNT / Planet Fitness, Inc. | 0.09 | 2.85 | 10.25 | 16.09 | 0.9388 | 0.0665 | |||
| US83370G5999 / Societe Generale SA, ELN, (linked to Nasdaq 100 Index) | 10.00 | 0.9158 | 0.9158 | ||||||
| APG / APi Group Corporation | 0.19 | -5.26 | 9.66 | 35.25 | 0.8849 | 0.1791 | |||
| WING / Wingstop Inc. | 0.03 | -1.04 | 9.66 | 47.73 | 0.8844 | 0.2386 | |||
| ATI / ATI Inc. | 0.11 | 21.41 | 9.55 | 101.50 | 0.8749 | 0.4064 | |||
| IDCC / InterDigital, Inc. | 0.04 | 21.84 | 9.25 | 32.15 | 0.8474 | 0.1556 | |||
| TD Prime Services LLC / RA (000000000) | 9.10 | 0.8334 | 0.8334 | ||||||
| AIT / Applied Industrial Technologies, Inc. | 0.04 | 29.43 | 8.82 | 33.51 | 0.8081 | 0.1552 | |||
| ENSG / The Ensign Group, Inc. | 0.06 | 0.00 | 8.75 | 19.21 | 0.8014 | 0.0762 | |||
| SPXC / SPX Technologies, Inc. | 0.05 | 3.58 | 8.72 | 34.86 | 0.7989 | 0.1599 | |||
| BDC / Belden Inc. | 0.07 | 0.00 | 8.34 | 15.50 | 0.7642 | 0.0505 | |||
| CVLT / Commvault Systems, Inc. | 0.05 | 2.44 | 8.21 | 13.21 | 0.7519 | 0.0354 | |||
| WTS / Watts Water Technologies, Inc. | 0.03 | 2.46 | 8.08 | 23.56 | 0.7403 | 0.0939 | |||
| FTI / TechnipFMC plc | 0.23 | 4.50 | 7.90 | 13.56 | 0.7231 | 0.0363 | |||
| VRRM / Verra Mobility Corporation | 0.31 | 16.14 | 7.84 | 30.99 | 0.7180 | 0.1267 | |||
| FSS / Federal Signal Corporation | 0.07 | 3.88 | 7.82 | 50.32 | 0.7163 | 0.2022 | |||
| TDY / Teledyne Technologies Incorporated | 0.02 | -4.90 | 7.81 | -2.11 | 0.7154 | -0.0730 | |||
| LNW / Light & Wonder, Inc. | 0.08 | 3.64 | 7.77 | 15.17 | 0.7118 | 0.0452 | |||
| MTSI / MACOM Technology Solutions Holdings, Inc. | 0.05 | -4.19 | 7.74 | 36.76 | 0.7084 | 0.1497 | |||
| VMI / Valmont Industries, Inc. | 0.02 | 53.07 | 7.54 | 75.19 | 0.6905 | 0.2653 | |||
| EXLS / ExlService Holdings, Inc. | 0.17 | 2.04 | 7.51 | -5.36 | 0.6875 | -0.0961 | |||
| LRN / Stride, Inc. | 0.05 | -16.46 | 7.50 | -4.12 | 0.6869 | -0.0859 | |||
| THC / Tenet Healthcare Corporation | 0.04 | -18.97 | 7.45 | 6.04 | 0.6819 | -0.0118 | |||
| MMSI / Merit Medical Systems, Inc. | 0.08 | 3.68 | 7.15 | -8.31 | 0.6544 | -0.1156 | |||
| SNEX / StoneX Group Inc. | 0.08 | 3.38 | 6.95 | 23.34 | 0.6363 | 0.0799 | |||
| VNOM / Viper Energy, Inc. | 0.18 | 0.00 | 6.94 | -15.55 | 0.6357 | -0.1763 | |||
| STRL / Sterling Infrastructure, Inc. | 0.03 | 30.43 | 6.92 | 165.89 | 0.6339 | 0.3767 | |||
| QTWO / Q2 Holdings, Inc. | 0.07 | 0.00 | 6.67 | 16.97 | 0.6109 | 0.0475 | |||
| EHC / Encompass Health Corporation | 0.05 | -49.37 | 6.62 | -38.70 | 0.6063 | -0.4606 | |||
| PAYO / Payoneer Global Inc. | 0.94 | 23.47 | 6.43 | 15.71 | 0.5888 | 0.0398 | |||
| DSGX / The Descartes Systems Group Inc. | 0.06 | 0.00 | 6.41 | 0.82 | 0.5868 | -0.0411 | |||
| LOPE / Grand Canyon Education, Inc. | 0.03 | 17.72 | 6.33 | 28.59 | 0.5795 | 0.0934 | |||
| ESAB / ESAB Corporation | 0.05 | -13.82 | 6.32 | -10.83 | 0.5791 | -0.1214 | |||
| HQY / HealthEquity, Inc. | 0.06 | 0.00 | 6.31 | 18.55 | 0.5778 | 0.0520 | |||
| CCCS / CCC Intelligent Solutions Holdings Inc. | 0.66 | 26.84 | 6.17 | 32.19 | 0.5652 | 0.1039 | |||
| SSD / Simpson Manufacturing Co., Inc. | 0.04 | 4.43 | 6.12 | 3.24 | 0.5604 | -0.0251 | |||
| LNTH / Lantheus Holdings, Inc. | 0.07 | 2.39 | 6.11 | -14.13 | 0.5598 | -0.1434 | |||
| FBP / First BanCorp. | 0.29 | 23.34 | 6.04 | 34.02 | 0.5531 | 0.1079 | |||
| GMED / Globus Medical, Inc. | 0.10 | 3.51 | 6.03 | -16.54 | 0.5526 | -0.1617 | |||
| KAI / Kadant Inc. | 0.02 | 0.00 | 6.03 | -5.77 | 0.5519 | -0.0799 | |||
| ATMU / Atmus Filtration Technologies Inc. | 0.16 | 3.23 | 5.98 | 2.36 | 0.5473 | -0.0295 | |||
| UPWK / Upwork Inc. | 0.44 | 7.45 | 5.95 | 10.67 | 0.5444 | 0.0137 | |||
| SKWD / Skyward Specialty Insurance Group, Inc. | 0.10 | 4.35 | 5.94 | 13.96 | 0.5443 | 0.0291 | |||
| POST / Post Holdings, Inc. | 0.05 | 2.61 | 5.93 | -3.86 | 0.5434 | -0.0663 | |||
| CRDO / Credo Technology Group Holding Ltd | 0.06 | 0.00 | 5.93 | 130.61 | 0.5430 | 0.2889 | |||
| EXEL / Exelixis, Inc. | 0.13 | -11.46 | 5.92 | 5.69 | 0.5426 | -0.0112 | |||
| IRDM / Iridium Communications Inc. | 0.20 | 0.00 | 5.89 | 10.43 | 0.5391 | 0.0125 | |||
| CRVL / CorVel Corporation | 0.06 | -8.44 | 5.69 | -15.96 | 0.5207 | -0.1476 | |||
| PTC / PTC Inc. | 0.03 | 5.08 | 5.59 | 16.87 | 0.5122 | 0.0394 | |||
| ATGE / Adtalem Global Education Inc. | 0.04 | 211.38 | 5.55 | 293.89 | 0.5079 | 0.3687 | |||
| EQH / Equitable Holdings, Inc. | 0.10 | -9.46 | 5.48 | -2.49 | 0.5017 | -0.0533 | |||
| CSW / CSW Industrials, Inc. | 0.02 | 0.00 | 5.36 | -1.60 | 0.4906 | -0.0473 | |||
| OPCH / Option Care Health, Inc. | 0.16 | -11.29 | 5.29 | -17.55 | 0.4840 | -0.1493 | |||
| VNT / Vontier Corporation | 0.14 | -9.00 | 5.26 | 2.23 | 0.4819 | -0.0266 | |||
| PLMR / Palomar Holdings, Inc. | 0.03 | -16.63 | 5.26 | -6.17 | 0.4815 | -0.0722 | |||
| NOVT / Novanta Inc. | 0.04 | 0.00 | 5.22 | 0.81 | 0.4778 | -0.0334 | |||
| APPF / AppFolio, Inc. | 0.02 | 141.11 | 5.13 | 135.92 | 0.4697 | 0.2924 | |||
| HALO / Halozyme Therapeutics, Inc. | 0.10 | -11.65 | 5.11 | -27.98 | 0.4684 | -0.2331 | |||
| WWD / Woodward, Inc. | 0.02 | -55.38 | 5.08 | -40.08 | 0.4656 | -0.3726 | |||
| EXP / Eagle Materials Inc. | 0.03 | 3.43 | 5.08 | -5.81 | 0.4650 | -0.0675 | |||
| SITE / SiteOne Landscape Supply, Inc. | 0.04 | 0.00 | 5.01 | -0.40 | 0.4591 | -0.0382 | |||
| CF Secured LLC / RA (000000000) | 5.00 | 0.4579 | 0.4579 | ||||||
| CWAN / Clearwater Analytics Holdings, Inc. | 0.23 | 530.41 | 4.96 | 416.25 | 0.4539 | 0.3590 | |||
| AZEK / The AZEK Company Inc. | 0.09 | -42.68 | 4.89 | -36.28 | 0.4479 | -0.3103 | |||
| CR / Crane Company | 0.03 | -5.16 | 4.89 | 17.58 | 0.4477 | 0.0369 | |||
| AXTA / Axalta Coating Systems Ltd. | 0.16 | 0.00 | 4.87 | -10.50 | 0.4460 | -0.0915 | |||
| FTDR / Frontdoor, Inc. | 0.08 | 5.88 | 4.84 | 62.47 | 0.4428 | 0.1487 | |||
| LSCC / Lattice Semiconductor Corporation | 0.10 | 44.82 | 4.80 | 35.29 | 0.4400 | 0.0891 | |||
| PEN / Penumbra, Inc. | 0.02 | 0.00 | 4.80 | -4.04 | 0.4394 | -0.0545 | |||
| TBBK / The Bancorp, Inc. | 0.08 | 0.00 | 4.77 | 7.80 | 0.4365 | -0.0002 | |||
| G / Genpact Limited | 0.11 | 71.58 | 4.70 | 49.89 | 0.4304 | 0.1206 | |||
| TREX / Trex Company, Inc. | 0.09 | 13.39 | 4.70 | 6.12 | 0.4301 | -0.0071 | |||
| CASY / Casey's General Stores, Inc. | 0.01 | -16.45 | 4.66 | -1.79 | 0.4271 | -0.0420 | |||
| NXST / Nexstar Media Group, Inc. | 0.03 | 0.00 | 4.66 | -3.48 | 0.4265 | -0.0503 | |||
| US76105Y1091 / T. Rowe Price Government Reserve Fund | 4.66 | -3.87 | 4.66 | -3.86 | 0.4264 | -0.0521 | |||
| HRB / H&R Block, Inc. | 0.08 | 3.16 | 4.65 | 3.10 | 0.4260 | -0.0196 | |||
| ONTO / Onto Innovation Inc. | 0.05 | 3.39 | 4.64 | -14.01 | 0.4249 | -0.1081 | |||
| AGYS / Agilysys, Inc. | 0.04 | 0.00 | 4.55 | 58.03 | 0.4162 | 0.1321 | |||
| BYD / Boyd Gaming Corporation | 0.06 | 0.00 | 4.52 | 18.84 | 0.4136 | 0.0382 | |||
| BILL / BILL Holdings, Inc. | 0.10 | 4.49 | 0.4112 | 0.4112 | |||||
| FICO / Fair Isaac Corporation | 0.00 | -4.30 | 4.48 | -5.15 | 0.4100 | -0.0562 | |||
| MLI / Mueller Industries, Inc. | 0.06 | 168.78 | 4.46 | 180.58 | 0.4088 | 0.2516 | |||
| NTRA / Natera, Inc. | 0.03 | 0.00 | 4.46 | 19.47 | 0.4086 | 0.0397 | |||
| RBC / RBC Bearings Incorporated | 0.01 | 0.00 | 4.45 | 19.58 | 0.4072 | 0.0399 | |||
| ANF / Abercrombie & Fitch Co. | 0.05 | 0.00 | 4.40 | 8.49 | 0.4025 | 0.0023 | |||
| NTNX / Nutanix, Inc. | 0.06 | 40.53 | 4.39 | 53.91 | 0.4018 | 0.1201 | |||
| TXRH / Texas Roadhouse, Inc. | 0.02 | 0.00 | 4.38 | 12.46 | 0.4011 | 0.0164 | |||
| BMI / Badger Meter, Inc. | 0.02 | 0.00 | 4.38 | 28.75 | 0.4007 | 0.0650 | |||
| CVCO / Cavco Industries, Inc. | 0.01 | 0.00 | 4.33 | -16.39 | 0.3962 | -0.1150 | |||
| ACIW / ACI Worldwide, Inc. | 0.09 | 11.00 | 4.31 | -6.85 | 0.3946 | -0.0624 | |||
| RPM / RPM International Inc. | 0.04 | -13.88 | 4.29 | -18.24 | 0.3933 | -0.1255 | |||
| INSM / Insmed Incorporated | 0.04 | -60.77 | 4.29 | -48.25 | 0.3931 | -0.4263 | |||
| MOD / Modine Manufacturing Company | 0.04 | 81.54 | 4.26 | 133.02 | 0.3897 | 0.2093 | |||
| PCTY / Paylocity Holding Corporation | 0.02 | -21.71 | 4.25 | -24.28 | 0.3890 | -0.1652 | |||
| EME / EMCOR Group, Inc. | 0.01 | 0.00 | 4.25 | 44.73 | 0.3888 | 0.0990 | |||
| COKE / Coca-Cola Consolidated, Inc. | 0.04 | 468.23 | 4.23 | -53.02 | 0.3875 | -0.5019 | |||
| MPWR / Monolithic Power Systems, Inc. | 0.01 | -3.78 | 4.22 | 21.33 | 0.3866 | 0.0429 | |||
| BCO / The Brink's Company | 0.05 | 0.00 | 4.18 | 3.62 | 0.3830 | -0.0157 | |||
| MAT / Mattel, Inc. | 0.21 | 0.00 | 4.16 | 1.49 | 0.3813 | -0.0240 | |||
| UFPT / UFP Technologies, Inc. | 0.02 | 0.00 | 4.15 | 21.02 | 0.3802 | 0.0414 | |||
| 8AK / Alkermes plc | 0.15 | 5.73 | 4.15 | -8.39 | 0.3800 | -0.0675 | |||
| MANH / Manhattan Associates, Inc. | 0.02 | 0.00 | 4.06 | 14.11 | 0.3718 | 0.0203 | |||
| RRC / Range Resources Corporation | 0.10 | 0.00 | 4.04 | 1.84 | 0.3702 | -0.0219 | |||
| WAY / Waystar Holding Corp. | 0.10 | 4.04 | 0.3695 | 0.3695 | |||||
| IONQ / IonQ, Inc. | 0.09 | 120.42 | 4.02 | 329.41 | 0.3678 | 0.2753 | |||
| RKLB / Rocket Lab Corporation | 0.11 | 108.90 | 4.01 | 318.06 | 0.3668 | 0.2721 | |||
| Citigroup Global Markets Inc / RA (000000000) | 4.00 | 0.3663 | 0.3663 | ||||||
| COOP / Mr. Cooper Group Inc. | 0.03 | -60.73 | 3.98 | -51.01 | 0.3641 | -0.4375 | |||
| SAIA / Saia, Inc. | 0.01 | 0.00 | 3.97 | -21.58 | 0.3638 | -0.1367 | |||
| LAUR / Laureate Education, Inc. | 0.17 | 5.68 | 3.94 | 20.83 | 0.3608 | 0.0387 | |||
| CRUS / Cirrus Logic, Inc. | 0.04 | 0.00 | 3.90 | 4.64 | 0.3573 | -0.0111 | |||
| PR / Permian Resources Corporation | 0.29 | 23.79 | 3.89 | 21.75 | 0.3563 | 0.0406 | |||
| KRMN / Karman Holdings Inc. | 0.08 | 0.00 | 3.83 | 50.69 | 0.3505 | 0.0996 | |||
| PBH / Prestige Consumer Healthcare Inc. | 0.05 | 20.28 | 3.77 | 11.69 | 0.3456 | 0.0119 | |||
| BBIO / BridgeBio Pharma, Inc. | 0.09 | -24.76 | 3.75 | -6.01 | 0.3437 | -0.0508 | |||
| GPI / Group 1 Automotive, Inc. | 0.01 | 0.00 | 3.74 | 14.35 | 0.3424 | 0.0194 | |||
| ADMA / ADMA Biologics, Inc. | 0.20 | 0.00 | 3.68 | -8.22 | 0.3374 | -0.0591 | |||
| PRIM / Primoris Services Corporation | 0.05 | 171.53 | 3.68 | 268.94 | 0.3372 | 0.2385 | |||
| ACLS / Axcelis Technologies, Inc. | 0.05 | 0.00 | 3.67 | 40.30 | 0.3364 | 0.0778 | |||
| BR / Broadridge Financial Solutions, Inc. | 0.02 | 5.16 | 3.67 | 5.42 | 0.3364 | -0.0079 | |||
| KNF / Knife River Corporation | 0.04 | 0.00 | 3.63 | -9.48 | 0.3322 | -0.0638 | |||
| DT / Dynatrace, Inc. | 0.07 | 0.00 | 3.62 | 17.09 | 0.3314 | 0.0261 | |||
| CW / Curtiss-Wright Corporation | 0.01 | -48.52 | 3.62 | -20.74 | 0.3312 | -0.1195 | |||
| AAON / AAON, Inc. | 0.05 | 0.00 | 3.59 | -5.60 | 0.3289 | -0.0470 | |||
| BCPC / Balchem Corporation | 0.02 | 0.00 | 3.54 | -4.09 | 0.3245 | -0.0405 | |||
| GRBK / Green Brick Partners, Inc. | 0.06 | 0.00 | 3.52 | 7.83 | 0.3227 | -0.0001 | |||
| FCN / FTI Consulting, Inc. | 0.02 | 0.00 | 3.52 | -1.57 | 0.3220 | -0.0309 | |||
| CNX / CNX Resources Corporation | 0.10 | 0.00 | 3.52 | 6.97 | 0.3220 | -0.0027 | |||
| PRI / Primerica, Inc. | 0.01 | 0.00 | 3.49 | -3.80 | 0.3197 | -0.0389 | |||
| DFIN / Donnelley Financial Solutions, Inc. | 0.06 | 0.00 | 3.49 | 41.08 | 0.3196 | 0.0751 | |||
| GXO / GXO Logistics, Inc. | 0.07 | 0.00 | 3.46 | 24.60 | 0.3173 | 0.0426 | |||
| DECK / Deckers Outdoor Corporation | 0.03 | 27.99 | 3.46 | 18.00 | 0.3170 | 0.0272 | |||
| KEX / Kirby Corporation | 0.03 | 0.00 | 3.42 | 12.31 | 0.3134 | 0.0123 | |||
| IBP / Installed Building Products, Inc. | 0.02 | 0.00 | 3.39 | 5.14 | 0.3109 | -0.0080 | |||
| NUVL / Nuvalent, Inc. | 0.04 | 68.63 | 3.37 | 81.50 | 0.3090 | 0.1253 | |||
| AHR / American Healthcare REIT, Inc. | 0.09 | 3.35 | 0.3069 | 0.3069 | |||||
| EXAS / Exact Sciences Corporation | 0.06 | 0.00 | 3.34 | 22.79 | 0.3054 | 0.0370 | |||
| BAH / Booz Allen Hamilton Holding Corporation | 0.03 | 0.00 | 3.31 | -0.42 | 0.3027 | -0.0252 | |||
| KYMR / Kymera Therapeutics, Inc. | 0.08 | 0.00 | 3.30 | 59.52 | 0.3024 | 0.0978 | |||
| EAT / Brinker International, Inc. | 0.02 | 0.00 | 3.30 | 21.01 | 0.3018 | 0.0327 | |||
| CBT / Cabot Corporation | 0.04 | 0.00 | 3.26 | -9.78 | 0.2984 | -0.0584 | |||
| RHP / Ryman Hospitality Properties, Inc. | 0.03 | 3.23 | 0.2959 | 0.2959 | |||||
| IONS / Ionis Pharmaceuticals, Inc. | 0.08 | 0.00 | 3.19 | 30.98 | 0.2924 | 0.0515 | |||
| DY / Dycom Industries, Inc. | 0.01 | 0.00 | 3.18 | 60.41 | 0.2914 | 0.0954 | |||
| LEU / Centrus Energy Corp. | 0.02 | -19.95 | 3.16 | 135.82 | 0.2894 | 0.1570 | |||
| RARE / Ultragenyx Pharmaceutical Inc. | 0.09 | 0.00 | 3.16 | 0.41 | 0.2894 | -0.0215 | |||
| RGEN / Repligen Corporation | 0.02 | 0.00 | 3.10 | -2.27 | 0.2841 | -0.0294 | |||
| VC / Visteon Corporation | 0.03 | 0.00 | 3.10 | 20.19 | 0.2840 | 0.0291 | |||
| US76105Y1091 / T. Rowe Price Government Reserve Fund | 3.07 | -33.97 | 3.07 | -33.98 | 0.2816 | -0.1448 | |||
| SFM / Sprouts Farmers Market, Inc. | 0.02 | 0.00 | 3.06 | 7.86 | 0.2803 | -0.0000 | |||
| ENTG / Entegris, Inc. | 0.04 | 51.96 | 3.04 | 40.12 | 0.2786 | 0.0641 | |||
| BOX / Box, Inc. | 0.09 | 5.93 | 3.04 | 17.31 | 0.2781 | 0.0223 | |||
| AKRO / Akero Therapeutics, Inc. | 0.06 | 0.00 | 3.00 | 31.83 | 0.2751 | 0.0500 | |||
| National Bank Financial Inc / RA (000000000) | 3.00 | 0.2747 | 0.2747 | ||||||
| CRNX / Crinetics Pharmaceuticals, Inc. | 0.10 | 19.70 | 2.99 | 2.65 | 0.2737 | -0.0140 | |||
| WFRD / Weatherford International plc | 0.06 | 0.00 | 2.99 | -6.07 | 0.2736 | -0.0406 | |||
| DORM / Dorman Products, Inc. | 0.02 | 2.98 | 0.2734 | 0.2734 | |||||
| RNA / Avidity Biosciences, Inc. | 0.10 | 0.00 | 2.98 | -3.78 | 0.2726 | -0.0331 | |||
| SRRK / Scholar Rock Holding Corporation | 0.08 | 0.00 | 2.97 | 10.20 | 0.2722 | 0.0057 | |||
| CBZ / CBIZ, Inc. | 0.04 | -27.26 | 2.97 | -31.23 | 0.2717 | -0.1545 | |||
| MTDR / Matador Resources Company | 0.06 | 0.00 | 2.96 | -6.60 | 0.2709 | -0.0420 | |||
| DV / DoubleVerify Holdings, Inc. | 0.20 | 0.00 | 2.95 | 11.98 | 0.2706 | 0.0099 | |||
| CYBR / CyberArk Software Ltd. | 0.01 | 41.18 | 2.93 | 69.99 | 0.2683 | 0.0980 | |||
| EXE / Expand Energy Corporation | 0.02 | 0.00 | 2.89 | 5.05 | 0.2647 | -0.0071 | |||
| MOH / Molina Healthcare, Inc. | 0.01 | 0.00 | 2.88 | -9.57 | 0.2640 | -0.0509 | |||
| HXL / Hexcel Corporation | 0.05 | 0.00 | 2.87 | 3.17 | 0.2626 | -0.0120 | |||
| SLNO / Soleno Therapeutics, Inc. | 0.03 | 41.96 | 2.86 | 66.49 | 0.2622 | 0.0923 | |||
| CWST / Casella Waste Systems, Inc. | 0.02 | 0.00 | 2.85 | 3.48 | 0.2613 | -0.0111 | |||
| MKSI / MKS Inc. | 0.03 | 0.00 | 2.84 | 23.96 | 0.2601 | 0.0338 | |||
| MQ / Marqeta, Inc. | 0.48 | 2.83 | 0.2588 | 0.2588 | |||||
| WNS / WNS (Holdings) Limited | 0.04 | 2.81 | 0.2575 | 0.2575 | |||||
| 6B6 / monday.com Ltd. | 0.01 | 88.09 | 2.78 | 143.43 | 0.2546 | 0.1417 | |||
| DUOL / Duolingo, Inc. | 0.01 | 0.00 | 2.78 | 32.02 | 0.2542 | 0.0465 | |||
| CLH / Clean Harbors, Inc. | 0.01 | -41.47 | 2.74 | -31.36 | 0.2510 | -0.1434 | |||
| FIX / Comfort Systems USA, Inc. | 0.01 | 21.43 | 2.73 | 102.07 | 0.2504 | 0.1167 | |||
| GFF / Griffon Corporation | 0.04 | 0.00 | 2.71 | 1.24 | 0.2478 | -0.0163 | |||
| OLLI / Ollie's Bargain Outlet Holdings, Inc. | 0.02 | 0.00 | 2.70 | 13.25 | 0.2474 | 0.0117 | |||
| ADUS / Addus HomeCare Corporation | 0.02 | 0.00 | 2.69 | 16.49 | 0.2459 | 0.0182 | |||
| MUSA / Murphy USA Inc. | 0.01 | -65.68 | 2.68 | -70.29 | 0.2459 | -0.6465 | |||
| SPSC / SPS Commerce, Inc. | 0.02 | -24.60 | 2.67 | -22.68 | 0.2445 | -0.0967 | |||
| TKO / TKO Group Holdings, Inc. | 0.01 | -40.97 | 2.63 | -29.71 | 0.2412 | -0.1290 | |||
| ITRI / Itron, Inc. | 0.02 | 2.63 | 0.2411 | 0.2411 | |||||
| MSA / MSA Safety Incorporated | 0.02 | 0.00 | 2.63 | 14.22 | 0.2407 | 0.0133 | |||
| LAMR / Lamar Advertising Company | 0.02 | 0.00 | 2.62 | 6.64 | 0.2396 | -0.0027 | |||
| AMG / Affiliated Managers Group, Inc. | 0.01 | 0.00 | 2.61 | 17.12 | 0.2393 | 0.0189 | |||
| CVNA / Carvana Co. | 0.01 | 0.00 | 2.60 | 61.17 | 0.2379 | 0.0787 | |||
| IPAR / Interparfums, Inc. | 0.02 | 0.00 | 2.56 | 15.30 | 0.2340 | 0.0151 | |||
| ATEN / A10 Networks, Inc. | 0.13 | 12.50 | 2.54 | 33.28 | 0.2325 | 0.0442 | |||
| VITL / Vital Farms, Inc. | 0.07 | 0.00 | 2.52 | 26.47 | 0.2311 | 0.0339 | |||
| HCC / Warrior Met Coal, Inc. | 0.05 | 24.13 | 2.45 | 19.26 | 0.2246 | 0.0214 | |||
| HAE / Haemonetics Corporation | 0.03 | 0.00 | 2.44 | 17.39 | 0.2239 | 0.0182 | |||
| LLYVK / Liberty Live Group | 0.03 | 2.42 | 0.2215 | 0.2215 | |||||
| ALSN / Allison Transmission Holdings, Inc. | 0.03 | 2.42 | 0.2212 | 0.2212 | |||||
| GPOR / Gulfport Energy Corporation | 0.01 | 0.00 | 2.41 | 9.28 | 0.2211 | 0.0028 | |||
| FTAI / FTAI Aviation Ltd. | 0.02 | -26.62 | 2.41 | -23.98 | 0.2207 | -0.0924 | |||
| LMAT / LeMaitre Vascular, Inc. | 0.03 | 0.00 | 2.40 | -0.99 | 0.2199 | -0.0197 | |||
| MDGL / Madrigal Pharmaceuticals, Inc. | 0.01 | 0.00 | 2.40 | -8.61 | 0.2197 | -0.0397 | |||
| STE / STERIS plc | 0.01 | 0.00 | 2.39 | 5.98 | 0.2192 | -0.0039 | |||
| FOUR / Shift4 Payments, Inc. | 0.02 | 0.00 | 2.39 | 21.31 | 0.2190 | 0.0242 | |||
| BWXT / BWX Technologies, Inc. | 0.02 | -44.87 | 2.31 | -19.48 | 0.2116 | -0.0719 | |||
| HGV / Hilton Grand Vacations Inc. | 0.06 | 0.00 | 2.30 | 11.04 | 0.2109 | 0.0060 | |||
| SPNS / Sapiens International Corporation N.V. | 0.08 | 0.00 | 2.30 | 7.94 | 0.2105 | 0.0002 | |||
| NEU / NewMarket Corporation | 0.00 | -25.83 | 2.30 | 34.84 | 0.2102 | 0.1050 | |||
| PEGA / Pegasystems Inc. | 0.04 | 100.00 | 2.28 | 55.74 | 0.2089 | 0.0642 | |||
| EVTC / EVERTEC, Inc. | 0.06 | 0.00 | 2.26 | -1.95 | 0.2069 | -0.0208 | |||
| FCFS / FirstCash Holdings, Inc. | 0.02 | 2.23 | 0.2043 | 0.2043 | |||||
| QLYS / Qualys, Inc. | 0.02 | 0.00 | 2.20 | 13.50 | 0.2010 | 0.0099 | |||
| GH / Guardant Health, Inc. | 0.04 | -35.66 | 2.19 | 45.96 | 0.2002 | 0.0781 | |||
| MEDP / Medpace Holdings, Inc. | 0.01 | 0.00 | 2.19 | 3.02 | 0.2001 | -0.0094 | |||
| TTC / The Toro Company | 0.03 | -20.98 | 2.18 | -23.22 | 0.1999 | -0.0810 | |||
| FRSH / Freshworks Inc. | 0.15 | 2.17 | 0.1984 | 0.1984 | |||||
| CROX / Crocs, Inc. | 0.02 | 0.00 | 2.15 | -4.65 | 0.1973 | -0.0259 | |||
| MARA / MARA Holdings, Inc. | 0.14 | 13.87 | 2.15 | 55.28 | 0.1965 | 0.0600 | |||
| ASND / Ascendis Pharma A/S - Depositary Receipt (Common Stock) | 0.01 | 0.00 | 2.13 | 10.73 | 0.1948 | 0.0050 | |||
| HIMS / Hims & Hers Health, Inc. | 0.04 | -17.27 | 2.12 | 39.60 | 0.1937 | 0.0440 | |||
| PSMT / PriceSmart, Inc. | 0.02 | 0.00 | 2.09 | 19.52 | 0.1918 | 0.0188 | |||
| WYNN / Wynn Resorts, Limited | 0.02 | 0.00 | 2.08 | 12.17 | 0.1908 | 0.0073 | |||
| DNLI / Denali Therapeutics Inc. | 0.15 | 17.19 | 2.06 | 20.61 | 0.1887 | 0.0199 | |||
| ELF / e.l.f. Beauty, Inc. | 0.02 | -41.20 | 2.05 | 16.58 | 0.1880 | 0.0140 | |||
| DRS / Leonardo DRS, Inc. | 0.04 | 0.00 | 2.04 | 41.36 | 0.1872 | 0.0444 | |||
| MLTX / MoonLake Immunotherapeutics | 0.04 | 16.16 | 2.04 | 40.41 | 0.1865 | 0.0431 | |||
| CYTK / Cytokinetics, Incorporated | 0.06 | 0.00 | 2.02 | -17.80 | 0.1853 | -0.0578 | |||
| BRZE / Braze, Inc. | 0.07 | 0.00 | 2.02 | -22.14 | 0.1852 | -0.0713 | |||
| OCBC NEW YORK / STIV (000000000) | 2.00 | 0.1832 | 0.1832 | ||||||
| TRUIST BANK / STIV (000000000) | 2.00 | 0.1832 | 0.1832 | ||||||
| BNSB34 / The Bank of Nova Scotia - Depositary Receipt (Common Stock) | 2.00 | 0.1832 | 0.1832 | ||||||
| US8252528851 / Invesco Government & Agency Portfolio, Institutional Class | 2.00 | 0.00 | 2.00 | 0.00 | 0.1832 | -0.0144 | |||
| CREDIT AGRICOLE CIB, NY / STIV (000000000) | 2.00 | 0.1832 | 0.1832 | ||||||
| Royal Bank Canada Toronto / RA (000000000) | 2.00 | 0.1832 | 0.1832 | ||||||
| GSAXX / Goldman Sachs Trust - Goldman Sachs Financial Square Government Fund | 2.00 | 100.00 | 2.00 | 100.00 | 0.1832 | 0.0844 | |||
| BANCO SANTANDER SA NY / STIV (000000000) | 2.00 | 0.1832 | 0.1832 | ||||||
| CONCORD MINUTEMEN CC LLC SER C / STIV (000000000) | 2.00 | 0.1831 | 0.1831 | ||||||
| PTCT / PTC Therapeutics, Inc. | 0.04 | -8.92 | 1.99 | -12.74 | 0.1826 | -0.0431 | |||
| BLD / TopBuild Corp. | 0.01 | 0.00 | 1.98 | 6.16 | 0.1815 | -0.0029 | |||
| PLAB / Photronics, Inc. | 0.10 | 0.00 | 1.97 | -9.28 | 0.1808 | -0.0342 | |||
| UEC / Uranium Energy Corp. | 0.29 | 1.97 | 0.1802 | 0.1802 | |||||
| PI / Impinj, Inc. | 0.02 | 0.00 | 1.95 | 22.43 | 0.1790 | 0.0213 | |||
| RVMD / Revolution Medicines, Inc. | 0.05 | 8.15 | 1.95 | 12.51 | 0.1788 | 0.0074 | |||
| NBIX / Neurocrine Biosciences, Inc. | 0.02 | -16.20 | 1.95 | -4.79 | 0.1786 | -0.0237 | |||
| MP / MP Materials Corp. | 0.06 | -78.85 | 1.88 | -71.18 | 0.1723 | -0.4724 | |||
| RYTM / Rhythm Pharmaceuticals, Inc. | 0.03 | 15.10 | 1.88 | 37.38 | 0.1720 | 0.0369 | |||
| MRUS / Merus N.V. | 0.04 | 183.87 | 1.87 | 255.24 | 0.1709 | 0.1189 | |||
| CNR / Core Natural Resources, Inc. | 0.03 | 0.00 | 1.85 | -9.51 | 0.1692 | -0.0326 | |||
| SMA / SmartStop Self Storage REIT, Inc. | 0.05 | 1.84 | 0.1687 | 0.1687 | |||||
| OKTA / Okta, Inc. | 0.02 | 1.83 | 0.1675 | 0.1675 | |||||
| SMPL / The Simply Good Foods Company | 0.06 | 0.00 | 1.82 | -8.40 | 0.1667 | -0.0296 | |||
| REPL / Replimune Group, Inc. | 0.19 | 0.00 | 1.78 | -4.76 | 0.1631 | -0.0216 | |||
| ASO / Academy Sports and Outdoors, Inc. | 0.04 | 0.00 | 1.76 | -1.78 | 0.1614 | -0.0158 | |||
| TGTX / TG Therapeutics, Inc. | 0.05 | 59.84 | 1.74 | 45.89 | 0.1593 | 0.0415 | |||
| ABG / Asbury Automotive Group, Inc. | 0.01 | 0.00 | 1.73 | 8.05 | 0.1586 | 0.0002 | |||
| TPG / TPG Inc. | 0.03 | 31.73 | 1.72 | 45.64 | 0.1575 | 0.0409 | |||
| ASTS / AST SpaceMobile, Inc. | 0.04 | 1.72 | 0.1575 | 0.1575 | |||||
| CHDN / Churchill Downs Incorporated | 0.02 | -43.35 | 1.70 | -48.49 | 0.1559 | -0.1706 | |||
| MIRM / Mirum Pharmaceuticals, Inc. | 0.03 | 0.00 | 1.69 | 12.99 | 0.1546 | 0.0070 | |||
| LPX / Louisiana-Pacific Corporation | 0.02 | -72.89 | 1.69 | -74.66 | 0.1544 | -0.5026 | |||
| TNET / TriNet Group, Inc. | 0.02 | 0.00 | 1.68 | -7.73 | 0.1543 | -0.0260 | |||
| TNL / Travel + Leisure Co. | 0.03 | 0.00 | 1.68 | 11.52 | 0.1534 | 0.0050 | |||
| AUR / Aurora Innovation, Inc. | 0.32 | 0.00 | 1.66 | -22.11 | 0.1524 | -0.0586 | |||
| BEAM / Beam Therapeutics Inc. | 0.10 | 0.00 | 1.63 | -12.92 | 0.1489 | -0.0355 | |||
| IESC / IES Holdings, Inc. | 0.01 | 0.00 | 1.60 | 79.46 | 0.1465 | 0.0584 | |||
| ING Financial Markets LLC / RA (000000000) | 1.59 | 0.1456 | 0.1456 | ||||||
| BPMC / Blueprint Medicines Corporation | 0.01 | -73.95 | 1.55 | -62.29 | 0.1418 | -0.2637 | |||
| TMDX / TransMedics Group, Inc. | 0.01 | 0.00 | 1.55 | 99.23 | 0.1416 | 0.0649 | |||
| DPZ / Domino's Pizza, Inc. | 0.00 | 48.16 | 1.52 | 45.28 | 0.1396 | 0.0360 | |||
| CPRX / Catalyst Pharmaceuticals, Inc. | 0.07 | -26.65 | 1.48 | -34.40 | 0.1356 | -0.0873 | |||
| PRAX / Praxis Precision Medicines, Inc. | 0.04 | 36.59 | 1.48 | 51.75 | 0.1351 | 0.0390 | |||
| BRBR / BellRing Brands, Inc. | 0.03 | 0.00 | 1.47 | -22.21 | 0.1347 | -0.0521 | |||
| IMAX / IMAX Corporation | 0.05 | 0.00 | 1.47 | 6.07 | 0.1344 | -0.0022 | |||
| RYAN / Ryan Specialty Holdings, Inc. | 0.02 | 0.00 | 1.47 | -7.91 | 0.1343 | -0.0231 | |||
| ACLX / Arcellx, Inc. | 0.02 | 0.00 | 1.45 | 0.41 | 0.1332 | -0.0099 | |||
| IRON / Disc Medicine, Inc. | 0.03 | 0.00 | 1.45 | 6.70 | 0.1329 | -0.0015 | |||
| RRR / Red Rock Resorts, Inc. | 0.03 | 18.43 | 1.44 | 42.11 | 0.1320 | 0.0318 | |||
| KRYS / Krystal Biotech, Inc. | 0.01 | 0.00 | 1.43 | -23.77 | 0.1310 | -0.0543 | |||
| AXSM / Axsome Therapeutics, Inc. | 0.01 | 1.43 | 0.1310 | 0.1310 | |||||
| BLDR / Builders FirstSource, Inc. | 0.01 | 0.00 | 1.42 | -6.64 | 0.1302 | -0.0202 | |||
| CRCL / Circle Internet Group, Inc. | 0.01 | 1.41 | 0.1295 | 0.1295 | |||||
| EEFT / Euronet Worldwide, Inc. | 0.01 | -67.59 | 1.40 | -69.26 | 0.1286 | -0.3227 | |||
| NXT / Nextracker Inc. | 0.03 | 0.00 | 1.36 | 29.06 | 0.1245 | 0.0204 | |||
| FLR / Fluor Corporation | 0.03 | 0.00 | 1.35 | 43.17 | 0.1240 | 0.0305 | |||
| VERA / Vera Therapeutics, Inc. | 0.06 | -14.62 | 1.35 | -16.22 | 0.1235 | -0.0356 | |||
| BELFB / Bel Fuse Inc. | 0.01 | 1.33 | 0.1214 | 0.1214 | |||||
| AGIO / Agios Pharmaceuticals, Inc. | 0.04 | 27.62 | 1.32 | 44.85 | 0.1210 | 0.0309 | |||
| PLUS / ePlus inc. | 0.02 | 0.00 | 1.30 | 18.12 | 0.1188 | 0.0103 | |||
| CLDX / Celldex Therapeutics, Inc. | 0.06 | 11.17 | 1.28 | 24.73 | 0.1169 | 0.0157 | |||
| BL / BlackLine, Inc. | 0.02 | 0.00 | 1.27 | 16.90 | 0.1167 | 0.0090 | |||
| LFUS / Littelfuse, Inc. | 0.01 | 30.79 | 1.26 | 50.66 | 0.1155 | 0.0328 | |||
| FA / First Advantage Corporation | 0.08 | -9.91 | 1.25 | 6.19 | 0.1148 | -0.0018 | |||
| GLXY / Galaxy Digital Inc. | 0.06 | 1.24 | 0.1131 | 0.1131 | |||||
| CARG / CarGurus, Inc. | 0.04 | 0.00 | 1.22 | 14.85 | 0.1120 | 0.0068 | |||
| TD Prime Services LLC / RA (000000000) | 1.20 | 0.1099 | 0.1099 | ||||||
| BHVN / Biohaven Ltd. | 0.08 | -13.46 | 1.19 | -49.21 | 0.1088 | -0.1223 | |||
| AMR / Alpha Metallurgical Resources, Inc. | 0.01 | 0.00 | 1.16 | -10.25 | 0.1059 | -0.0213 | |||
| HURN / Huron Consulting Group Inc. | 0.01 | 1.16 | 0.1058 | 0.1058 | |||||
| CACI / CACI International Inc | 0.00 | 0.00 | 1.12 | 29.94 | 0.1030 | 0.0175 | |||
| BTSG / BrightSpring Health Services, Inc. | 0.05 | 1.12 | 0.1024 | 0.1024 | |||||
| ACAD / ACADIA Pharmaceuticals Inc. | 0.05 | 30.11 | 1.11 | 69.00 | 0.1019 | 0.0368 | |||
| HRI / Herc Holdings Inc. | 0.01 | 0.00 | 1.11 | -1.86 | 0.1016 | -0.0101 | |||
| ESI / Element Solutions Inc | 0.05 | 0.00 | 1.10 | 0.18 | 0.1006 | -0.0077 | |||
| SEM / Select Medical Holdings Corporation | 0.07 | 0.00 | 1.09 | -9.11 | 0.0996 | -0.0186 | |||
| REXR / Rexford Industrial Realty, Inc. | 0.03 | 0.00 | 1.05 | -9.12 | 0.0958 | -0.0180 | |||
| PRKS / United Parks & Resorts Inc. | 0.02 | 0.00 | 1.04 | 3.69 | 0.0954 | -0.0038 | |||
| VECO / Veeco Instruments Inc. | 0.05 | 0.00 | 1.03 | 1.18 | 0.0940 | -0.0062 | |||
| PRGS / Progress Software Corporation | 0.02 | 0.00 | 1.00 | 24.01 | 0.0918 | 0.0119 | |||
| PRCT / PROCEPT BioRobotics Corporation | 0.02 | 0.00 | 1.00 | -1.09 | 0.0917 | -0.0084 | |||
| COMMONWEALTH BANK AUS, NEW YORK / STIV (000000000) | 1.00 | 0.0917 | 0.0917 | ||||||
| PFGC / Performance Food Group Company | 0.01 | -47.61 | 1.00 | -41.76 | 0.0917 | -0.0780 | |||
| SOCIETE GENERALE NEW YORK / STIV (000000000) | 1.00 | 0.0916 | 0.0916 | ||||||
| RABOBANK LONDON / STIV (000000000) | 1.00 | 0.0916 | 0.0916 | ||||||
| ANZ NATIONAL (INTL) LTD / STIV (000000000) | 1.00 | 0.0916 | 0.0916 | ||||||
| Barclays Capital Inc / RA (000000000) | 1.00 | 0.0916 | 0.0916 | ||||||
| FIRST ABU DHABI BANK USA NV / STIV (000000000) | 1.00 | 0.0916 | 0.0916 | ||||||
| OCBC NEW YORK / STIV (000000000) | 1.00 | 0.0916 | 0.0916 | ||||||
| BANK OF NOVA SCOTIA HOUSTON / STIV (000000000) | 1.00 | 0.0916 | 0.0916 | ||||||
| ING (US) Funding LLC / STIV (000000000) | 1.00 | 0.0916 | 0.0916 | ||||||
| TORONTO DOMINION NY / STIV (000000000) | 1.00 | 0.0916 | 0.0916 | ||||||
| CHESHAM FINANCE LIMITED SERIES I / STIV (000000000) | 1.00 | 0.0915 | 0.0915 | ||||||
| IONIC SER III CL A / STIV (000000000) | 1.00 | 0.0915 | 0.0915 | ||||||
| CON / Concentra Group Holdings Parent, Inc. | 0.05 | 0.00 | 1.00 | -5.14 | 0.0912 | -0.0126 | |||
| QBTS / D-Wave Quantum Inc. | 0.07 | 0.95 | 0.0873 | 0.0873 | |||||
| LBRT / Liberty Energy Inc. | 0.08 | 0.00 | 0.95 | -27.46 | 0.0871 | -0.0425 | |||
| CNTA / Centessa Pharmaceuticals plc - Depositary Receipt (Common Stock) | 0.07 | 0.94 | 0.0863 | 0.0863 | |||||
| CGON / CG Oncology, Inc. | 0.03 | 0.91 | 0.0831 | 0.0831 | |||||
| OSIS / OSI Systems, Inc. | 0.00 | -50.29 | 0.90 | 20.03 | 0.0824 | 0.0354 | |||
| ELS / Equity LifeStyle Properties, Inc. | 0.01 | -51.78 | 0.82 | -55.46 | 0.0755 | -0.1072 | |||
| CARS / Cars.com Inc. | 0.07 | 0.00 | 0.81 | 5.09 | 0.0738 | -0.0019 | |||
| GLOB / Globant S.A. | 0.01 | -67.44 | 0.80 | -74.87 | 0.0731 | -0.2407 | |||
| JANX / Janux Therapeutics, Inc. | 0.03 | 107.45 | 0.77 | 77.65 | 0.0707 | 0.0277 | |||
| AVAV / AeroVironment, Inc. | 0.00 | 0.77 | 0.0705 | 0.0705 | |||||
| CNMD / CONMED Corporation | 0.01 | 0.00 | 0.75 | -13.73 | 0.0685 | -0.0172 | |||
| NRIX / Nurix Therapeutics, Inc. | 0.07 | 0.00 | 0.74 | -4.13 | 0.0680 | -0.0085 | |||
| UFPI / UFP Industries, Inc. | 0.01 | -87.30 | 0.71 | -88.21 | 0.0654 | -0.5329 | |||
| DYN / Dyne Therapeutics, Inc. | 0.07 | 55.75 | 0.67 | 41.95 | 0.0614 | 0.0147 | |||
| PCVX / Vaxcyte, Inc. | 0.02 | 0.00 | 0.66 | -13.95 | 0.0605 | -0.0153 | |||
| TDC / Teradata Corporation | 0.03 | 0.00 | 0.66 | -0.76 | 0.0601 | -0.0052 | |||
| JOBY / Joby Aviation, Inc. | 0.06 | 0.64 | 0.0584 | 0.0584 | |||||
| PSTG / Pure Storage, Inc. | 0.01 | 0.00 | 0.64 | 30.06 | 0.0583 | 0.0099 | |||
| XNCR / Xencor, Inc. | 0.08 | 0.00 | 0.62 | -26.07 | 0.0572 | -0.0263 | |||
| AMPH / Amphastar Pharmaceuticals, Inc. | 0.03 | -52.81 | 0.59 | -62.67 | 0.0539 | -0.1017 | |||
| RDNT / RadNet, Inc. | 0.01 | -43.24 | 0.57 | -35.05 | 0.0520 | -0.0343 | |||
| FOLD / Amicus Therapeutics, Inc. | 0.10 | -20.91 | 0.55 | -44.54 | 0.0508 | -0.0479 | |||
| VRDN / Viridian Therapeutics, Inc. | 0.04 | 0.54 | 0.0495 | 0.0495 | |||||
| RGTI / Rigetti Computing, Inc. | 0.04 | 0.51 | 0.0465 | 0.0465 | |||||
| TENB / Tenable Holdings, Inc. | 0.01 | -68.60 | 0.49 | -69.68 | 0.0446 | -0.1141 | |||
| CAI / Caris Life Sciences, Inc. | 0.02 | 0.49 | 0.0445 | 0.0445 | |||||
| CWT / California Water Service Group | 0.01 | 0.41 | 0.0379 | 0.0379 | |||||
| 1U5 / Wave Life Sciences Ltd. | 0.05 | 0.00 | 0.35 | -19.40 | 0.0320 | -0.0109 | |||
| GLUE / Monte Rosa Therapeutics, Inc. | 0.08 | 0.00 | 0.34 | -2.83 | 0.0314 | -0.0035 | |||
| FLOC / Flowco Holdings Inc. | 0.02 | -41.98 | 0.28 | -59.80 | 0.0252 | -0.0424 | |||
| BCAX / Bicara Therapeutics Inc. | 0.03 | 0.23 | 0.0214 | 0.0214 | |||||
| IOVA / Iovance Biotherapeutics, Inc. | 0.08 | -33.09 | 0.14 | -65.62 | 0.0131 | -0.0278 | |||
| FORM / FormFactor, Inc. | 0.00 | -92.00 | 0.14 | -90.32 | 0.0124 | -0.1253 | |||
| US361ESC0496 / ESC GCI LIBERTY INC SR | 0.09 | 0.00 | 0.00 | 0.0000 | 0.0000 |