Statistik Asas
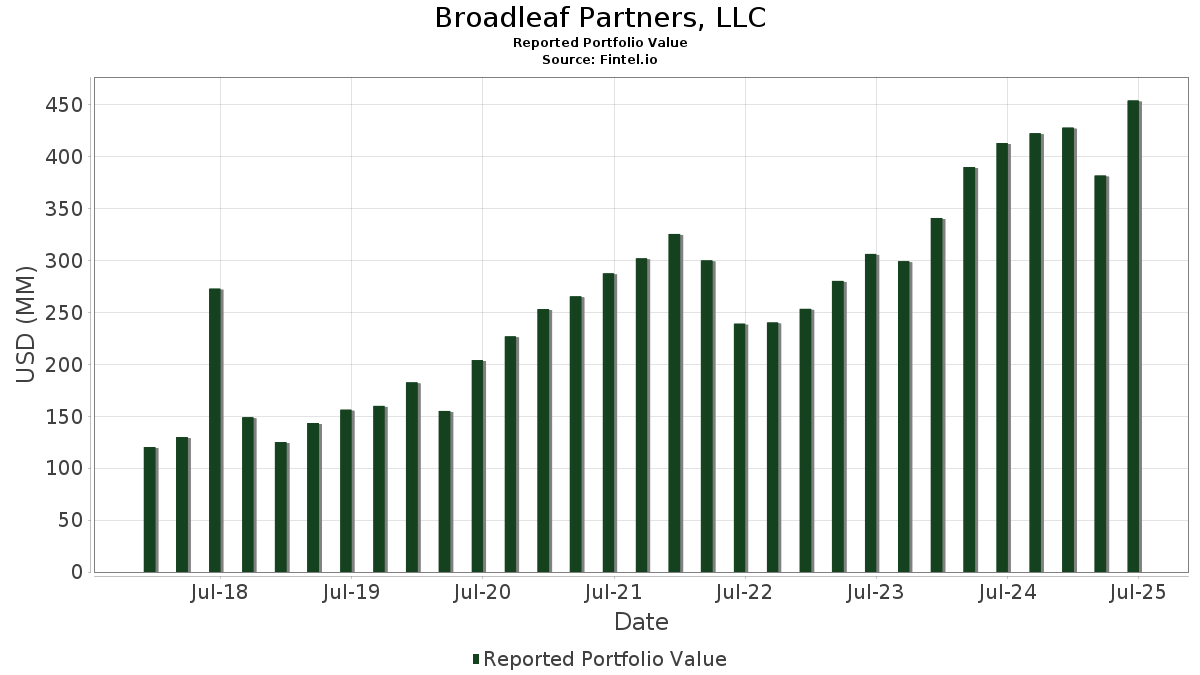
| Nilai Portfolio | $ 454,236,237 |
| Kedudukan Semasa | 82 |
Pegangan Terkini, Prestasi, AUM (dari 13F, 13D)
Broadleaf Partners, LLC telah mendedahkan 82 jumlah pegangan dalam pemfailan SEC terkini mereka. Nilai portfolio terkini dikira sebagai $ 454,236,237 USD. Aset Sebenar Di Bawah Pengurusan (AUM) ialah nilai ini ditambah dengan tunai (yang tidak didedahkan). Pegangan teratas Broadleaf Partners, LLC ialah Microsoft Corporation (US:MSFT) , NVIDIA Corporation (US:NVDA) , Amazon.com, Inc. (US:AMZN) , Apple Inc. (US:AAPL) , and Meta Platforms, Inc. (US:META) . Kedudukan baharu Broadleaf Partners, LLC termasuk Spotify Technology S.A. (US:SPOT) , Palo Alto Networks, Inc. (US:PANW) , .
Kenaikan Teratas Suku Tahun Ini
Kami menggunakan perubahan dalam peruntukan portfolio kerana ini adalah metrik yang paling bermakna. Perubahan boleh disebabkan oleh perdagangan atau perubahan dalam harga saham.
| Sekuriti | Saham (MM) |
Nilai (MM$) |
Portfolio % | ΔPortfolio % |
|---|---|---|---|---|
| 0.05 | 13.82 | 3.0426 | 1.4398 | |
| 0.19 | 30.19 | 6.6461 | 1.1812 | |
| 0.01 | 3.94 | 0.8681 | 0.8681 | |
| 0.00 | 7.42 | 1.6339 | 0.8487 | |
| 0.02 | 3.71 | 0.8170 | 0.8170 | |
| 0.03 | 7.54 | 1.6604 | 0.7886 | |
| 0.06 | 30.80 | 6.7800 | 0.6668 | |
| 0.07 | 9.06 | 1.9939 | 0.6527 | |
| 0.06 | 8.24 | 1.8148 | 0.5971 | |
| 0.07 | 11.72 | 2.5791 | 0.5724 |
Penurunan Teratas Suku Tahun Ini
Kami menggunakan perubahan dalam peruntukan portfolio kerana ini adalah metrik yang paling bermakna. Perubahan boleh disebabkan oleh perdagangan atau perubahan dalam harga saham.
| Sekuriti | Saham (MM) |
Nilai (MM$) |
Portfolio % | ΔPortfolio % |
|---|---|---|---|---|
| 0.10 | 19.66 | 4.3287 | -2.3160 | |
| 0.07 | 3.83 | 0.8424 | -1.0736 | |
| 0.09 | 15.08 | 3.3204 | -0.9272 | |
| 0.00 | 1.13 | 0.2485 | -0.8953 | |
| 0.77 | 17.02 | 3.7460 | -0.7219 | |
| 0.04 | 10.57 | 2.3265 | -0.6102 | |
| 0.01 | 12.78 | 2.8140 | -0.4011 | |
| 0.02 | 9.89 | 2.1766 | -0.3529 | |
| 0.01 | 4.96 | 1.0923 | -0.2895 | |
| 0.17 | 4.56 | 1.0041 | -0.2611 |
13F dan Pemfailan Dana
Borang ini telah difailkan pada 2025-08-14 untuk tempoh pelaporan 2025-06-30. Klik ikon pautan untuk melihat sejarah transaksi penuh.
Tingkatkan untuk membuka data premium dan eksport ke Excel ![]() .
.
| Sekuriti | Jenis | Purata Harga Saham | Saham (MM) |
ΔSaham (%) |
ΔSaham (%) |
Nilai ($MM) |
Portfolio (%) |
ΔPortfolio (%) |
|
|---|---|---|---|---|---|---|---|---|---|
| MSFT / Microsoft Corporation | 0.06 | -0.45 | 30.80 | 31.91 | 6.7800 | 0.6668 | |||
| NVDA / NVIDIA Corporation | 0.19 | -0.78 | 30.19 | 44.64 | 6.6461 | 1.1812 | |||
| AMZN / Amazon.com, Inc. | 0.11 | -0.19 | 24.49 | 15.09 | 5.3904 | -0.1799 | |||
| AAPL / Apple Inc. | 0.10 | -16.12 | 19.66 | -22.52 | 4.3287 | -2.3160 | |||
| META / Meta Platforms, Inc. | 0.03 | -0.55 | 19.56 | 27.36 | 4.3065 | 0.2848 | |||
| SCHF / Schwab Strategic Trust - Schwab International Equity ETF | 0.77 | -10.75 | 17.02 | -0.29 | 3.7460 | -0.7219 | |||
| GOOG / Alphabet Inc. | 0.09 | -18.12 | 15.08 | -7.03 | 3.3204 | -0.9272 | |||
| SCHG / Schwab Strategic Trust - Schwab U.S. Large-Cap Growth ETF | 0.48 | 9.03 | 13.98 | 27.18 | 3.0768 | 0.1997 | |||
| AVGO / Broadcom Inc. | 0.05 | 37.13 | 13.82 | 125.78 | 3.0426 | 1.4398 | |||
| NOW / ServiceNow, Inc. | 0.01 | -0.56 | 13.27 | 28.41 | 2.9213 | 0.2155 | |||
| NFLX / Netflix, Inc. | 0.01 | -0.39 | 12.97 | 43.05 | 2.8552 | 0.4812 | |||
| COST / Costco Wholesale Corporation | 0.01 | -0.55 | 12.78 | 4.10 | 2.8140 | -0.4011 | |||
| GS / The Goldman Sachs Group, Inc. | 0.02 | -0.29 | 12.77 | 29.17 | 2.8108 | 0.2229 | |||
| ARM / Arm Holdings plc - Depositary Receipt (Common Stock) | 0.07 | 0.93 | 11.72 | 52.86 | 2.5791 | 0.5724 | |||
| PGR / The Progressive Corporation | 0.04 | -0.08 | 10.57 | -5.78 | 2.3265 | -0.6102 | |||
| CTAS / Cintas Corporation | 0.05 | -0.08 | 10.41 | 8.35 | 2.2919 | -0.2238 | |||
| ISRG / Intuitive Surgical, Inc. | 0.02 | -0.51 | 10.36 | 9.17 | 2.2807 | -0.2041 | |||
| ANET / Arista Networks Inc | 0.10 | -3.88 | 9.90 | 26.92 | 2.1796 | 0.1371 | |||
| MA / Mastercard Incorporated | 0.02 | -0.18 | 9.89 | 2.34 | 2.1766 | -0.3529 | |||
| VRT / Vertiv Holdings Co | 0.07 | -0.59 | 9.06 | 76.81 | 1.9939 | 0.6527 | |||
| UBER / Uber Technologies, Inc. | 0.10 | -0.35 | 8.98 | 27.61 | 1.9759 | 0.1344 | |||
| ORCL / Oracle Corporation | 0.04 | -0.54 | 8.32 | 55.54 | 1.8306 | 0.4307 | |||
| PLTR / Palantir Technologies Inc. | 0.06 | 9.74 | 8.24 | 77.27 | 1.8148 | 0.5971 | |||
| URI / United Rentals, Inc. | 0.01 | 0.17 | 7.91 | 20.42 | 1.7409 | 0.0215 | |||
| JPM / JPMorgan Chase & Co. | 0.03 | 91.67 | 7.54 | 126.55 | 1.6604 | 0.7886 | |||
| BKNG / Booking Holdings Inc. | 0.00 | 96.93 | 7.42 | 147.45 | 1.6339 | 0.8487 | |||
| FBCG / Fidelity Covington Trust - Fidelity Blue Chip Growth ETF | 0.14 | 14.86 | 6.58 | 38.64 | 1.4486 | 0.2058 | |||
| SCHM / Schwab Strategic Trust - Schwab U.S. Mid-Cap ETF | 0.23 | 5.16 | 6.47 | 12.59 | 1.4235 | -0.0803 | |||
| TSLA / Tesla, Inc. | 0.02 | -0.07 | 5.48 | 22.48 | 1.2068 | 0.0350 | |||
| DDOG / Datadog, Inc. | 0.04 | -0.57 | 5.37 | 34.61 | 1.1817 | 0.1378 | |||
| LLY / Eli Lilly and Company | 0.01 | -0.39 | 4.96 | -5.99 | 1.0923 | -0.2895 | |||
| SHW / The Sherwin-Williams Company | 0.01 | -0.11 | 4.73 | -1.77 | 1.0407 | -0.2194 | |||
| TDG / TransDigm Group Incorporated | 0.00 | -0.07 | 4.64 | 9.85 | 1.0214 | -0.0844 | |||
| SCHD / Schwab Strategic Trust - Schwab U.S. Dividend Equity ETF | 0.17 | -0.41 | 4.56 | -5.61 | 1.0041 | -0.2611 | |||
| APP / AppLovin Corporation | 0.01 | -0.15 | 4.22 | 31.92 | 0.9292 | 0.0915 | |||
| SPOT / Spotify Technology S.A. | 0.01 | 3.94 | 0.8681 | 0.8681 | |||||
| BALL / Ball Corporation | 0.07 | -9.19 | 3.88 | -2.17 | 0.8544 | -0.1844 | |||
| CMG / Chipotle Mexican Grill, Inc. | 0.07 | -53.24 | 3.83 | -47.71 | 0.8424 | -1.0736 | |||
| PANW / Palo Alto Networks, Inc. | 0.02 | 3.71 | 0.8170 | 0.8170 | |||||
| TXRH / Texas Roadhouse, Inc. | 0.02 | 0.71 | 3.34 | 13.27 | 0.7350 | -0.0368 | |||
| SCHA / Schwab Strategic Trust - Schwab U.S. Small-Cap ETF | 0.13 | 8.62 | 3.30 | 17.26 | 0.7269 | -0.0102 | |||
| UTHR / United Therapeutics Corporation | 0.01 | -0.08 | 2.73 | -6.87 | 0.6003 | -0.1663 | |||
| IWP / iShares Trust - iShares Russell Mid-Cap Growth ETF | 0.02 | 4.56 | 2.71 | 23.44 | 0.5960 | 0.0217 | |||
| VRTX / Vertex Pharmaceuticals Incorporated | 0.01 | 0.37 | 2.68 | -7.81 | 0.5898 | -0.1713 | |||
| QQQ / Invesco QQQ Trust, Series 1 | 0.00 | 4.71 | 2.27 | 23.19 | 0.4994 | 0.0172 | |||
| VTV / Vanguard Index Funds - Vanguard Value ETF | 0.01 | -2.57 | 1.89 | -0.32 | 0.4161 | -0.0803 | |||
| BRK.B / Berkshire Hathaway Inc. | 0.00 | -71.67 | 1.13 | -74.18 | 0.2485 | -0.8953 | |||
| JNJ / Johnson & Johnson | 0.01 | 0.00 | 1.10 | -7.95 | 0.2424 | -0.0706 | |||
| VOO / Vanguard Index Funds - Vanguard S&P 500 ETF | 0.00 | -16.38 | 1.09 | -7.61 | 0.2406 | -0.0690 | |||
| ABBV / AbbVie Inc. | 0.00 | -16.40 | 0.89 | -25.93 | 0.1969 | -0.1193 | |||
| PG / The Procter & Gamble Company | 0.01 | -0.45 | 0.89 | -6.93 | 0.1952 | -0.0543 | |||
| GOOGL / Alphabet Inc. | 0.00 | -9.51 | 0.59 | 3.14 | 0.1304 | -0.0200 | |||
| SCHB / Schwab Strategic Trust - Schwab U.S. Broad Market ETF | 0.02 | 0.11 | 0.57 | 10.64 | 0.1261 | -0.0093 | |||
| VTI / Vanguard Index Funds - Vanguard Total Stock Market ETF | 0.00 | -15.20 | 0.55 | -6.19 | 0.1202 | -0.0322 | |||
| XOM / Exxon Mobil Corporation | 0.00 | 0.00 | 0.52 | -9.44 | 0.1142 | -0.0356 | |||
| MCO / Moody's Corporation | 0.00 | 0.00 | 0.51 | 7.58 | 0.1126 | -0.0117 | |||
| NOC / Northrop Grumman Corporation | 0.00 | 0.00 | 0.49 | -2.40 | 0.1079 | -0.0235 | |||
| CSCO / Cisco Systems, Inc. | 0.01 | 0.00 | 0.48 | 12.44 | 0.1055 | -0.0061 | |||
| HD / The Home Depot, Inc. | 0.00 | -8.52 | 0.48 | -8.46 | 0.1048 | -0.0314 | |||
| PEP / PepsiCo, Inc. | 0.00 | -8.73 | 0.47 | -19.66 | 0.1045 | -0.0501 | |||
| DIS / The Walt Disney Company | 0.00 | 0.00 | 0.42 | 25.98 | 0.0918 | 0.0049 | |||
| MS / Morgan Stanley | 0.00 | 0.00 | 0.38 | 20.50 | 0.0843 | 0.0013 | |||
| GLD / SPDR Gold Trust | 0.00 | -52.73 | 0.37 | -49.93 | 0.0808 | -0.1114 | |||
| KBWB / Invesco Exchange-Traded Fund Trust II - Invesco KBW Bank ETF | 0.00 | 0.00 | 0.35 | 14.19 | 0.0763 | -0.0032 | |||
| MCD / McDonald's Corporation | 0.00 | 0.00 | 0.35 | -6.25 | 0.0760 | -0.0206 | |||
| VWO / Vanguard International Equity Index Funds - Vanguard FTSE Emerging Markets ETF | 0.01 | -16.14 | 0.32 | -8.31 | 0.0705 | -0.0210 | |||
| HBAN / Huntington Bancshares Incorporated | 0.02 | 0.00 | 0.32 | 11.70 | 0.0694 | -0.0045 | |||
| FE / FirstEnergy Corp. | 0.01 | -39.53 | 0.31 | -39.92 | 0.0678 | -0.0661 | |||
| ABT / Abbott Laboratories | 0.00 | -39.36 | 0.30 | -37.78 | 0.0667 | -0.0609 | |||
| XLU / The Select Sector SPDR Trust - The Utilities Select Sector SPDR Fund | 0.00 | 0.00 | 0.30 | 3.51 | 0.0651 | -0.0097 | |||
| CMCSA / Comcast Corporation | 0.01 | 0.00 | 0.29 | -3.29 | 0.0649 | -0.0149 | |||
| XLK / The Select Sector SPDR Trust - The Technology Select Sector SPDR Fund | 0.00 | -0.87 | 0.29 | 21.52 | 0.0636 | 0.0014 | |||
| CAT / Caterpillar Inc. | 0.00 | 0.00 | 0.29 | 17.62 | 0.0632 | -0.0007 | |||
| XLY / The Select Sector SPDR Trust - The Consumer Discretionary Select Sector SPDR Fund | 0.00 | 0.00 | 0.29 | 10.42 | 0.0630 | -0.0051 | |||
| CVX / Chevron Corporation | 0.00 | 0.00 | 0.28 | -14.42 | 0.0616 | -0.0240 | |||
| UNP / Union Pacific Corporation | 0.00 | 0.00 | 0.28 | -2.47 | 0.0608 | -0.0134 | |||
| ITW / Illinois Tool Works Inc. | 0.00 | 0.00 | 0.26 | -0.39 | 0.0568 | -0.0110 | |||
| IBM / International Business Machines Corporation | 0.00 | 0.00 | 0.26 | 18.60 | 0.0563 | -0.0002 | |||
| SCHW / The Charles Schwab Corporation | 0.00 | 0.00 | 0.24 | 16.50 | 0.0530 | -0.0011 | |||
| NSC / Norfolk Southern Corporation | 0.00 | 0.00 | 0.22 | 8.37 | 0.0485 | -0.0049 | |||
| IWF / iShares Trust - iShares Russell 1000 Growth ETF | 0.00 | 0.21 | 0.0463 | 0.0463 | |||||
| XLC / The Select Sector SPDR Trust - The Communication Services Select Sector SPDR Fund | 0.00 | 0.21 | 0.0460 | 0.0460 | |||||
| KKR / KKR & Co. Inc. | 0.00 | -100.00 | 0.00 | 0.0000 |