Statistik Asas
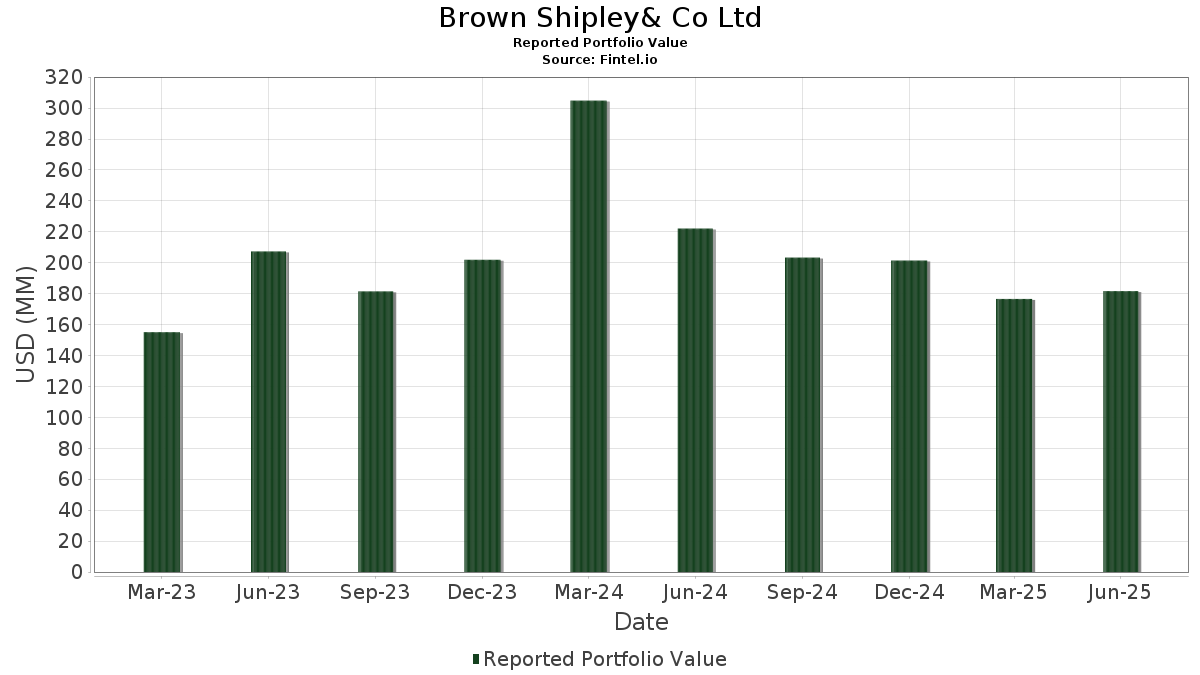
| Nilai Portfolio | $ 181,649,629 |
| Kedudukan Semasa | 74 |
Pegangan Terkini, Prestasi, AUM (dari 13F, 13D)
Brown Shipley& Co Ltd telah mendedahkan 74 jumlah pegangan dalam pemfailan SEC terkini mereka. Nilai portfolio terkini dikira sebagai $ 181,649,629 USD. Aset Sebenar Di Bawah Pengurusan (AUM) ialah nilai ini ditambah dengan tunai (yang tidak didedahkan). Pegangan teratas Brown Shipley& Co Ltd ialah Microsoft Corporation (US:MSFT) , NVIDIA Corporation (US:NVDA) , Alphabet Inc. (US:GOOG) , Visa Inc. (US:V) , and JPMorgan Chase & Co. (US:JPM) . Kedudukan baharu Brown Shipley& Co Ltd termasuk Ralliant Corporation (US:RAL) , Salesforce, Inc. (US:CRM) , Cisco Systems, Inc. (US:CSCO) , Broadcom Inc. (US:AVGO) , and TKO Group Holdings, Inc. (US:TKO) .
Kenaikan Teratas Suku Tahun Ini
Kami menggunakan perubahan dalam peruntukan portfolio kerana ini adalah metrik yang paling bermakna. Perubahan boleh disebabkan oleh perdagangan atau perubahan dalam harga saham.
| Sekuriti | Saham (MM) |
Nilai (MM$) |
Portfolio % | ΔPortfolio % |
|---|---|---|---|---|
| 0.16 | 24.51 | 13.4954 | 2.9855 | |
| 0.06 | 28.11 | 15.4735 | 2.0425 | |
| 0.01 | 8.60 | 4.7321 | 0.7245 | |
| 0.01 | 4.18 | 2.2998 | 0.4900 | |
| 0.01 | 7.52 | 4.1396 | 0.4601 | |
| 0.07 | 8.18 | 4.5056 | 0.4198 | |
| 0.02 | 5.20 | 2.8636 | 0.3649 | |
| 0.05 | 8.20 | 4.5153 | 0.2665 | |
| 0.04 | 10.83 | 5.9597 | 0.2048 | |
| 0.01 | 0.26 | 0.1426 | 0.1426 |
Penurunan Teratas Suku Tahun Ini
Kami menggunakan perubahan dalam peruntukan portfolio kerana ini adalah metrik yang paling bermakna. Perubahan boleh disebabkan oleh perdagangan atau perubahan dalam harga saham.
| Sekuriti | Saham (MM) |
Nilai (MM$) |
Portfolio % | ΔPortfolio % |
|---|---|---|---|---|
| 0.02 | 0.85 | 0.4658 | -1.5928 | |
| 0.01 | 3.48 | 1.9168 | -1.4361 | |
| 0.02 | 1.35 | 0.7405 | -1.1331 | |
| 0.04 | 7.04 | 3.8737 | -0.9453 | |
| 0.03 | 11.28 | 6.2089 | -0.8302 | |
| 0.01 | 4.79 | 2.6395 | -0.7862 | |
| 0.04 | 3.25 | 1.7910 | -0.4223 | |
| 0.00 | 3.80 | 2.0912 | -0.3090 | |
| 0.02 | 2.62 | 1.4443 | -0.3061 | |
| 0.04 | 4.31 | 2.3736 | -0.2088 |
13F dan Pemfailan Dana
Borang ini telah difailkan pada 2025-07-18 untuk tempoh pelaporan 2025-06-30. Klik ikon pautan untuk melihat sejarah transaksi penuh.
Tingkatkan untuk membuka data premium dan eksport ke Excel ![]() .
.
| Sekuriti | Jenis | Purata Harga Saham | Saham (MM) |
ΔSaham (%) |
ΔSaham (%) |
Nilai ($MM) |
Portfolio (%) |
ΔPortfolio (%) |
|
|---|---|---|---|---|---|---|---|---|---|
| MSFT / Microsoft Corporation | 0.06 | -10.56 | 28.11 | 18.51 | 15.4735 | 2.0425 | |||
| NVDA / NVIDIA Corporation | 0.16 | -9.39 | 24.51 | 32.09 | 13.4954 | 2.9855 | |||
| GOOG / Alphabet Inc. | 0.08 | -9.61 | 13.68 | 2.63 | 7.5312 | -0.0171 | |||
| V / Visa Inc. | 0.03 | -10.44 | 11.28 | -9.27 | 6.2089 | -0.8302 | |||
| JPM / JPMorgan Chase & Co. | 0.04 | -9.87 | 10.83 | 6.52 | 5.9597 | 0.2048 | |||
| NOW / ServiceNow, Inc. | 0.01 | -5.94 | 8.60 | 21.47 | 4.7321 | 0.7245 | |||
| GOOGL / Alphabet Inc. | 0.05 | -4.07 | 8.20 | 9.33 | 4.5153 | 0.2665 | |||
| DIS / The Walt Disney Company | 0.07 | -9.72 | 8.18 | 13.43 | 4.5056 | 0.4198 | |||
| SNPS / Synopsys, Inc. | 0.01 | -3.19 | 7.52 | 15.73 | 4.1396 | 0.4601 | |||
| PG / The Procter & Gamble Company | 0.04 | -11.55 | 7.04 | -17.31 | 3.8737 | -0.9453 | |||
| TSLA / Tesla, Inc. | 0.02 | -3.82 | 5.20 | 17.88 | 2.8636 | 0.3649 | |||
| TMO / Thermo Fisher Scientific Inc. | 0.01 | -2.73 | 4.79 | -20.75 | 2.6395 | -0.7862 | |||
| OTIS / Otis Worldwide Corporation | 0.04 | -1.46 | 4.31 | -5.46 | 2.3736 | -0.2088 | |||
| META / Meta Platforms, Inc. | 0.01 | 2.07 | 4.18 | 30.74 | 2.2998 | 0.4900 | |||
| LLY / Eli Lilly and Company | 0.00 | -5.05 | 3.80 | -10.38 | 2.0912 | -0.3090 | |||
| UNH / UnitedHealth Group Incorporated | 0.01 | -1.27 | 3.48 | -41.20 | 1.9168 | -1.4361 | |||
| AMT / American Tower Corporation | 0.02 | -7.39 | 3.34 | -5.94 | 1.8393 | -0.1722 | |||
| MRK / Merck & Co., Inc. | 0.04 | -5.62 | 3.25 | -16.76 | 1.7910 | -0.4223 | |||
| WM / Waste Management, Inc. | 0.01 | -3.79 | 3.23 | -4.89 | 1.7772 | -0.1452 | |||
| CVX / Chevron Corporation | 0.02 | -0.84 | 2.62 | -15.14 | 1.4443 | -0.3061 | |||
| A / Agilent Technologies, Inc. | 0.02 | -8.28 | 2.57 | -7.46 | 1.4138 | -0.1580 | |||
| RY / Royal Bank of Canada | 0.01 | -0.54 | 1.44 | 16.13 | 0.7929 | 0.0906 | |||
| NKE / NIKE, Inc. | 0.02 | -63.67 | 1.35 | -59.34 | 0.7405 | -1.1331 | |||
| INTC / Intel Corporation | 0.05 | 0.16 | 1.15 | -1.29 | 0.6319 | -0.0261 | |||
| KEYS / Keysight Technologies, Inc. | 0.01 | 4.18 | 1.06 | 13.89 | 0.5829 | 0.0568 | |||
| TSM / Taiwan Semiconductor Manufacturing Company Limited - Depositary Receipt (Common Stock) | 0.00 | -0.10 | 0.89 | 36.41 | 0.4890 | 0.1200 | |||
| FTV / Fortive Corporation | 0.02 | -67.32 | 0.85 | -76.73 | 0.4658 | -1.5928 | |||
| PYPL / PayPal Holdings, Inc. | 0.01 | -5.51 | 0.78 | 7.71 | 0.4306 | 0.0190 | |||
| EL / The Estée Lauder Companies Inc. | 0.01 | -12.57 | 0.70 | 7.15 | 0.3877 | 0.0151 | |||
| KO / The Coca-Cola Company | 0.01 | -5.96 | 0.44 | -6.99 | 0.2417 | -0.0259 | |||
| PANW / Palo Alto Networks, Inc. | 0.00 | 0.00 | 0.39 | 19.88 | 0.2163 | 0.0308 | |||
| CM / Canadian Imperial Bank of Commerce | 0.01 | 0.00 | 0.37 | 26.10 | 0.2051 | 0.0376 | |||
| MELI / MercadoLibre, Inc. | 0.00 | 0.00 | 0.34 | 34.12 | 0.1885 | 0.0438 | |||
| RAL / Ralliant Corporation | 0.01 | 0.26 | 0.1426 | 0.1426 | |||||
| MA / Mastercard Incorporated | 0.00 | -16.06 | 0.26 | -14.00 | 0.1423 | -0.0278 | |||
| ICE / Intercontinental Exchange, Inc. | 0.00 | 0.00 | 0.21 | 6.47 | 0.1180 | 0.0039 | |||
| ORCL / Oracle Corporation | 0.00 | -17.04 | 0.21 | 29.45 | 0.1166 | 0.0242 | |||
| TD / The Toronto-Dominion Bank | 0.00 | 0.00 | 0.21 | 22.94 | 0.1152 | 0.0185 | |||
| FERG / Ferguson Enterprises Inc. | 0.00 | 0.00 | 0.18 | 36.36 | 0.0995 | 0.0242 | |||
| SBUX / Starbucks Corporation | 0.00 | 0.00 | 0.17 | -6.70 | 0.0924 | -0.0093 | |||
| ADBE / Adobe Inc. | 0.00 | -7.13 | 0.17 | -6.21 | 0.0916 | -0.0090 | |||
| XOM / Exxon Mobil Corporation | 0.00 | -8.94 | 0.16 | -17.28 | 0.0871 | -0.0214 | |||
| INTU / Intuit Inc. | 0.00 | 0.00 | 0.15 | 28.81 | 0.0837 | 0.0166 | |||
| CTAS / Cintas Corporation | 0.00 | -4.98 | 0.13 | 3.25 | 0.0703 | 0.0001 | |||
| SPY / SPDR S&P 500 ETF | 0.00 | 0.00 | 0.12 | 10.71 | 0.0687 | 0.0047 | |||
| GE / General Electric Company | 0.00 | 0.00 | 0.12 | 28.57 | 0.0646 | 0.0129 | |||
| PEP / PepsiCo, Inc. | 0.00 | 5.52 | 0.11 | -7.02 | 0.0584 | -0.0062 | |||
| PFE / Pfizer Inc. | 0.00 | -36.96 | 0.08 | -39.71 | 0.0453 | -0.0320 | |||
| MCD / McDonald's Corporation | 0.00 | -30.86 | 0.07 | -35.64 | 0.0360 | -0.0213 | |||
| BABA / Alibaba Group Holding Limited - Depositary Receipt (Common Stock) | 0.00 | 0.00 | 0.06 | -14.71 | 0.0324 | -0.0065 | |||
| JXN / Jackson Financial Inc. | 0.00 | 0.00 | 0.06 | 5.66 | 0.0313 | 0.0009 | |||
| BKNG / Booking Holdings Inc. | 0.00 | 0.00 | 0.05 | 26.83 | 0.0287 | 0.0052 | |||
| SYK / Stryker Corporation | 0.00 | 0.00 | 0.05 | 6.52 | 0.0272 | 0.0009 | |||
| VZ / Verizon Communications Inc. | 0.00 | 0.00 | 0.04 | -4.44 | 0.0242 | -0.0019 | |||
| JNJ / Johnson & Johnson | 0.00 | 0.00 | 0.04 | -8.70 | 0.0235 | -0.0028 | |||
| NFLX / Netflix, Inc. | 0.00 | 3.33 | 0.04 | 51.85 | 0.0229 | 0.0070 | |||
| CRM / Salesforce, Inc. | 0.00 | 0.04 | 0.0218 | 0.0218 | |||||
| TRI / Thomson Reuters Corporation | 0.00 | 0.00 | 0.04 | 15.15 | 0.0212 | 0.0025 | |||
| CSCO / Cisco Systems, Inc. | 0.00 | 0.03 | 0.0175 | 0.0175 | |||||
| COST / Costco Wholesale Corporation | 0.00 | 0.00 | 0.02 | 4.35 | 0.0136 | 0.0002 | |||
| HON / Honeywell International Inc. | 0.00 | -28.57 | 0.02 | -22.58 | 0.0135 | -0.0042 | |||
| MDLZ / Mondelez International, Inc. | 0.00 | 0.00 | 0.02 | 0.00 | 0.0121 | -0.0004 | |||
| IBM / International Business Machines Corporation | 0.00 | 0.02 | 0.0094 | 0.0094 | |||||
| BIIB / Biogen Inc. | 0.00 | -20.56 | 0.01 | -28.57 | 0.0059 | -0.0024 | |||
| MRNA / Moderna, Inc. | 0.00 | 0.00 | 0.00 | 0.00 | 0.0016 | -0.0001 | |||
| HBIO / Harvard Bioscience, Inc. | 0.00 | 0.00 | 0.00 | 0.00 | 0.0012 | -0.0004 | |||
| AVGO / Broadcom Inc. | 0.00 | 0.00 | 0.0003 | 0.0003 | |||||
| TKO / TKO Group Holdings, Inc. | 0.00 | 0.00 | 0.0003 | 0.0003 | |||||
| INOD / Innodata Inc. | 0.00 | 0.00 | 0.0003 | 0.0003 | |||||
| SOFI / SoFi Technologies, Inc. | 0.00 | 0.00 | 0.0003 | 0.0003 | |||||
| MBLY / Mobileye Global Inc. | 0.00 | 0.00 | 0.0002 | 0.0002 | |||||
| IONQ / IonQ, Inc. | 0.00 | 0.00 | 0.0002 | 0.0002 | |||||
| RGTI / Rigetti Computing, Inc. | 0.00 | 0.00 | 0.0002 | 0.0002 | |||||
| MRVL / Marvell Technology, Inc. | 0.00 | 0.00 | 0.0001 | 0.0001 | |||||
| GS / The Goldman Sachs Group, Inc. | 0.00 | -100.00 | 0.00 | 0.0000 |