Statistik Asas
| Profil Orang Dalam | CAISSE DES DEPOTS ET CONSIGNATIONS |
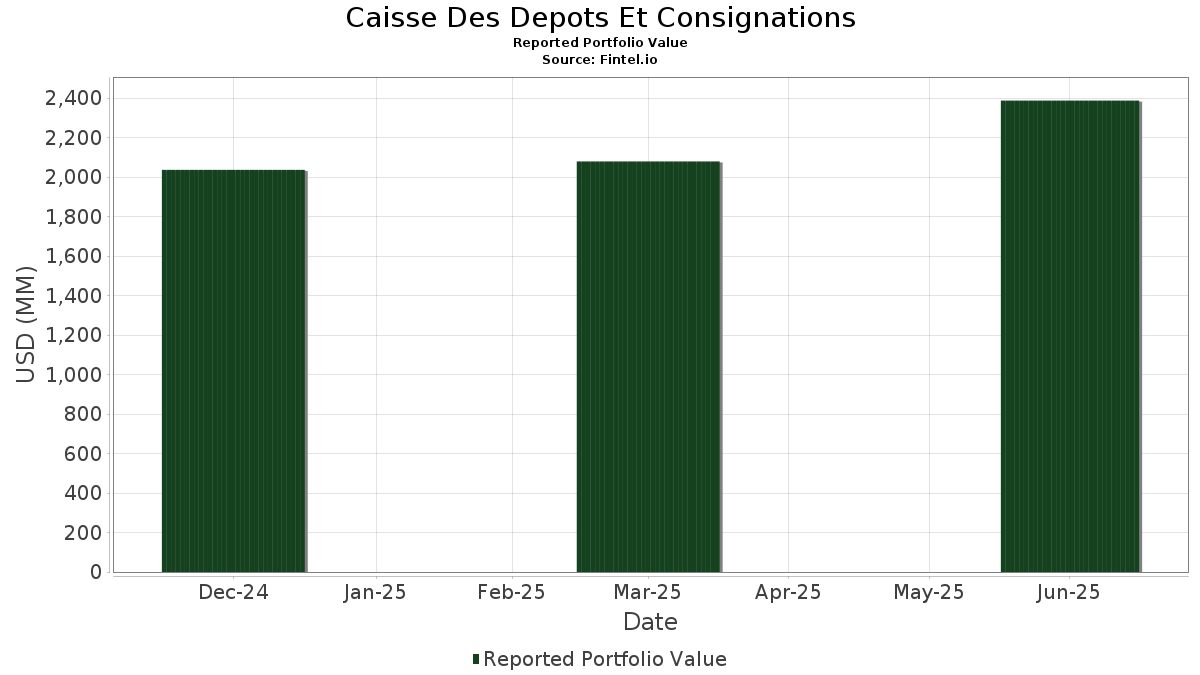
| Nilai Portfolio | $ 2,387,947,593 |
| Kedudukan Semasa | 193 |
Pegangan Terkini, Prestasi, AUM (dari 13F, 13D)
Caisse Des Depots Et Consignations telah mendedahkan 193 jumlah pegangan dalam pemfailan SEC terkini mereka. Nilai portfolio terkini dikira sebagai $ 2,387,947,593 USD. Aset Sebenar Di Bawah Pengurusan (AUM) ialah nilai ini ditambah dengan tunai (yang tidak didedahkan). Pegangan teratas Caisse Des Depots Et Consignations ialah Linde plc (US:LIN) , UBS Group AG (US:UBS) , Alcon Inc. (US:ALC) , Trane Technologies plc (US:TT) , and Amrize AG (US:AMRZ) . Kedudukan baharu Caisse Des Depots Et Consignations termasuk Amrize AG (US:AMRZ) , Palo Alto Networks, Inc. (US:PANW) , Freeport-McMoRan Inc. (US:FCX) , Snap Inc. (US:SNAP) , and Wells Fargo & Company (US:WFC) .
Kenaikan Teratas Suku Tahun Ini
Kami menggunakan perubahan dalam peruntukan portfolio kerana ini adalah metrik yang paling bermakna. Perubahan boleh disebabkan oleh perdagangan atau perubahan dalam harga saham.
| Sekuriti | Saham (MM) |
Nilai (MM$) |
Portfolio % | ΔPortfolio % |
|---|---|---|---|---|
| 1.93 | 103.16 | 4.3200 | 4.3200 | |
| 0.51 | 80.57 | 3.3500 | 0.6862 | |
| 0.31 | 135.23 | 5.6630 | 0.6544 | |
| 0.11 | 30.16 | 1.2631 | 0.3847 | |
| 0.13 | 65.76 | 2.7345 | 0.3480 | |
| 0.03 | 6.18 | 0.2589 | 0.2589 | |
| 0.12 | 5.17 | 0.2166 | 0.2166 | |
| 0.06 | 7.85 | 0.3288 | 0.2042 | |
| 0.50 | 4.37 | 0.1831 | 0.1831 | |
| 0.05 | 3.87 | 0.1622 | 0.1622 |
Penurunan Teratas Suku Tahun Ini
Kami menggunakan perubahan dalam peruntukan portfolio kerana ini adalah metrik yang paling bermakna. Perubahan boleh disebabkan oleh perdagangan atau perubahan dalam harga saham.
| Sekuriti | Saham (MM) |
Nilai (MM$) |
Portfolio % | ΔPortfolio % |
|---|---|---|---|---|
| 0.70 | 330.34 | 13.8338 | -1.9068 | |
| 2.26 | 214.44 | 8.9164 | -1.2018 | |
| 0.32 | 64.88 | 2.6977 | -0.6383 | |
| 0.19 | 69.00 | 2.8893 | -0.3883 | |
| 0.00 | 4.50 | 0.1871 | -0.2969 | |
| 0.68 | 56.78 | 2.3610 | -0.2659 | |
| 2.70 | 12.49 | 0.5192 | -0.1857 | |
| 7.92 | 286.98 | 11.9327 | -0.1776 | |
| 0.00 | 6.27 | 0.2608 | -0.1657 | |
| 0.14 | 40.42 | 1.6807 | -0.1534 |
13F dan Pemfailan Dana
Borang ini telah difailkan pada 2025-07-31 untuk tempoh pelaporan 2025-06-30. Klik ikon pautan untuk melihat sejarah transaksi penuh.
Tingkatkan untuk membuka data premium dan eksport ke Excel ![]() .
.
| Sekuriti | Jenis | Purata Harga Saham | Saham (MM) |
ΔSaham (%) |
ΔSaham (%) |
Nilai ($MM) |
Portfolio (%) |
ΔPortfolio (%) |
|
|---|---|---|---|---|---|---|---|---|---|
| LIN / Linde plc | 0.70 | 0.15 | 330.34 | 0.91 | 13.8338 | -1.9068 | |||
| UBS / UBS Group AG | 7.92 | 0.00 | 286.98 | 13.95 | 11.9327 | -0.1776 | |||
| ALC / Alcon Inc. | 2.26 | 5.94 | 214.44 | 1.91 | 8.9164 | -1.2018 | |||
| TT / Trane Technologies plc | 0.31 | 0.00 | 135.23 | 29.83 | 5.6630 | 0.6544 | |||
| AMRZ / Amrize AG | 1.93 | 103.16 | 4.3200 | 4.3200 | |||||
| NVDA / NVIDIA Corporation | 0.51 | -0.23 | 80.57 | 45.43 | 3.3500 | 0.6862 | |||
| V / Visa Inc. | 0.19 | 0.09 | 69.00 | 1.22 | 2.8893 | -0.3883 | |||
| MSFT / Microsoft Corporation | 0.13 | 0.00 | 65.76 | 32.51 | 2.7345 | 0.3480 | |||
| AAPL / Apple Inc. | 0.32 | 1.25 | 64.88 | -6.48 | 2.6977 | -0.6383 | |||
| QGEN / Qiagen N.V. | 1.35 | 0.00 | 64.48 | 20.81 | 2.7002 | 0.1337 | |||
| IR / Ingersoll Rand Inc. | 0.68 | 0.00 | 56.78 | 3.94 | 2.3610 | -0.2659 | |||
| AMZN / Amazon.com, Inc. | 0.20 | 0.00 | 44.06 | 15.31 | 1.8318 | -0.0053 | |||
| ACN / Accenture plc | 0.14 | 10.63 | 40.42 | 5.97 | 1.6807 | -0.1534 | |||
| AVGO / Broadcom Inc. | 0.11 | 0.29 | 30.16 | 65.12 | 1.2631 | 0.3847 | |||
| META / Meta Platforms, Inc. | 0.03 | 1.05 | 25.12 | 29.41 | 1.0446 | 0.1111 | |||
| GOOGL / Alphabet Inc. | 0.14 | 0.00 | 24.53 | 13.96 | 1.0199 | -0.0150 | |||
| TSLA / Tesla, Inc. | 0.06 | 2.19 | 20.59 | 25.26 | 0.8621 | 0.0718 | |||
| JPM / JPMorgan Chase & Co. | 0.07 | 0.00 | 20.46 | 18.19 | 0.8570 | 0.0244 | |||
| GOOG / Alphabet Inc. | 0.09 | -7.11 | 16.52 | 5.47 | 0.6868 | -0.0663 | |||
| EL / The Estée Lauder Companies Inc. | 0.20 | 0.00 | 16.37 | 22.43 | 0.6805 | 0.0377 | |||
| WMT / Walmart Inc. | 0.14 | 0.36 | 13.68 | 11.79 | 0.5728 | -0.0156 | |||
| ORCL / Oracle Corporation | 0.06 | -3.02 | 13.40 | 51.66 | 0.5610 | 0.1362 | |||
| MU / Micron Technology, Inc. | 0.11 | 0.00 | 13.22 | 41.85 | 0.5498 | 0.1016 | |||
| EWT / iShares, Inc. - iShares MSCI Taiwan ETF | 0.23 | 0.00 | 12.85 | 19.87 | 0.5344 | 0.0188 | |||
| COTY / Coty Inc. | 2.70 | 0.00 | 12.49 | -14.82 | 0.5192 | -0.1857 | |||
| BAC / Bank of America Corporation | 0.26 | 2.08 | 12.39 | 15.76 | 0.5151 | 0.0005 | |||
| EWY / iShares, Inc. - iShares MSCI South Korea ETF | 0.16 | 0.00 | 11.61 | 32.18 | 0.4827 | 0.0604 | |||
| CSCO / Cisco Systems, Inc. | 0.16 | -1.09 | 11.25 | 11.20 | 0.4677 | -0.0187 | |||
| MA / Mastercard Incorporated | 0.02 | -1.08 | 11.18 | 1.41 | 0.4649 | -0.0653 | |||
| ABBV / AbbVie Inc. | 0.06 | 3.44 | 11.02 | -8.35 | 0.4584 | -0.1201 | |||
| KO / The Coca-Cola Company | 0.16 | -0.60 | 11.02 | -1.80 | 0.4582 | -0.0814 | |||
| GE / General Electric Company | 0.04 | -9.86 | 10.77 | 15.93 | 0.4480 | 0.0011 | |||
| PG / The Procter & Gamble Company | 0.06 | 5.89 | 10.17 | -1.00 | 0.4227 | -0.0711 | |||
| JNJ / Johnson & Johnson | 0.07 | 0.61 | 10.06 | -7.33 | 0.4181 | -0.1037 | |||
| IBM / International Business Machines Corporation | 0.03 | 0.00 | 10.05 | 18.55 | 0.4208 | 0.0132 | |||
| CRM / Salesforce, Inc. | 0.04 | 13.64 | 9.86 | 15.47 | 0.4129 | 0.0023 | |||
| HD / The Home Depot, Inc. | 0.03 | 7.73 | 9.69 | 7.77 | 0.4059 | -0.0266 | |||
| RTX / RTX Corporation | 0.07 | -5.85 | 9.64 | 3.79 | 0.4007 | -0.0458 | |||
| T / AT&T Inc. | 0.31 | -9.36 | 9.08 | -7.25 | 0.3801 | -0.0904 | |||
| UBER / Uber Technologies, Inc. | 0.10 | 4.88 | 8.91 | 34.30 | 0.3706 | 0.0515 | |||
| SCHW / The Charles Schwab Corporation | 0.10 | 23.46 | 8.68 | 43.89 | 0.3609 | 0.0709 | |||
| MS / Morgan Stanley | 0.06 | 0.00 | 8.60 | 20.73 | 0.3575 | 0.0151 | |||
| BSX / Boston Scientific Corporation | 0.08 | -2.05 | 8.53 | 4.28 | 0.3547 | -0.0386 | |||
| PGR / The Progressive Corporation | 0.03 | 33.00 | 8.44 | 25.40 | 0.3510 | 0.0273 | |||
| GILD / Gilead Sciences, Inc. | 0.07 | -2.17 | 8.15 | -3.21 | 0.3391 | -0.0660 | |||
| PFE / Pfizer Inc. | 0.33 | 11.32 | 8.09 | 6.48 | 0.3362 | -0.0289 | |||
| AMD / Advanced Micro Devices, Inc. | 0.06 | 119.38 | 7.85 | 203.09 | 0.3288 | 0.2042 | |||
| NEE / NextEra Energy, Inc. | 0.11 | -0.07 | 7.77 | -2.14 | 0.3253 | -0.0564 | |||
| NOW / ServiceNow, Inc. | 0.01 | 0.00 | 7.42 | 29.14 | 0.3087 | 0.0322 | |||
| ADP / Automatic Data Processing, Inc. | 0.02 | -5.07 | 7.15 | -4.18 | 0.2974 | -0.0615 | |||
| ADBE / Adobe Inc. | 0.02 | 27.91 | 7.11 | 29.02 | 0.2956 | 0.0307 | |||
| LLY / Eli Lilly and Company | 0.01 | -9.28 | 7.03 | -14.38 | 0.2925 | -0.1025 | |||
| CMG / Chipotle Mexican Grill, Inc. | 0.12 | 13.59 | 6.92 | 27.03 | 0.2877 | 0.0258 | |||
| BK / The Bank of New York Mellon Corporation | 0.08 | -5.84 | 6.85 | 2.30 | 0.2850 | -0.0372 | |||
| CSX / CSX Corporation | 0.21 | 2.76 | 6.72 | 13.93 | 0.2812 | -0.0022 | |||
| CRH / CRH plc | 0.07 | 27.03 | 6.65 | 32.55 | 0.2784 | 0.0372 | |||
| JCI / Johnson Controls International plc | 0.06 | 3.65 | 6.55 | 36.66 | 0.2725 | 0.0419 | |||
| LRCX / Lam Research Corporation | 0.07 | 0.00 | 6.44 | 33.90 | 0.2676 | 0.0365 | |||
| CMCSA / Comcast Corporation | 0.18 | 0.00 | 6.42 | -3.27 | 0.2669 | -0.0522 | |||
| HON / Honeywell International Inc. | 0.03 | 0.00 | 6.34 | 9.99 | 0.2637 | -0.0136 | |||
| NFLX / Netflix, Inc. | 0.00 | -50.76 | 6.27 | -29.29 | 0.2608 | -0.1657 | |||
| HBAN / Huntington Bancshares Incorporated | 0.37 | 6.58 | 6.21 | 19.02 | 0.2583 | 0.0073 | |||
| PANW / Palo Alto Networks, Inc. | 0.03 | 6.18 | 0.2589 | 0.2589 | |||||
| EQH / Equitable Holdings, Inc. | 0.11 | 4.45 | 6.17 | 12.48 | 0.2564 | -0.0072 | |||
| KDP / Keurig Dr Pepper Inc. | 0.18 | -3.37 | 6.09 | -6.64 | 0.2548 | -0.0586 | |||
| MRK / Merck & Co., Inc. | 0.08 | 0.00 | 6.01 | -11.80 | 0.2498 | -0.0778 | |||
| ROL / Rollins, Inc. | 0.10 | -7.82 | 5.89 | -3.74 | 0.2448 | -0.0493 | |||
| INTC / Intel Corporation | 0.26 | 22.05 | 5.86 | 20.38 | 0.2437 | 0.0096 | |||
| MDT / Medtronic plc | 0.07 | 8.92 | 5.79 | 5.67 | 0.2409 | -0.0228 | |||
| CAH / Cardinal Health, Inc. | 0.03 | -18.06 | 5.69 | -0.09 | 0.2365 | -0.0372 | |||
| SBUX / Starbucks Corporation | 0.06 | 14.88 | 5.69 | 7.32 | 0.2381 | -0.0167 | |||
| KKR / KKR & Co. Inc. | 0.04 | 133.87 | 5.62 | 169.12 | 0.2338 | 0.1333 | |||
| CNH / CNH Industrial N.V. | 0.43 | -2.08 | 5.57 | 3.34 | 0.2314 | -0.0275 | |||
| OTIS / Otis Worldwide Corporation | 0.06 | 28.83 | 5.48 | 23.63 | 0.2278 | 0.0147 | |||
| MNST / Monster Beverage Corporation | 0.09 | 17.57 | 5.40 | 25.86 | 0.2244 | 0.0182 | |||
| EW / Edwards Lifesciences Corporation | 0.07 | -5.30 | 5.35 | 2.18 | 0.2224 | -0.0293 | |||
| FAST / Fastenal Company | 0.13 | 101.44 | 5.27 | 9.09 | 0.2192 | -0.0132 | |||
| FCX / Freeport-McMoRan Inc. | 0.12 | 5.17 | 0.2166 | 0.2166 | |||||
| KVUE / Kenvue Inc. | 0.24 | 3.82 | 5.07 | -9.39 | 0.2122 | -0.0567 | |||
| CPRT / Copart, Inc. | 0.10 | 0.00 | 4.82 | -13.30 | 0.2003 | -0.0668 | |||
| DHR / Danaher Corporation | 0.02 | 0.00 | 4.74 | -3.64 | 0.1983 | -0.0380 | |||
| WY / Weyerhaeuser Company | 0.18 | 0.00 | 4.73 | -12.25 | 0.1965 | -0.0625 | |||
| ECL / Ecolab Inc. | 0.02 | 0.00 | 4.59 | 6.27 | 0.1910 | -0.0168 | |||
| NVR / NVR, Inc. | 0.00 | 160.08 | 4.57 | 165.14 | 0.1914 | 0.1085 | |||
| EA / Electronic Arts Inc. | 0.03 | 0.00 | 4.52 | 10.49 | 0.1892 | -0.0074 | |||
| COST / Costco Wholesale Corporation | 0.00 | -57.30 | 4.50 | -55.30 | 0.1871 | -0.2969 | |||
| EXPD / Expeditors International of Washington, Inc. | 0.04 | -3.95 | 4.44 | -8.76 | 0.1846 | -0.0493 | |||
| SNAP / Snap Inc. | 0.50 | 4.37 | 0.1831 | 0.1831 | |||||
| ADSK / Autodesk, Inc. | 0.01 | 0.00 | 4.17 | 18.25 | 0.1732 | 0.0038 | |||
| EXC / Exelon Corporation | 0.09 | -16.76 | 4.11 | -21.57 | 0.1710 | -0.0811 | |||
| ICE / Intercontinental Exchange, Inc. | 0.02 | 0.00 | 4.11 | 6.34 | 0.1709 | -0.0149 | |||
| CVS / CVS Health Corporation | 0.06 | 0.00 | 4.04 | 1.81 | 0.1681 | -0.0228 | |||
| WFC / Wells Fargo & Company | 0.05 | 3.87 | 0.1622 | 0.1622 | |||||
| CARR / Carrier Global Corporation | 0.05 | 0.00 | 3.85 | 15.43 | 0.1613 | 0.0009 | |||
| BWXT / BWX Technologies, Inc. | 0.03 | 0.00 | 3.82 | 46.02 | 0.1587 | 0.0330 | |||
| JXN / Jackson Financial Inc. | 0.04 | 0.00 | 3.80 | 5.99 | 0.1582 | -0.0144 | |||
| CNC / Centene Corporation | 0.07 | -30.86 | 3.72 | -38.19 | 0.1545 | -0.1345 | |||
| PCAR / PACCAR Inc | 0.04 | 0.00 | 3.69 | -2.36 | 0.1543 | -0.0272 | |||
| GEV / GE Vernova Inc. | 0.01 | 3.61 | 0.1512 | 0.1512 | |||||
| MDLZ / Mondelez International, Inc. | 0.05 | 0.55 | 3.59 | -0.06 | 0.1491 | -0.0234 | |||
| HUM / Humana Inc. | 0.01 | 3.32 | 0.1392 | 0.1392 | |||||
| SYF / Synchrony Financial | 0.05 | -26.11 | 3.26 | -6.85 | 0.1357 | -0.0328 | |||
| MOH / Molina Healthcare, Inc. | 0.01 | -4.68 | 3.25 | -13.78 | 0.1351 | -0.0461 | |||
| DOC / Healthpeak Properties, Inc. | 0.19 | 146.86 | 3.24 | 113.84 | 0.1349 | 0.0619 | |||
| CCI / Crown Castle Inc. | 0.03 | 18.87 | 2.94 | 17.16 | 0.1233 | 0.0025 | |||
| ORI / Old Republic International Corporation | 0.08 | -4.46 | 2.91 | -6.37 | 0.1211 | -0.0285 | |||
| CBRE / CBRE Group, Inc. | 0.02 | 0.00 | 2.91 | 7.14 | 0.1219 | -0.0087 | |||
| CL / Colgate-Palmolive Company | 0.03 | 0.00 | 2.83 | -2.99 | 0.1176 | -0.0226 | |||
| O / Realty Income Corporation | 0.05 | 2.79 | 0.1161 | 0.1161 | |||||
| BMY / Bristol-Myers Squibb Company | 0.06 | 0.00 | 2.66 | -24.10 | 0.1106 | -0.0579 | |||
| BKNG / Booking Holdings Inc. | 0.00 | 0.00 | 2.62 | 25.70 | 0.1090 | 0.0087 | |||
| AMAT / Applied Materials, Inc. | 0.01 | -16.07 | 2.55 | 5.90 | 0.1059 | -0.0098 | |||
| HEI / HEICO Corporation | 0.01 | 2.53 | 0.1060 | 0.1060 | |||||
| APH / Amphenol Corporation | 0.02 | 351.88 | 2.42 | 580.28 | 0.1005 | 0.0834 | |||
| HST / Host Hotels & Resorts, Inc. | 0.16 | 28.64 | 2.40 | 39.01 | 0.1004 | 0.0175 | |||
| AMT / American Tower Corporation | 0.01 | 135.56 | 2.31 | 139.36 | 0.0959 | 0.0495 | |||
| FTV / Fortive Corporation | 0.04 | 0.00 | 2.25 | -28.76 | 0.0937 | -0.0584 | |||
| ALHC / Alignment Healthcare, Inc. | 0.16 | -20.16 | 2.23 | -39.98 | 0.0927 | -0.0859 | |||
| LNC / Lincoln National Corporation | 0.06 | -45.97 | 2.10 | -47.94 | 0.0878 | -0.1059 | |||
| ABT / Abbott Laboratories | 0.02 | 0.00 | 2.07 | 2.53 | 0.0865 | -0.0104 | |||
| DOW / Dow Inc. | 0.07 | 38.35 | 1.88 | 4.86 | 0.0780 | -0.0080 | |||
| PNR / Pentair plc | 0.02 | 0.00 | 1.73 | 17.37 | 0.0725 | 0.0016 | |||
| HPE / Hewlett Packard Enterprise Company | 0.08 | -19.71 | 1.72 | 6.43 | 0.0716 | -0.0062 | |||
| K / Kellanova | 0.02 | 0.00 | 1.71 | -3.60 | 0.0712 | -0.0142 | |||
| SOFI / SoFi Technologies, Inc. | 0.09 | 1.61 | 0.0668 | 0.0668 | |||||
| DVA / DaVita Inc. | 0.01 | 0.00 | 1.60 | -6.86 | 0.0666 | -0.0161 | |||
| WBA / Walgreens Boots Alliance, Inc. | 0.13 | 1.49 | 0.0624 | 0.0624 | |||||
| STT / State Street Corporation | 0.01 | 0.00 | 1.29 | 18.73 | 0.0538 | 0.0014 | |||
| ADT / ADT Inc. | 0.15 | -25.26 | 1.29 | -22.22 | 0.0536 | -0.0261 | |||
| TFC / Truist Financial Corporation | 0.03 | 0.00 | 1.24 | 4.47 | 0.0516 | -0.0055 | |||
| WSM / Williams-Sonoma, Inc. | 0.01 | 0.00 | 1.24 | 3.25 | 0.0515 | -0.0061 | |||
| MMM / 3M Company | 0.01 | 0.00 | 1.23 | 3.63 | 0.0514 | -0.0055 | |||
| RIVN / Rivian Automotive, Inc. | 0.09 | -60.40 | 1.23 | -56.31 | 0.0510 | -0.0840 | |||
| PHM / PulteGroup, Inc. | 0.01 | 0.00 | 1.20 | 2.66 | 0.0497 | -0.0063 | |||
| CNM / Core & Main, Inc. | 0.02 | 0.00 | 1.18 | 24.89 | 0.0492 | 0.0037 | |||
| HLT / Hilton Worldwide Holdings Inc. | 0.00 | 0.00 | 1.18 | 17.13 | 0.0493 | 0.0009 | |||
| FTNT / Fortinet, Inc. | 0.01 | 0.00 | 1.15 | 9.86 | 0.0478 | -0.0025 | |||
| ITW / Illinois Tool Works Inc. | 0.00 | 0.00 | 1.14 | -0.35 | 0.0475 | -0.0076 | |||
| CWEN / Clearway Energy, Inc. | 0.03 | 0.00 | 1.12 | 5.77 | 0.0465 | -0.0044 | |||
| LAUR / Laureate Education, Inc. | 0.05 | -41.15 | 1.09 | -32.74 | 0.0453 | -0.0326 | |||
| DIS / The Walt Disney Company | 0.01 | 0.00 | 1.08 | 25.76 | 0.0449 | 0.0036 | |||
| BHF / Brighthouse Financial, Inc. | 0.02 | -68.32 | 1.04 | -70.64 | 0.0431 | -0.1267 | |||
| IBP / Installed Building Products, Inc. | 0.01 | 0.97 | 0.0408 | 0.0408 | |||||
| PLD / Prologis, Inc. | 0.01 | 0.97 | 0.0405 | 0.0405 | |||||
| ELV / Elevance Health, Inc. | 0.00 | -25.58 | 0.97 | -33.47 | 0.0402 | -0.0296 | |||
| WRB / W. R. Berkley Corporation | 0.01 | 0.00 | 0.96 | 3.22 | 0.0400 | -0.0048 | |||
| USB / U.S. Bancorp | 0.02 | 0.00 | 0.96 | 7.15 | 0.0399 | -0.0032 | |||
| FERG / Ferguson Enterprises Inc. | 0.00 | 0.88 | 0.0368 | 0.0368 | |||||
| CDNS / Cadence Design Systems, Inc. | 0.00 | 0.00 | 0.86 | 21.18 | 0.0359 | 0.0016 | |||
| QCOM / QUALCOMM Incorporated | 0.01 | -77.30 | 0.86 | -76.47 | 0.0359 | -0.1404 | |||
| ADM / Archer-Daniels-Midland Company | 0.02 | 0.00 | 0.82 | 9.99 | 0.0341 | -0.0015 | |||
| DD / DuPont de Nemours, Inc. | 0.01 | 0.00 | 0.81 | -8.16 | 0.0337 | -0.0087 | |||
| BCC / Boise Cascade Company | 0.01 | 0.00 | 0.80 | -11.50 | 0.0333 | -0.0102 | |||
| PCG / PG&E Corporation | 0.06 | -9.58 | 0.79 | -26.67 | 0.0328 | -0.0189 | |||
| EMR / Emerson Electric Co. | 0.01 | 0.00 | 0.78 | 21.62 | 0.0328 | 0.0018 | |||
| CME / CME Group Inc. | 0.00 | 0.78 | 0.0327 | 0.0327 | |||||
| SIRI / Sirius XM Holdings Inc. | 0.03 | 0.00 | 0.75 | 1.91 | 0.0310 | -0.0042 | |||
| WOR / Worthington Enterprises, Inc. | 0.01 | 0.00 | 0.74 | 27.02 | 0.0307 | 0.0028 | |||
| ACGL / Arch Capital Group Ltd. | 0.01 | 0.73 | 0.0304 | 0.0304 | |||||
| INTU / Intuit Inc. | 0.00 | 0.00 | 0.70 | 28.15 | 0.0292 | 0.0029 | |||
| RAL / Ralliant Corporation | 0.01 | 0.70 | 0.0293 | 0.0293 | |||||
| STWD / Starwood Property Trust, Inc. | 0.03 | 0.00 | 0.68 | 1.50 | 0.0281 | -0.0039 | |||
| IDXX / IDEXX Laboratories, Inc. | 0.00 | -15.64 | 0.65 | 7.86 | 0.0268 | -0.0020 | |||
| BFB / Brown-Forman Corp. - Class B | 0.02 | 35.72 | 0.64 | 7.54 | 0.0267 | -0.0020 | |||
| DCI / Donaldson Company, Inc. | 0.01 | 0.00 | 0.64 | 3.41 | 0.0265 | -0.0031 | |||
| SBRA / Sabra Health Care REIT, Inc. | 0.03 | 0.00 | 0.62 | 5.49 | 0.0258 | -0.0023 | |||
| AMGN / Amgen Inc. | 0.00 | 0.00 | 0.58 | -10.32 | 0.0242 | -0.0070 | |||
| CI / The Cigna Group | 0.00 | 0.00 | 0.58 | 0.35 | 0.0242 | -0.0036 | |||
| TRV / The Travelers Companies, Inc. | 0.00 | 0.00 | 0.56 | 1.27 | 0.0233 | -0.0033 | |||
| HROW / Harrow, Inc. | 0.02 | 9.86 | 0.54 | 26.18 | 0.0223 | 0.0018 | |||
| MRC / MRC Global Inc. | 0.04 | -18.11 | 0.53 | -2.21 | 0.0221 | -0.0040 | |||
| AFG / American Financial Group, Inc. | 0.00 | -50.31 | 0.51 | -52.25 | 0.0212 | -0.0301 | |||
| UNIT / Unity Group LLC | 0.12 | 0.00 | 0.51 | -14.24 | 0.0211 | -0.0074 | |||
| TXN / Texas Instruments Incorporated | 0.00 | 0.00 | 0.50 | 15.67 | 0.0210 | 0.0001 | |||
| ABNB / Airbnb, Inc. | 0.00 | 0.49 | 0.0204 | 0.0204 | |||||
| ODFL / Old Dominion Freight Line, Inc. | 0.00 | 0.00 | 0.43 | -1.84 | 0.0178 | -0.0032 | |||
| LSTR / Landstar System, Inc. | 0.00 | -47.96 | 0.43 | -51.92 | 0.0177 | -0.0248 | |||
| LYB / LyondellBasell Industries N.V. | 0.01 | 0.00 | 0.39 | -17.95 | 0.0164 | -0.0067 | |||
| HPQ / HP Inc. | 0.02 | 0.00 | 0.38 | -11.52 | 0.0161 | -0.0048 | |||
| CXM / Sprinklr, Inc. | 0.04 | -65.52 | 0.38 | -65.08 | 0.0156 | -0.0361 | |||
| F / Ford Motor Company | 0.03 | 0.00 | 0.33 | 8.09 | 0.0140 | -0.0009 | |||
| VMC / Vulcan Materials Company | 0.00 | 0.30 | 0.0126 | 0.0126 | |||||
| ZTS / Zoetis Inc. | 0.00 | 0.00 | 0.28 | -5.15 | 0.0116 | -0.0025 | |||
| VFC / V.F. Corporation | 0.02 | -15.62 | 0.26 | -36.17 | 0.0110 | -0.0089 | |||
| C / Citigroup Inc. | 0.00 | 0.00 | 0.25 | 19.71 | 0.0104 | 0.0004 | |||
| PEP / PepsiCo, Inc. | 0.00 | 0.00 | 0.22 | -11.90 | 0.0092 | -0.0029 | |||
| ALLY / Ally Financial Inc. | 0.01 | 0.00 | 0.22 | 6.73 | 0.0092 | -0.0008 | |||
| BXC / BlueLinx Holdings Inc. | 0.00 | -67.32 | 0.21 | -67.58 | 0.0089 | -0.0227 | |||
| HQY / HealthEquity, Inc. | 0.00 | -88.51 | 0.21 | -86.39 | 0.0087 | -0.0648 | |||
| CRCT / Cricut, Inc. | 0.02 | 0.00 | 0.17 | 32.03 | 0.0071 | 0.0009 | |||
| HPP / Hudson Pacific Properties, Inc. | 0.06 | 0.17 | 0.0070 | 0.0070 | |||||
| GMRE / Global Medical REIT Inc. | 0.01 | 0.00 | 0.09 | -21.24 | 0.0037 | -0.0017 | |||
| AHH / Armada Hoffler Properties, Inc. | 0.01 | 0.00 | 0.07 | -8.75 | 0.0031 | -0.0008 | |||
| RKT / Rocket Companies, Inc. | 0.00 | -100.00 | 0.00 | 0.0000 | |||||
| KHC / The Kraft Heinz Company | 0.00 | -100.00 | 0.00 | 0.0000 | |||||
| LOW / Lowe's Companies, Inc. | 0.00 | -100.00 | 0.00 | 0.0000 | |||||
| AME / AMETEK, Inc. | 0.00 | -100.00 | 0.00 | 0.0000 | |||||
| OC / Owens Corning | 0.00 | -100.00 | 0.00 | 0.0000 | |||||
| DBX / Dropbox, Inc. | 0.00 | -100.00 | 0.00 | 0.0000 | |||||
| SPG / Simon Property Group, Inc. | 0.00 | -100.00 | 0.00 | 0.0000 | |||||
| KRO / Kronos Worldwide, Inc. | 0.00 | -100.00 | 0.00 | 0.0000 | |||||
| ALSN / Allison Transmission Holdings, Inc. | 0.00 | -100.00 | 0.00 | 0.0000 | |||||
| CVNA / Carvana Co. | 0.00 | -100.00 | 0.00 | 0.0000 | |||||
| GEHC / GE HealthCare Technologies Inc. | 0.00 | -100.00 | 0.00 | 0.0000 | |||||
| BRK.B / Berkshire Hathaway Inc. | 0.00 | -100.00 | 0.00 | 0.0000 | |||||
| RPM / RPM International Inc. | 0.00 | -100.00 | 0.00 | 0.0000 | |||||
| CABO / Cable One, Inc. | 0.00 | -100.00 | 0.00 | 0.0000 | |||||
| HWM / Howmet Aerospace Inc. | 0.00 | -100.00 | 0.00 | 0.0000 | |||||
| MANH / Manhattan Associates, Inc. | 0.00 | -100.00 | 0.00 | 0.0000 | |||||
| BX / Blackstone Inc. | 0.00 | -100.00 | 0.00 | 0.0000 | |||||
| COUR / Coursera, Inc. | 0.00 | -100.00 | 0.00 | 0.0000 | |||||
| CTRE / CareTrust REIT, Inc. | 0.00 | -100.00 | 0.00 | 0.0000 | |||||
| CLX / The Clorox Company | 0.00 | -100.00 | 0.00 | 0.0000 | |||||
| MET / MetLife, Inc. | 0.00 | -100.00 | 0.00 | 0.0000 | |||||
| VZ / Verizon Communications Inc. | 0.00 | -100.00 | 0.00 | 0.0000 | |||||
| NKE / NIKE, Inc. | 0.00 | -100.00 | 0.00 | 0.0000 | |||||
| PECO / Phillips Edison & Company, Inc. | 0.00 | -100.00 | 0.00 | 0.0000 | |||||
| AYI / Acuity Inc. | 0.00 | -100.00 | 0.00 | 0.0000 | |||||
| HOLX / Hologic, Inc. | 0.00 | -100.00 | 0.00 | 0.0000 | |||||
| PEG / Public Service Enterprise Group Incorporated | 0.00 | -100.00 | 0.00 | 0.0000 | |||||
| MSTR / Strategy Inc | 0.00 | -100.00 | 0.00 | 0.0000 | |||||
| VLTO / Veralto Corporation | 0.00 | -100.00 | 0.00 | 0.0000 | |||||
| BSY / Bentley Systems, Incorporated | 0.00 | -100.00 | 0.00 | 0.0000 | |||||
| RDDT / Reddit, Inc. | 0.00 | -100.00 | 0.00 | 0.0000 |