Statistik Asas
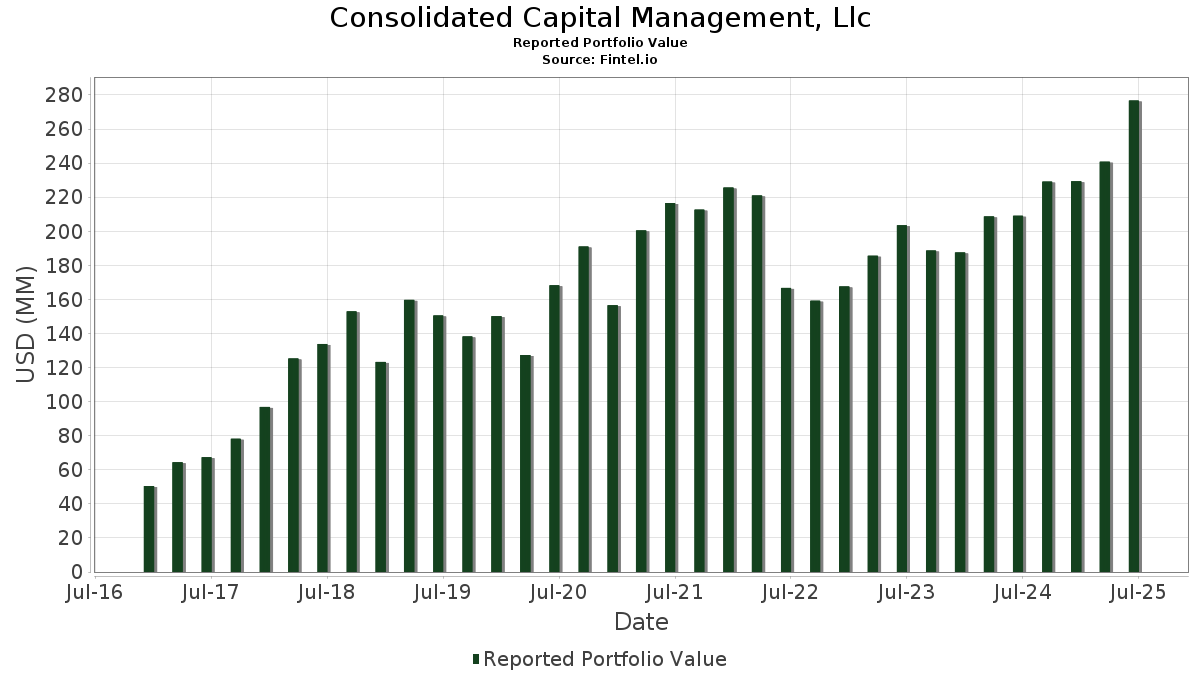
| Nilai Portfolio | $ 276,716,887 |
| Kedudukan Semasa | 48 |
Pegangan Terkini, Prestasi, AUM (dari 13F, 13D)
Consolidated Capital Management, Llc telah mendedahkan 48 jumlah pegangan dalam pemfailan SEC terkini mereka. Nilai portfolio terkini dikira sebagai $ 276,716,887 USD. Aset Sebenar Di Bawah Pengurusan (AUM) ialah nilai ini ditambah dengan tunai (yang tidak didedahkan). Pegangan teratas Consolidated Capital Management, Llc ialah Invesco Exchange-Traded Fund Trust - Invesco S&P 500 Equal Weight ETF (US:RSP) , Vanguard Specialized Funds - Vanguard Dividend Appreciation ETF (US:VIG) , SPDR Gold Trust (US:GLD) , Microsoft Corporation (US:MSFT) , and Amazon.com, Inc. (US:AMZN) . Kedudukan baharu Consolidated Capital Management, Llc termasuk Cloudflare, Inc. (US:NET) , .
Kenaikan Teratas Suku Tahun Ini
Kami menggunakan perubahan dalam peruntukan portfolio kerana ini adalah metrik yang paling bermakna. Perubahan boleh disebabkan oleh perdagangan atau perubahan dalam harga saham.
| Sekuriti | Saham (MM) |
Nilai (MM$) |
Portfolio % | ΔPortfolio % |
|---|---|---|---|---|
| 0.05 | 8.65 | 3.1247 | 1.1381 | |
| 0.03 | 8.13 | 2.9396 | 1.0967 | |
| 0.02 | 14.42 | 5.2129 | 1.0345 | |
| 0.04 | 17.88 | 6.4611 | 0.9834 | |
| 0.04 | 9.59 | 3.4664 | 0.6052 | |
| 0.02 | 5.06 | 1.8283 | 0.4471 | |
| 0.07 | 15.49 | 5.5990 | 0.3894 | |
| 0.06 | 7.71 | 2.7852 | 0.3514 | |
| 0.01 | 4.41 | 1.5927 | 0.1896 | |
| 0.02 | 6.29 | 2.2729 | 0.1254 |
Penurunan Teratas Suku Tahun Ini
Kami menggunakan perubahan dalam peruntukan portfolio kerana ini adalah metrik yang paling bermakna. Perubahan boleh disebabkan oleh perdagangan atau perubahan dalam harga saham.
| Sekuriti | Saham (MM) |
Nilai (MM$) |
Portfolio % | ΔPortfolio % |
|---|---|---|---|---|
| 0.27 | 14.97 | 5.4108 | -1.1148 | |
| 0.06 | 17.94 | 6.4834 | -1.0915 | |
| 0.06 | 12.40 | 4.4819 | -0.7121 | |
| 0.02 | 7.31 | 2.6409 | -0.6817 | |
| 0.02 | 4.55 | 1.6444 | -0.4277 | |
| 0.06 | 11.63 | 4.2019 | -0.4262 | |
| 0.01 | 8.51 | 3.0769 | -0.4195 | |
| 0.02 | 8.83 | 3.1926 | -0.4071 | |
| 0.03 | 5.10 | 1.8442 | -0.3231 | |
| 0.01 | 6.46 | 2.3353 | -0.2965 |
13F dan Pemfailan Dana
Borang ini telah difailkan pada 2025-07-17 untuk tempoh pelaporan 2025-06-30. Klik ikon pautan untuk melihat sejarah transaksi penuh.
Tingkatkan untuk membuka data premium dan eksport ke Excel ![]() .
.
| Sekuriti | Jenis | Purata Harga Saham | Saham (MM) |
ΔSaham (%) |
ΔSaham (%) |
Nilai ($MM) |
Portfolio (%) |
ΔPortfolio (%) |
|
|---|---|---|---|---|---|---|---|---|---|
| RSP / Invesco Exchange-Traded Fund Trust - Invesco S&P 500 Equal Weight ETF | 0.13 | 6.34 | 22.74 | 11.56 | 8.2196 | -0.2466 | |||
| VIG / Vanguard Specialized Funds - Vanguard Dividend Appreciation ETF | 0.11 | 6.16 | 22.52 | 12.01 | 8.1385 | -0.2108 | |||
| GLD / SPDR Gold Trust | 0.06 | -7.04 | 17.94 | -1.65 | 6.4834 | -1.0915 | |||
| MSFT / Microsoft Corporation | 0.04 | 2.29 | 17.88 | 35.53 | 6.4611 | 0.9834 | |||
| AMZN / Amazon.com, Inc. | 0.07 | 7.10 | 15.49 | 23.50 | 5.5990 | 0.3894 | |||
| IYH / iShares Trust - iShares U.S. Healthcare ETF | 0.27 | 2.72 | 14.97 | -4.72 | 5.4108 | -1.1148 | |||
| META / Meta Platforms, Inc. | 0.02 | 11.95 | 14.42 | 43.35 | 5.2129 | 1.0345 | |||
| VDC / Vanguard World Fund - Vanguard Consumer Staples ETF | 0.06 | -0.93 | 12.40 | -0.85 | 4.4819 | -0.7121 | |||
| AAPL / Apple Inc. | 0.06 | 12.95 | 11.63 | 4.32 | 4.2019 | -0.4262 | |||
| GE / General Electric Company | 0.04 | 8.25 | 9.59 | 39.22 | 3.4664 | 0.6052 | |||
| V / Visa Inc. | 0.02 | 0.60 | 8.83 | 1.92 | 3.1926 | -0.4071 | |||
| NVDA / NVIDIA Corporation | 0.05 | 23.98 | 8.65 | 80.73 | 3.1247 | 1.1381 | |||
| COST / Costco Wholesale Corporation | 0.01 | -3.39 | 8.51 | 1.12 | 3.0769 | -0.4195 | |||
| CEG / Constellation Energy Corporation | 0.03 | 14.50 | 8.13 | 83.32 | 2.9396 | 1.0967 | |||
| NUE / Nucor Corporation | 0.06 | 22.16 | 7.71 | 31.50 | 2.7852 | 0.3514 | |||
| BRK.B / Berkshire Hathaway Inc. | 0.02 | 0.13 | 7.31 | -8.67 | 2.6409 | -0.6817 | |||
| GOOGL / Alphabet Inc. | 0.04 | 3.07 | 7.16 | 17.47 | 2.5884 | 0.0562 | |||
| LLY / Eli Lilly and Company | 0.01 | 8.03 | 6.46 | 1.96 | 2.3353 | -0.2965 | |||
| JPM / JPMorgan Chase & Co. | 0.02 | 2.90 | 6.29 | 21.62 | 2.2729 | 0.1254 | |||
| BLK / BlackRock, Inc. | 0.01 | 6.05 | 5.61 | 17.57 | 2.0286 | 0.0458 | |||
| XLU / The Select Sector SPDR Trust - The Utilities Select Sector SPDR Fund | 0.07 | 3.41 | 5.34 | 7.09 | 1.9283 | -0.1406 | |||
| SFM / Sprouts Farmers Market, Inc. | 0.03 | -9.35 | 5.10 | -2.22 | 1.8442 | -0.3231 | |||
| SMH / VanEck ETF Trust - VanEck Semiconductor ETF | 0.02 | 15.33 | 5.06 | 52.10 | 1.8283 | 0.4471 | |||
| QSR / Restaurant Brands International Inc. | 0.07 | 3.67 | 4.85 | 3.13 | 1.7527 | -0.2002 | |||
| MCD / McDonald's Corporation | 0.02 | -2.50 | 4.55 | -8.80 | 1.6444 | -0.4277 | |||
| CAT / Caterpillar Inc. | 0.01 | 10.80 | 4.41 | 30.42 | 1.5927 | 0.1896 | |||
| TOL / Toll Brothers, Inc. | 0.03 | 3.54 | 3.75 | 11.90 | 1.3559 | -0.0363 | |||
| NFLX / Netflix, Inc. | 0.00 | 0.00 | 1.49 | 43.64 | 0.5391 | 0.1077 | |||
| QQQ / Invesco QQQ Trust, Series 1 | 0.00 | 7.07 | 1.36 | 25.99 | 0.4924 | 0.0432 | |||
| DIA / SPDR Dow Jones Industrial Average ETF Trust | 0.00 | 6.18 | 0.76 | 11.49 | 0.2737 | -0.0085 | |||
| MSTR / Strategy Inc | 0.00 | -8.78 | 0.65 | 27.92 | 0.2337 | 0.0238 | |||
| IYG / iShares Trust - iShares U.S. Financial Services ETF | 0.01 | 3.64 | 0.52 | 12.85 | 0.1875 | -0.0033 | |||
| ORCL / Oracle Corporation | 0.00 | -20.35 | 0.43 | 24.49 | 0.1546 | 0.0120 | |||
| GOOG / Alphabet Inc. | 0.00 | 9.12 | 0.43 | 23.84 | 0.1541 | 0.0112 | |||
| CRM / Salesforce, Inc. | 0.00 | 0.69 | 0.36 | 2.29 | 0.1297 | -0.0160 | |||
| MA / Mastercard Incorporated | 0.00 | -0.33 | 0.34 | 2.43 | 0.1218 | -0.0152 | |||
| AVGO / Broadcom Inc. | 0.00 | -5.01 | 0.33 | 56.81 | 0.1209 | 0.0321 | |||
| UNP / Union Pacific Corporation | 0.00 | 0.56 | 0.33 | -2.07 | 0.1196 | -0.0207 | |||
| XLY / The Select Sector SPDR Trust - The Consumer Discretionary Select Sector SPDR Fund | 0.00 | 0.20 | 0.33 | 10.44 | 0.1186 | -0.0050 | |||
| TSLA / Tesla, Inc. | 0.00 | 0.32 | 0.1167 | 0.1167 | |||||
| BSX / Boston Scientific Corporation | 0.00 | 0.00 | 0.29 | 6.55 | 0.1062 | -0.0084 | |||
| IBM / International Business Machines Corporation | 0.00 | -25.00 | 0.27 | -11.07 | 0.0959 | -0.0280 | |||
| INTU / Intuit Inc. | 0.00 | -7.06 | 0.26 | 19.35 | 0.0936 | 0.0034 | |||
| GGME / Invesco Exchange-Traded Fund Trust - Invesco Next Gen Media and Gaming ETF | 0.00 | 0.22 | 0.0785 | 0.0785 | |||||
| AJG / Arthur J. Gallagher & Co. | 0.00 | -18.18 | 0.22 | -23.94 | 0.0781 | -0.0402 | |||
| NET / Cloudflare, Inc. | 0.00 | 0.22 | 0.0778 | 0.0778 | |||||
| XLI / The Select Sector SPDR Trust - The Industrial Select Sector SPDR Fund | 0.00 | 0.20 | 0.0730 | 0.0730 | |||||
| HTZ / Hertz Global Holdings, Inc. | 0.01 | 0.08 | 0.0272 | 0.0272 | |||||
| WSM / Williams-Sonoma, Inc. | 0.00 | -100.00 | 0.00 | 0.0000 | |||||
| CVX / Chevron Corporation | 0.00 | -100.00 | 0.00 | 0.0000 |