Statistik Asas
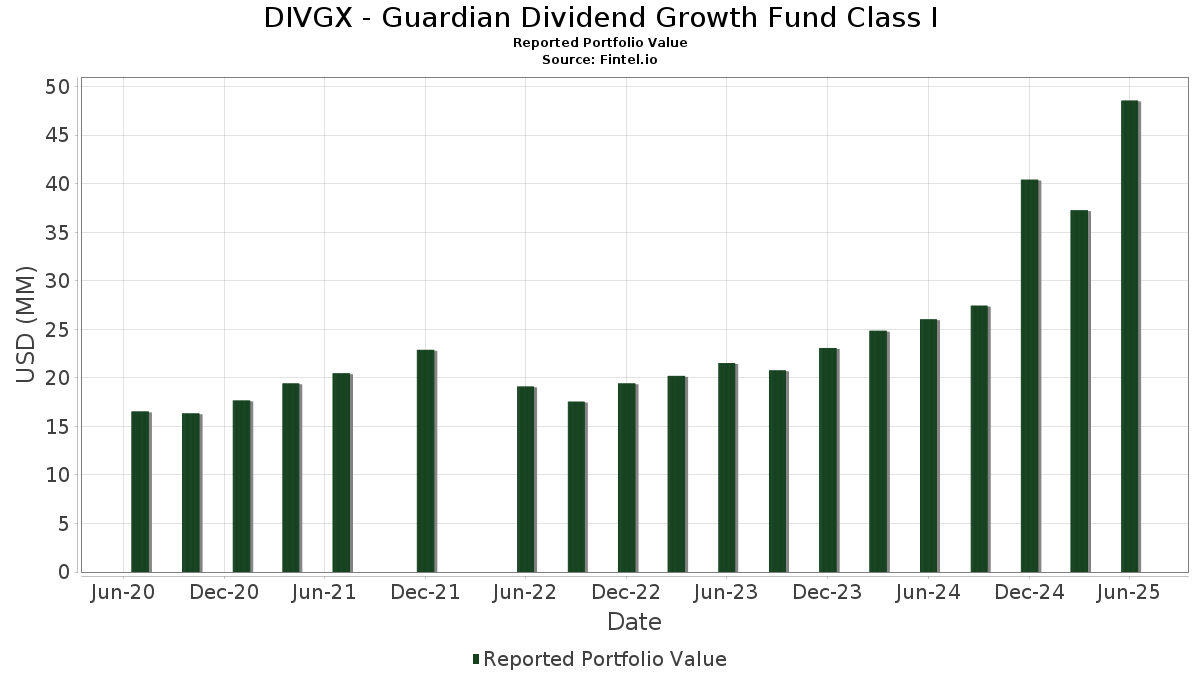
| Nilai Portfolio | $ 48,568,626 |
| Kedudukan Semasa | 42 |
Pegangan Terkini, Prestasi, AUM (dari 13F, 13D)
DIVGX - Guardian Dividend Growth Fund Class I telah mendedahkan 42 jumlah pegangan dalam pemfailan SEC terkini mereka. Nilai portfolio terkini dikira sebagai $ 48,568,626 USD. Aset Sebenar Di Bawah Pengurusan (AUM) ialah nilai ini ditambah dengan tunai (yang tidak didedahkan). Pegangan teratas DIVGX - Guardian Dividend Growth Fund Class I ialah Broadcom Inc. (US:AVGO) , Microsoft Corporation (US:MSFT) , AXA SA (FR:CS) , Costco Wholesale Corporation (US:COST) , and The Williams Companies, Inc. (US:WMB) . Kedudukan baharu DIVGX - Guardian Dividend Growth Fund Class I termasuk Morgan Stanley Institutional Liquidity Funds - Treasury Securities Portfolio (US:US61747C5250) , Darden Restaurants, Inc. (US:DRI) , Motorola Solutions, Inc. (US:MSI) , .
Kenaikan Teratas Suku Tahun Ini
Kami menggunakan perubahan dalam peruntukan portfolio kerana ini adalah metrik yang paling bermakna. Perubahan boleh disebabkan oleh perdagangan atau perubahan dalam harga saham.
| Sekuriti | Saham (MM) |
Nilai (MM$) |
Portfolio % | ΔPortfolio % |
|---|---|---|---|---|
| 0.01 | 3.53 | 7.3003 | 2.5882 | |
| 0.01 | 3.05 | 6.3069 | 1.2492 | |
| 0.00 | 1.04 | 2.1550 | 1.1832 | |
| 0.00 | 0.36 | 0.7531 | 0.7531 | |
| 0.00 | 0.36 | 0.7512 | 0.7512 | |
| 0.01 | 1.74 | 3.5910 | 0.6227 | |
| 0.05 | 2.67 | 5.5206 | 0.4255 | |
| 0.00 | 1.41 | 2.9247 | 0.3539 | |
| 0.01 | 0.78 | 1.6176 | 0.3278 | |
| 0.01 | 1.71 | 3.5309 | 0.3228 |
Penurunan Teratas Suku Tahun Ini
Kami menggunakan perubahan dalam peruntukan portfolio kerana ini adalah metrik yang paling bermakna. Perubahan boleh disebabkan oleh perdagangan atau perubahan dalam harga saham.
| Sekuriti | Saham (MM) |
Nilai (MM$) |
Portfolio % | ΔPortfolio % |
|---|---|---|---|---|
| 0.01 | 1.95 | 4.0337 | -1.9662 | |
| 0.00 | 0.88 | 1.8269 | -0.8122 | |
| 0.48 | 0.9890 | -0.6597 | ||
| 0.01 | 1.00 | 2.0663 | -0.3177 | |
| 0.00 | 0.75 | 1.5514 | -0.3095 | |
| 0.02 | 1.24 | 2.5653 | -0.3072 | |
| 0.02 | 1.22 | 2.5165 | -0.2667 | |
| 0.01 | 1.01 | 2.0816 | -0.2451 | |
| 0.00 | 0.82 | 1.6934 | -0.2306 | |
| 0.00 | 1.14 | 2.3501 | -0.1767 |
13F dan Pemfailan Dana
Borang ini telah difailkan pada 2025-08-29 untuk tempoh pelaporan 2025-06-30. Klik ikon pautan untuk melihat sejarah transaksi penuh.
Tingkatkan untuk membuka data premium dan eksport ke Excel ![]() .
.
| Sekuriti | Jenis | Purata Harga Saham | Saham (MM) |
ΔSaham (%) |
ΔSaham (%) |
Nilai ($MM) |
Portfolio (%) |
ΔPortfolio (%) |
|
|---|---|---|---|---|---|---|---|---|---|
| AVGO / Broadcom Inc. | 0.01 | 22.19 | 3.53 | 101.14 | 7.3003 | 2.5882 | |||
| MSFT / Microsoft Corporation | 0.01 | 22.20 | 3.05 | 61.98 | 6.3069 | 1.2492 | |||
| CS / AXA SA | 0.05 | 22.19 | 2.67 | 40.70 | 5.5206 | 0.4255 | |||
| COST / Costco Wholesale Corporation | 0.00 | 22.15 | 2.54 | 27.86 | 5.2484 | -0.0818 | |||
| WMB / The Williams Companies, Inc. | 0.04 | 22.19 | 2.34 | 28.46 | 4.8354 | -0.0534 | |||
| ALV / Allianz SE | 0.01 | 30.46 | 2.25 | 38.78 | 4.6554 | 0.3004 | |||
| AAPL / Apple Inc. | 0.01 | -5.49 | 1.95 | -12.71 | 4.0337 | -1.9662 | |||
| WTKWY / Wolters Kluwer N.V. - Depositary Receipt (Common Stock) | 0.01 | 46.49 | 1.74 | 57.10 | 3.5910 | 0.6227 | |||
| RY / Royal Bank of Canada | 0.01 | 22.19 | 1.71 | 42.96 | 3.5309 | 0.3228 | |||
| RSG / Republic Services, Inc. | 0.01 | 22.19 | 1.65 | 24.43 | 3.4033 | -0.1481 | |||
| ASML / ASML Holding N.V. - Depositary Receipt (Common Stock) | 0.00 | 22.15 | 1.41 | 47.75 | 2.9247 | 0.3539 | |||
| GOOGL / Alphabet Inc. | 0.01 | 22.20 | 1.27 | 39.30 | 2.6259 | 0.1774 | |||
| TTE / TotalEnergies SE - Depositary Receipt (Common Stock) | 0.02 | 22.20 | 1.24 | 16.00 | 2.5653 | -0.3072 | |||
| SHEL / Shell plc - Depositary Receipt (Common Stock) | 0.02 | 22.19 | 1.22 | 17.47 | 2.5165 | -0.2667 | |||
| MA / Mastercard Incorporated | 0.00 | 22.16 | 1.21 | 25.31 | 2.4982 | -0.0919 | |||
| SBGSY / Schneider Electric S.E. - Depositary Receipt (Common Stock) | 0.02 | 22.20 | 1.18 | 42.20 | 2.4317 | 0.2089 | |||
| EQIX / Equinix, Inc. | 0.00 | 32.11 | 1.17 | 28.82 | 2.4228 | -0.0181 | |||
| WM / Waste Management, Inc. | 0.00 | 22.19 | 1.14 | 20.72 | 2.3501 | -0.1767 | |||
| META / Meta Platforms, Inc. | 0.00 | 124.84 | 1.04 | 188.64 | 2.1550 | 1.1832 | |||
| HIG / The Hartford Insurance Group, Inc. | 0.01 | 22.20 | 1.03 | 25.37 | 2.1260 | -0.0772 | |||
| AZN / AstraZeneca PLC - Depositary Receipt (Common Stock) | 0.01 | 22.19 | 1.01 | 16.17 | 2.0816 | -0.2451 | |||
| JNJ / Johnson & Johnson | 0.01 | 22.19 | 1.00 | 12.63 | 2.0663 | -0.3177 | |||
| HD / The Home Depot, Inc. | 0.00 | 22.21 | 0.89 | 22.16 | 1.8483 | -0.1148 | |||
| ACN / Accenture plc | 0.00 | -6.16 | 0.88 | -10.08 | 1.8269 | -0.8122 | |||
| MCD / McDonald's Corporation | 0.00 | 22.19 | 0.82 | 14.25 | 1.6934 | -0.2306 | |||
| NVO / Novo Nordisk A/S - Depositary Receipt (Common Stock) | 0.01 | 22.20 | 0.79 | 21.48 | 1.6260 | -0.1122 | |||
| TJX / The TJX Companies, Inc. | 0.01 | 60.62 | 0.78 | 62.92 | 1.6176 | 0.3278 | |||
| ABBV / AbbVie Inc. | 0.00 | 22.19 | 0.75 | 8.23 | 1.5514 | -0.3095 | |||
| APD / Air Products and Chemicals, Inc. | 0.00 | 22.21 | 0.73 | 16.91 | 1.5018 | -0.1666 | |||
| PG / The Procter & Gamble Company | 0.00 | 22.20 | 0.59 | 14.29 | 1.2258 | -0.1675 | |||
| WEC / WEC Energy Group, Inc. | 0.01 | 22.21 | 0.54 | 16.81 | 1.1075 | -0.1232 | |||
| IBN / ICICI Bank Limited - Depositary Receipt (Common Stock) | 0.02 | 22.20 | 0.52 | 30.30 | 1.0681 | 0.0047 | |||
| GWW / W.W. Grainger, Inc. | 0.00 | 22.16 | 0.49 | 28.72 | 1.0196 | -0.0095 | |||
| US61747C5250 / Morgan Stanley Institutional Liquidity Funds - Treasury Securities Portfolio | 0.48 | -22.15 | 0.9890 | -0.6597 | |||||
| PH / Parker-Hannifin Corporation | 0.00 | 22.14 | 0.48 | 40.29 | 0.9879 | 0.0739 | |||
| UL / Unilever PLC - Depositary Receipt (Common Stock) | 0.01 | 22.22 | 0.48 | 25.66 | 0.9824 | -0.0337 | |||
| DRI / Darden Restaurants, Inc. | 0.00 | 0.36 | 0.7531 | 0.7531 | |||||
| MSI / Motorola Solutions, Inc. | 0.00 | 0.36 | 0.7512 | 0.7512 | |||||
| AMGN / Amgen Inc. | 0.00 | 22.20 | 0.35 | 9.72 | 0.7246 | -0.1345 | |||
| EOG / EOG Resources, Inc. | 0.00 | 22.19 | 0.34 | 13.90 | 0.6960 | -0.0970 | |||
| ITW / Illinois Tool Works Inc. | 0.00 | 22.24 | 0.31 | 21.88 | 0.6462 | -0.0423 | |||
| SNY / Sanofi - Depositary Receipt (Common Stock) | 0.01 | 22.22 | 0.30 | 6.38 | 0.6213 | -0.1365 |