Statistik Asas
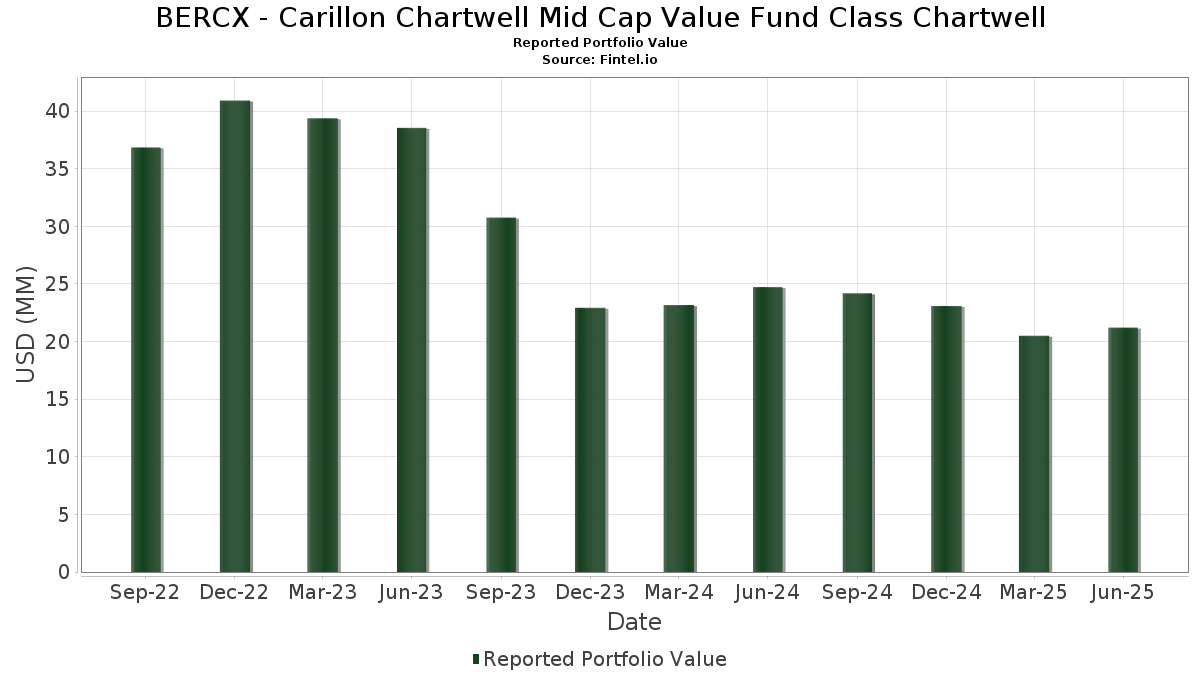
| Nilai Portfolio | $ 21,208,574 |
| Kedudukan Semasa | 48 |
Pegangan Terkini, Prestasi, AUM (dari 13F, 13D)
BERCX - Carillon Chartwell Mid Cap Value Fund Class Chartwell telah mendedahkan 48 jumlah pegangan dalam pemfailan SEC terkini mereka. Nilai portfolio terkini dikira sebagai $ 21,208,574 USD. Aset Sebenar Di Bawah Pengurusan (AUM) ialah nilai ini ditambah dengan tunai (yang tidak didedahkan). Pegangan teratas BERCX - Carillon Chartwell Mid Cap Value Fund Class Chartwell ialah Dollar Tree, Inc. (US:DLTR) , Crown Holdings, Inc. (US:CCK) , Gates Industrial Corporation plc (US:GTES) , The Middleby Corporation (US:MIDD) , and CAE Inc. (US:CAE) . Kedudukan baharu BERCX - Carillon Chartwell Mid Cap Value Fund Class Chartwell termasuk First American Funds Inc - First American Government Obligations Fund Class X (US:FGXXX) , nVent Electric plc (US:NVT) , ON Semiconductor Corporation (US:ON) , International Paper Company (US:IP) , and Knight-Swift Transportation Holdings Inc. (US:KNX) .
Kenaikan Teratas Suku Tahun Ini
Kami menggunakan perubahan dalam peruntukan portfolio kerana ini adalah metrik yang paling bermakna. Perubahan boleh disebabkan oleh perdagangan atau perubahan dalam harga saham.
| Sekuriti | Saham (MM) |
Nilai (MM$) |
Portfolio % | ΔPortfolio % |
|---|---|---|---|---|
| 0.51 | 0.51 | 2.4329 | 2.4329 | |
| 0.01 | 0.43 | 2.0418 | 2.0418 | |
| 0.01 | 0.43 | 2.0203 | 2.0203 | |
| 0.01 | 0.36 | 1.7101 | 1.7101 | |
| 0.01 | 0.31 | 1.4714 | 1.4714 | |
| 0.01 | 0.79 | 3.7382 | 0.7693 | |
| 0.01 | 0.47 | 2.2074 | 0.6850 | |
| 0.02 | 0.50 | 2.3455 | 0.6088 | |
| 0.00 | 0.45 | 2.1270 | 0.5132 | |
| 0.04 | 0.53 | 2.4978 | 0.4927 |
Penurunan Teratas Suku Tahun Ini
Kami menggunakan perubahan dalam peruntukan portfolio kerana ini adalah metrik yang paling bermakna. Perubahan boleh disebabkan oleh perdagangan atau perubahan dalam harga saham.
| Sekuriti | Saham (MM) |
Nilai (MM$) |
Portfolio % | ΔPortfolio % |
|---|---|---|---|---|
| 0.00 | 0.41 | 1.9233 | -0.7307 | |
| 0.00 | 0.45 | 2.1461 | -0.7223 | |
| 0.01 | 0.44 | 2.0833 | -0.7171 | |
| 0.00 | 0.35 | 1.6714 | -0.6423 | |
| 0.01 | 0.42 | 1.9724 | -0.6301 | |
| 0.00 | 0.53 | 2.5036 | -0.4820 | |
| 0.00 | 0.35 | 1.6390 | -0.4617 | |
| 0.01 | 0.41 | 1.9193 | -0.3859 | |
| 0.00 | 0.39 | 1.8524 | -0.3451 | |
| 0.00 | 0.58 | 2.7646 | -0.2927 |
13F dan Pemfailan Dana
Borang ini telah difailkan pada 2025-08-27 untuk tempoh pelaporan 2025-06-30. Klik ikon pautan untuk melihat sejarah transaksi penuh.
Tingkatkan untuk membuka data premium dan eksport ke Excel ![]() .
.
| Sekuriti | Jenis | Purata Harga Saham | Saham (MM) |
ΔSaham (%) |
ΔSaham (%) |
Nilai ($MM) |
Portfolio (%) |
ΔPortfolio (%) |
|
|---|---|---|---|---|---|---|---|---|---|
| DLTR / Dollar Tree, Inc. | 0.01 | -4.14 | 0.79 | 26.44 | 3.7382 | 0.7693 | |||
| CCK / Crown Holdings, Inc. | 0.01 | -4.14 | 0.61 | 10.65 | 2.9037 | 0.2666 | |||
| GTES / Gates Industrial Corporation plc | 0.03 | -24.02 | 0.60 | -5.04 | 2.8588 | -0.1624 | |||
| MIDD / The Middleby Corporation | 0.00 | -4.14 | 0.58 | -9.18 | 2.7646 | -0.2927 | |||
| CAE / CAE Inc. | 0.02 | -23.17 | 0.58 | -8.53 | 2.7443 | -0.2699 | |||
| LFUS / Littelfuse, Inc. | 0.00 | -4.15 | 0.54 | 10.45 | 2.5542 | 0.2316 | |||
| LHX / L3Harris Technologies, Inc. | 0.00 | -19.65 | 0.54 | -3.76 | 2.5492 | -0.1099 | |||
| EXE / Expand Energy Corporation | 0.00 | -19.82 | 0.53 | -15.79 | 2.5036 | -0.4820 | |||
| AVTR / Avantor, Inc. | 0.04 | 50.69 | 0.53 | 25.18 | 2.4978 | 0.4927 | |||
| NSC / Norfolk Southern Corporation | 0.00 | -4.12 | 0.52 | 3.56 | 2.4802 | 0.0759 | |||
| PEG / Public Service Enterprise Group Incorporated | 0.01 | -4.13 | 0.52 | -1.90 | 2.4410 | -0.0594 | |||
| FGXXX / First American Funds Inc - First American Government Obligations Fund Class X | 0.51 | 0.51 | 2.4329 | 2.4329 | |||||
| RRX / Regal Rexnord Corporation | 0.00 | -4.14 | 0.50 | 22.09 | 2.3830 | 0.4219 | |||
| BRX / Brixmor Property Group Inc. | 0.02 | -4.13 | 0.50 | -6.03 | 2.3640 | -0.1614 | |||
| FHN / First Horizon Corporation | 0.02 | 24.26 | 0.50 | 35.62 | 2.3455 | 0.6088 | |||
| KEYS / Keysight Technologies, Inc. | 0.00 | -4.16 | 0.48 | 4.81 | 2.2695 | 0.0955 | |||
| CTSH / Cognizant Technology Solutions Corporation | 0.01 | -4.14 | 0.47 | -2.27 | 2.2478 | -0.0614 | |||
| HOLX / Hologic, Inc. | 0.01 | 38.06 | 0.47 | 45.63 | 2.2074 | 0.6850 | |||
| 37C / CNH Industrial N.V. | 0.04 | -4.13 | 0.46 | 1.32 | 2.1835 | 0.0157 | |||
| AEE / Ameren Corporation | 0.00 | -21.43 | 0.45 | -24.88 | 2.1461 | -0.7223 | |||
| PNFP / Pinnacle Financial Partners, Inc. | 0.00 | 27.15 | 0.45 | 32.45 | 2.1270 | 0.5132 | |||
| EXPE / Expedia Group, Inc. | 0.00 | -4.15 | 0.44 | -3.90 | 2.1015 | -0.0932 | |||
| CMS / CMS Energy Corporation | 0.01 | -18.99 | 0.44 | -25.30 | 2.0833 | -0.7171 | |||
| SBAC / SBA Communications Corporation | 0.00 | -4.15 | 0.44 | 2.33 | 2.0798 | 0.0379 | |||
| NVT / nVent Electric plc | 0.01 | 0.43 | 2.0418 | 2.0418 | |||||
| ON / ON Semiconductor Corporation | 0.01 | 0.43 | 2.0203 | 2.0203 | |||||
| QSR / Restaurant Brands International Inc. | 0.01 | -23.47 | 0.42 | -23.95 | 1.9724 | -0.6301 | |||
| EA / Electronic Arts Inc. | 0.00 | -4.12 | 0.41 | 5.97 | 1.9344 | 0.1005 | |||
| THG / The Hanover Insurance Group, Inc. | 0.00 | -25.46 | 0.41 | -27.24 | 1.9233 | -0.7307 | |||
| CUZ / Cousins Properties Incorporated | 0.01 | -4.14 | 0.41 | -2.40 | 1.9219 | -0.0564 | |||
| JLL / Jones Lang LaSalle Incorporated | 0.00 | -4.17 | 0.41 | -1.22 | 1.9214 | -0.0305 | |||
| BKR / Baker Hughes Company | 0.01 | -4.13 | 0.41 | -16.32 | 1.9193 | -0.3859 | |||
| MAA / Mid-America Apartment Communities, Inc. | 0.00 | -4.13 | 0.39 | -15.37 | 1.8524 | -0.3451 | |||
| FMC / FMC Corporation | 0.01 | -4.13 | 0.39 | -5.16 | 1.8284 | -0.1075 | |||
| GMED / Globus Medical, Inc. | 0.01 | 58.89 | 0.39 | 27.91 | 1.8257 | 0.3942 | |||
| BC / Brunswick Corporation | 0.01 | -4.13 | 0.38 | -1.79 | 1.8201 | -0.0389 | |||
| HUM / Humana Inc. | 0.00 | -4.13 | 0.38 | -11.45 | 1.7983 | -0.2410 | |||
| SYF / Synchrony Financial | 0.01 | -4.15 | 0.37 | 21.12 | 1.7381 | 0.2933 | |||
| IP / International Paper Company | 0.01 | 0.36 | 1.7101 | 1.7101 | |||||
| ALL / The Allstate Corporation | 0.00 | -25.36 | 0.35 | -27.37 | 1.6714 | -0.6423 | |||
| GPN / Global Payments Inc. | 0.00 | -4.12 | 0.35 | -21.54 | 1.6390 | -0.4617 | |||
| ALGN / Align Technology, Inc. | 0.00 | -4.12 | 0.34 | 14.14 | 1.6077 | 0.1946 | |||
| KNX / Knight-Swift Transportation Holdings Inc. | 0.01 | 0.31 | 1.4714 | 1.4714 | |||||
| SWK / Stanley Black & Decker, Inc. | 0.00 | -4.15 | 0.31 | -15.57 | 1.4668 | -0.2775 | |||
| WMS / Advanced Drainage Systems, Inc. | 0.00 | -4.13 | 0.30 | 1.34 | 1.4375 | 0.0128 | |||
| TSN / Tyson Foods, Inc. | 0.01 | -4.13 | 0.29 | -15.85 | 1.3838 | -0.2700 | |||
| FANG / Diamondback Energy, Inc. | 0.00 | -4.18 | 0.26 | -17.76 | 1.2533 | -0.2754 | |||
| MTB / M&T Bank Corporation | 0.00 | -4.10 | 0.26 | 4.03 | 1.2231 | 0.0426 |