Statistik Asas
| Profil Orang Dalam | CBRE INVESTMENT MANAGEMENT LISTED REAL ASSETS LLC |
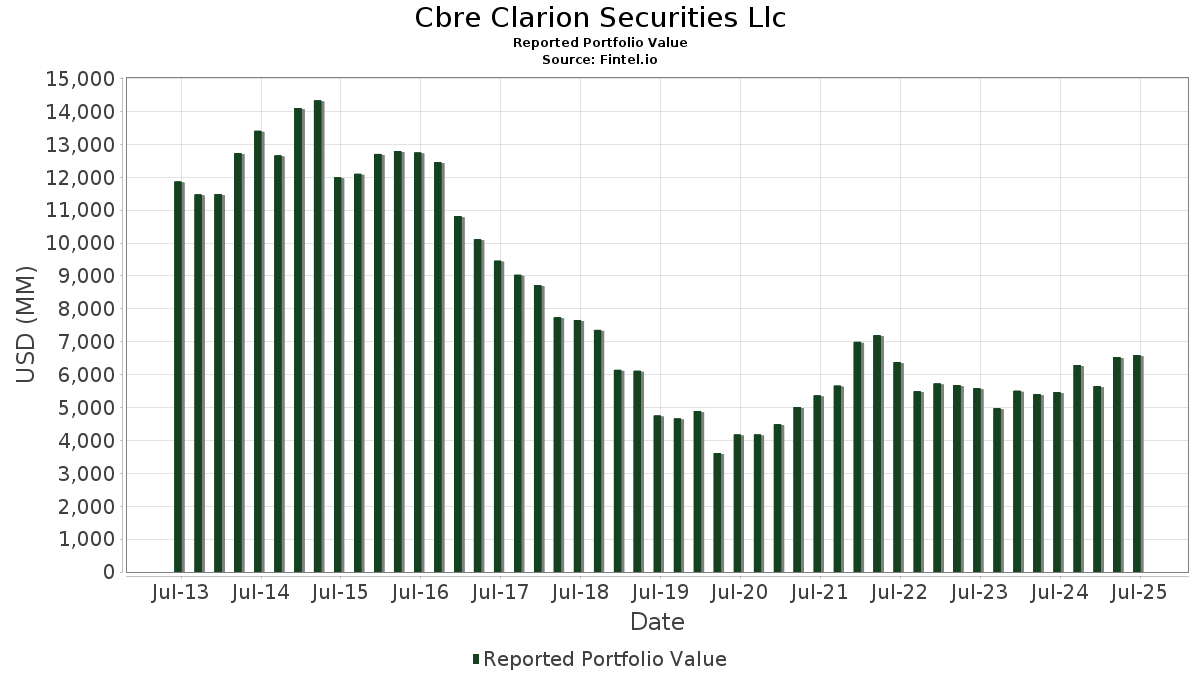
| Nilai Portfolio | $ 6,595,410,913 |
| Kedudukan Semasa | 107 |
Pegangan Terkini, Prestasi, AUM (dari 13F, 13D)
Cbre Clarion Securities Llc telah mendedahkan 107 jumlah pegangan dalam pemfailan SEC terkini mereka. Nilai portfolio terkini dikira sebagai $ 6,595,410,913 USD. Aset Sebenar Di Bawah Pengurusan (AUM) ialah nilai ini ditambah dengan tunai (yang tidak didedahkan). Pegangan teratas Cbre Clarion Securities Llc ialah Welltower Inc. (US:WELL) , Equinix, Inc. (US:EQIX) , Simon Property Group, Inc. (US:SPG) , Realty Income Corporation (US:O) , and Invitation Homes Inc. (US:INVH) . Kedudukan baharu Cbre Clarion Securities Llc termasuk SmartStop Self Storage REIT, Inc. (US:SMA) , .
Kenaikan Teratas Suku Tahun Ini
Kami menggunakan perubahan dalam peruntukan portfolio kerana ini adalah metrik yang paling bermakna. Perubahan boleh disebabkan oleh perdagangan atau perubahan dalam harga saham.
| Sekuriti | Saham (MM) |
Nilai (MM$) |
Portfolio % | ΔPortfolio % |
|---|---|---|---|---|
| 5.59 | 182.17 | 2.7620 | 1.5243 | |
| 0.30 | 72.35 | 1.0970 | 1.0970 | |
| 3.15 | 128.59 | 1.9497 | 1.0818 | |
| 3.53 | 128.20 | 1.9438 | 0.8723 | |
| 1.42 | 119.17 | 1.8069 | 0.7614 | |
| 0.80 | 176.56 | 2.6770 | 0.6534 | |
| 1.07 | 110.07 | 1.6689 | 0.6521 | |
| 1.63 | 48.88 | 0.7412 | 0.6087 | |
| 4.22 | 109.81 | 1.6650 | 0.5980 | |
| 1.19 | 37.83 | 0.5735 | 0.5735 |
Penurunan Teratas Suku Tahun Ini
Kami menggunakan perubahan dalam peruntukan portfolio kerana ini adalah metrik yang paling bermakna. Perubahan boleh disebabkan oleh perdagangan atau perubahan dalam harga saham.
| Sekuriti | Saham (MM) |
Nilai (MM$) |
Portfolio % | ΔPortfolio % |
|---|---|---|---|---|
| 0.46 | 28.64 | 0.4342 | -0.8434 | |
| 4.15 | 239.30 | 3.6283 | -0.8292 | |
| 1.57 | 252.15 | 3.8231 | -0.8205 | |
| 2.45 | 104.11 | 1.5786 | -0.7459 | |
| 0.49 | 40.07 | 0.6076 | -0.6156 | |
| 2.08 | 147.93 | 2.2429 | -0.6035 | |
| 0.05 | 1.22 | 0.0185 | -0.5713 | |
| 4.64 | 81.30 | 1.2326 | -0.5336 | |
| 1.59 | 26.37 | 0.3999 | -0.5152 | |
| 0.37 | 35.25 | 0.5345 | -0.5040 |
13F dan Pemfailan Dana
Borang ini telah difailkan pada 2025-08-06 untuk tempoh pelaporan 2025-06-30. Klik ikon pautan untuk melihat sejarah transaksi penuh.
Tingkatkan untuk membuka data premium dan eksport ke Excel ![]() .
.
| Sekuriti | Jenis | Purata Harga Saham | Saham (MM) |
ΔSaham (%) |
ΔSaham (%) |
Nilai ($MM) |
Portfolio (%) |
ΔPortfolio (%) |
|
|---|---|---|---|---|---|---|---|---|---|
| WELL / Welltower Inc. | 3.27 | 8.57 | 502.92 | 8.94 | 7.6254 | 0.5603 | |||
| EQIX / Equinix, Inc. | 0.49 | 13.47 | 386.23 | 10.70 | 5.8561 | 0.5167 | |||
| SPG / Simon Property Group, Inc. | 1.57 | -14.15 | 252.15 | -16.90 | 3.8231 | -0.8205 | |||
| O / Realty Income Corporation | 4.15 | -17.27 | 239.30 | -17.84 | 3.6283 | -0.8292 | |||
| INVH / Invitation Homes Inc. | 6.06 | 5.71 | 198.72 | -0.51 | 3.0130 | -0.0437 | |||
| EXR / Extra Space Storage Inc. | 1.24 | -6.31 | 183.51 | -6.97 | 2.7824 | -0.2365 | |||
| VICI / VICI Properties Inc. | 5.59 | 125.37 | 182.17 | 125.23 | 2.7620 | 1.5243 | |||
| AMT / American Tower Corporation | 0.80 | 31.46 | 176.56 | 33.52 | 2.6770 | 0.6534 | |||
| PLD / Prologis, Inc. | 1.63 | -8.97 | 171.75 | -14.40 | 2.6041 | -0.4666 | |||
| DLR / Digital Realty Trust, Inc. | 0.96 | -1.16 | 166.61 | 20.25 | 2.5261 | 0.4057 | |||
| NSC / Norfolk Southern Corporation | 0.61 | -1.07 | 156.09 | 6.92 | 2.3666 | 0.1324 | |||
| REG / Regency Centers Corporation | 2.08 | -17.64 | 147.93 | -20.47 | 2.2429 | -0.6035 | |||
| EGP / EastGroup Properties, Inc. | 0.81 | 31.03 | 136.05 | 24.32 | 2.0628 | 0.3880 | |||
| UDR / UDR, Inc. | 3.15 | 150.84 | 128.59 | 126.74 | 1.9497 | 1.0818 | |||
| STAG / STAG Industrial, Inc. | 3.53 | 82.30 | 128.20 | 83.11 | 1.9438 | 0.8723 | |||
| PPL / PPL Corporation | 3.57 | 44.98 | 121.13 | 36.06 | 1.8365 | 0.4742 | |||
| PEG / Public Service Enterprise Group Incorporated | 1.42 | 70.54 | 119.17 | 74.44 | 1.8069 | 0.7614 | |||
| FR / First Industrial Realty Trust, Inc. | 2.34 | 13.17 | 112.76 | 0.94 | 1.7097 | 0.0001 | |||
| WEC / WEC Energy Group, Inc. | 1.06 | -0.33 | 110.27 | -4.70 | 1.6719 | -0.0989 | |||
| IRM / Iron Mountain Incorporated | 1.07 | 38.97 | 110.07 | 65.67 | 1.6689 | 0.6521 | |||
| BRX / Brixmor Property Group Inc. | 4.22 | 60.58 | 109.81 | 57.50 | 1.6650 | 0.5980 | |||
| CUBE / CubeSmart | 2.45 | -31.12 | 104.11 | -31.46 | 1.5786 | -0.7459 | |||
| ATO / Atmos Energy Corporation | 0.67 | 24.01 | 103.91 | 23.63 | 1.5754 | 0.2892 | |||
| XEL / Xcel Energy Inc. | 1.52 | 4.41 | 103.45 | 0.44 | 1.5686 | -0.0077 | |||
| WMB / The Williams Companies, Inc. | 1.64 | 12.14 | 103.26 | 17.86 | 1.5656 | 0.2249 | |||
| CEG / Constellation Energy Corporation | 0.30 | -4.67 | 98.12 | 52.59 | 1.4878 | 0.5037 | |||
| TRGP / Targa Resources Corp. | 0.53 | 35.84 | 92.12 | 17.96 | 1.3967 | 0.2016 | |||
| WTRG / Essential Utilities, Inc. | 2.36 | 8.95 | 87.67 | 2.36 | 1.3293 | 0.0185 | |||
| AES / The AES Corporation | 7.81 | 10.92 | 82.19 | -6.05 | 1.2462 | -0.0926 | |||
| NEE / NextEra Energy, Inc. | 1.18 | 64.84 | 82.07 | 61.42 | 1.2444 | 0.4663 | |||
| PCG / PG&E Corporation | 5.86 | 7.93 | 81.72 | -12.43 | 1.2390 | -0.1890 | |||
| DOC / Healthpeak Properties, Inc. | 4.64 | -18.66 | 81.30 | -29.56 | 1.2326 | -0.5336 | |||
| AVB / AvalonBay Communities, Inc. | 0.39 | -22.64 | 78.92 | -26.65 | 1.1966 | -0.4500 | |||
| PSA / Public Storage | 0.25 | -25.32 | 74.50 | -26.79 | 1.1295 | -0.4277 | |||
| CCI / Crown Castle Inc. | 0.71 | -5.54 | 72.90 | -6.90 | 1.1053 | -0.0930 | |||
| LNG / Cheniere Energy, Inc. | 0.30 | 72.35 | 1.0970 | 1.0970 | |||||
| CMS / CMS Energy Corporation | 0.98 | -1.63 | 68.18 | -9.26 | 1.0337 | -0.1161 | |||
| EVRG / Evergy, Inc. | 0.93 | 10.24 | 64.23 | 10.21 | 0.9739 | 0.0820 | |||
| VTR / Ventas, Inc. | 0.90 | 140.04 | 57.14 | 120.46 | 0.8664 | 0.4698 | |||
| SO / The Southern Company | 0.60 | 114.15 | 55.06 | 113.87 | 0.8349 | 0.4409 | |||
| VNO / Vornado Realty Trust | 1.44 | 47.97 | 55.04 | 52.97 | 0.8346 | 0.2839 | |||
| IRT / Independence Realty Trust, Inc. | 2.97 | 32.80 | 52.48 | 10.66 | 0.7957 | 0.0699 | |||
| CUZ / Cousins Properties Incorporated | 1.63 | 454.88 | 48.88 | 464.87 | 0.7412 | 0.6087 | |||
| SHO / Sunstone Hotel Investors, Inc. | 5.36 | -2.10 | 46.52 | -9.70 | 0.7054 | -0.0831 | |||
| OGE / OGE Energy Corp. | 1.00 | 2.74 | 44.36 | -0.80 | 0.6725 | -0.0117 | |||
| AMH / American Homes 4 Rent | 1.17 | -4.15 | 42.18 | -8.56 | 0.6396 | -0.0664 | |||
| ELME / Elme Communities | 2.53 | 2.69 | 40.15 | -6.16 | 0.6088 | -0.0460 | |||
| OKE / ONEOK, Inc. | 0.49 | -39.06 | 40.07 | -49.86 | 0.6076 | -0.6156 | |||
| EPRT / Essential Properties Realty Trust, Inc. | 1.19 | 37.83 | 0.5735 | 0.5735 | |||||
| ESS / Essex Property Trust, Inc. | 0.13 | 0.00 | 37.15 | -7.56 | 0.5633 | -0.0517 | |||
| FRT / Federal Realty Investment Trust | 0.37 | -46.50 | 35.25 | -48.05 | 0.5345 | -0.5040 | |||
| CPT / Camden Property Trust | 0.31 | 1.93 | 34.79 | -6.08 | 0.5275 | -0.0394 | |||
| CWT / California Water Service Group | 0.75 | 7.34 | 34.20 | 0.74 | 0.5185 | -0.0010 | |||
| CDP / COPT Defense Properties | 1.23 | -12.15 | 34.01 | -11.16 | 0.5156 | -0.0702 | |||
| SUI / Sun Communities, Inc. | 0.26 | -45.57 | 33.16 | -46.48 | 0.5028 | -0.4455 | |||
| NEE.PRR / NextEra Energy, Inc. - Preferred Security | 0.74 | 0.00 | 29.30 | -2.19 | 0.4443 | -0.0142 | |||
| ELS / Equity LifeStyle Properties, Inc. | 0.46 | -62.90 | 28.64 | -65.70 | 0.4342 | -0.8434 | |||
| REXR / Rexford Industrial Realty, Inc. | 0.80 | -31.43 | 28.52 | -37.70 | 0.4325 | -0.2682 | |||
| COLD / Americold Realty Trust, Inc. | 1.59 | -43.08 | 26.37 | -55.89 | 0.3999 | -0.5152 | |||
| ETR / Entergy Corporation | 0.27 | 22.54 | 0.3417 | 0.3417 | |||||
| BIP / Brookfield Infrastructure Partners L.P. - Limited Partnership | 0.67 | -6.29 | 22.47 | 5.38 | 0.3407 | 0.0144 | |||
| D / Dominion Energy, Inc. | 0.37 | 0.00 | 20.88 | 0.80 | 0.3166 | -0.0004 | |||
| HLT / Hilton Worldwide Holdings Inc. | 0.07 | 119.41 | 19.25 | 156.82 | 0.2919 | 0.1772 | |||
| MAA / Mid-America Apartment Communities, Inc. | 0.13 | 18.51 | 0.2806 | 0.2806 | |||||
| CWEN / Clearway Energy, Inc. | 0.57 | 0.00 | 18.39 | 5.71 | 0.2788 | 0.0126 | |||
| VRE / Veris Residential, Inc. | 1.21 | 5.93 | 18.02 | -6.78 | 0.2732 | -0.0226 | |||
| WY / Weyerhaeuser Company | 0.69 | 284.83 | 17.67 | 237.69 | 0.2679 | 0.1878 | |||
| AHR / American Healthcare REIT, Inc. | 0.47 | -67.67 | 17.32 | -60.80 | 0.2626 | -0.4136 | |||
| POR / Portland General Electric Company | 0.42 | -51.17 | 17.17 | -55.52 | 0.2603 | -0.3303 | |||
| SRE / Sempra | 0.23 | 4.04 | 17.09 | 10.46 | 0.2592 | 0.0224 | |||
| CSX / CSX Corporation | 0.52 | -65.31 | 16.95 | -61.54 | 0.2570 | -0.4175 | |||
| SMA / SmartStop Self Storage REIT, Inc. | 0.46 | 16.63 | 0.2522 | 0.2522 | |||||
| HR / Healthcare Realty Trust Incorporated | 0.94 | 0.00 | 14.94 | -6.16 | 0.2265 | -0.0171 | |||
| KRG / Kite Realty Group Trust | 0.63 | 14.38 | 0.2180 | 0.2180 | |||||
| ARE / Alexandria Real Estate Equities, Inc. | 0.19 | 0.86 | 13.76 | -20.81 | 0.2087 | -0.0573 | |||
| GTY / Getty Realty Corp. | 0.47 | -48.14 | 13.06 | -54.03 | 0.1980 | -0.2368 | |||
| RHP / Ryman Hospitality Properties, Inc. | 0.10 | 10.23 | 0.1552 | 0.1552 | |||||
| NSA / National Storage Affiliates Trust | 0.32 | 0.00 | 10.11 | -18.81 | 0.1533 | -0.0373 | |||
| NTST / NETSTREIT Corp. | 0.60 | -9.07 | 10.08 | -2.87 | 0.1529 | -0.0060 | |||
| MAR / Marriott International, Inc. | 0.04 | -29.04 | 9.91 | -18.62 | 0.1502 | -0.0361 | |||
| EQR / Equity Residential | 0.15 | -61.46 | 9.88 | -63.66 | 0.1498 | -0.2662 | |||
| PEB.PRF / Pebblebrook Hotel Trust - Preferred Stock | 0.54 | 0.00 | 9.51 | 0.23 | 0.1442 | -0.0010 | |||
| BXP / Boston Properties, Inc. | 0.13 | 0.00 | 8.57 | 0.41 | 0.1300 | -0.0007 | |||
| GLPI / Gaming and Leisure Properties, Inc. | 0.18 | 64.47 | 8.50 | 50.83 | 0.1288 | 0.0426 | |||
| SBAC / SBA Communications Corporation | 0.04 | -65.22 | 8.28 | -62.88 | 0.1255 | -0.2158 | |||
| PK / Park Hotels & Resorts Inc. | 0.80 | 0.00 | 8.19 | -4.22 | 0.1242 | -0.0067 | |||
| CSR / Centerspace | 0.13 | 131.85 | 8.02 | 115.51 | 0.1216 | 0.0647 | |||
| LINE / Lineage, Inc. | 0.17 | -61.64 | 7.46 | -71.53 | 0.1130 | -0.2877 | |||
| PEB.PRE / Pebblebrook Hotel Trust - Preferred Stock | 0.38 | 0.00 | 6.74 | 2.39 | 0.1021 | 0.0015 | |||
| UE / Urban Edge Properties | 0.36 | -8.27 | 6.72 | -9.91 | 0.1019 | -0.0123 | |||
| WPC / W. P. Carey Inc. | 0.11 | 6.57 | 0.0996 | 0.0996 | |||||
| XIFR / XPLR Infrastructure, LP - Limited Partnership | 0.79 | 0.00 | 6.52 | -13.69 | 0.0988 | -0.0167 | |||
| ESRT / Empire State Realty Trust, Inc. | 0.67 | -41.48 | 5.46 | -39.47 | 0.0827 | -0.0552 | |||
| PDM / Piedmont Realty Trust, Inc. | 0.70 | -43.02 | 5.08 | -43.64 | 0.0770 | -0.0609 | |||
| AEE / Ameren Corporation | 0.05 | 1,344.14 | 4.79 | 1,282.95 | 0.0726 | 0.0672 | |||
| UNIT / Unity Group LLC | 1.00 | 0.00 | 4.32 | -14.27 | 0.0655 | -0.0116 | |||
| HST / Host Hotels & Resorts, Inc. | 0.12 | -91.26 | 1.81 | -90.55 | 0.0275 | -0.2663 | |||
| DRH / DiamondRock Hospitality Company | 0.23 | -91.69 | 1.75 | -91.75 | 0.0265 | -0.2982 | |||
| FCPT / Four Corners Property Trust, Inc. | 0.05 | -96.62 | 1.22 | -96.83 | 0.0185 | -0.5713 | |||
| CPK / Chesapeake Utilities Corporation | 0.01 | 119.05 | 1.05 | 105.26 | 0.0160 | 0.0081 | |||
| AWK / American Water Works Company, Inc. | 0.01 | -96.75 | 0.86 | -96.94 | 0.0131 | -0.4185 | |||
| AIV / Apartment Investment and Management Company | 0.08 | 7.04 | 0.66 | 5.29 | 0.0100 | 0.0004 | |||
| ES / Eversource Energy | 0.01 | -19.44 | 0.65 | -17.49 | 0.0099 | -0.0022 | |||
| MPW / Medical Properties Trust, Inc. | 0.10 | 0.00 | 0.43 | -28.52 | 0.0065 | -0.0027 | |||
| SKT / Tanger Inc. | 0.01 | -94.26 | 0.35 | -94.81 | 0.0053 | -0.0982 | |||
| KMI / Kinder Morgan, Inc. | 0.01 | -2.44 | 0.31 | 0.64 | 0.0047 | -0.0000 | |||
| PAGP / Plains GP Holdings, L.P. - Limited Partnership | 0.01 | -25.96 | 0.23 | -32.84 | 0.0034 | -0.0017 | |||
| FVR / FrontView REIT, Inc. | 0.00 | -100.00 | 0.00 | 0.0000 | |||||
| SITC / SITE Centers Corp. | 0.00 | -100.00 | 0.00 | 0.0000 | |||||
| ADC / Agree Realty Corporation | 0.00 | -100.00 | 0.00 | 0.0000 | |||||
| NI / NiSource Inc. | 0.00 | -100.00 | 0.00 | 0.0000 | |||||
| CURB / Curbline Properties Corp. | 0.00 | -100.00 | 0.00 | -100.00 | -0.0173 | ||||
| MAC / The Macerich Company | 0.00 | -100.00 | 0.00 | 0.0000 | |||||
| PEB / Pebblebrook Hotel Trust | 0.00 | -100.00 | 0.00 | 0.0000 | |||||
| KRC / Kilroy Realty Corporation | 0.00 | -100.00 | 0.00 | 0.0000 | |||||
| ED / Consolidated Edison, Inc. | 0.00 | -100.00 | 0.00 | 0.0000 | |||||
| DTE / DTE Energy Company | 0.00 | -100.00 | 0.00 | 0.0000 | |||||
| BNL / Broadstone Net Lease, Inc. | 0.00 | -100.00 | 0.00 | 0.0000 |