Statistik Asas
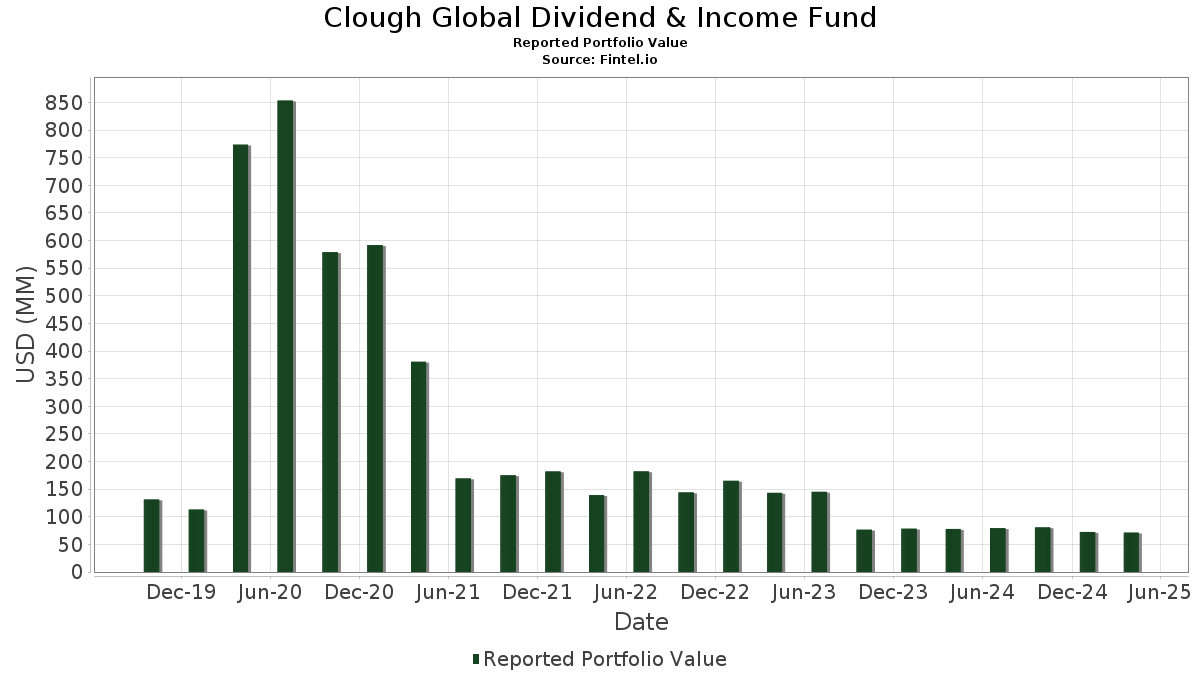
| Nilai Portfolio | $ 71,242,879 |
| Kedudukan Semasa | 106 |
Pegangan Terkini, Prestasi, AUM (dari 13F, 13D)
Clough Global Dividend & Income Fund telah mendedahkan 106 jumlah pegangan dalam pemfailan SEC terkini mereka. Nilai portfolio terkini dikira sebagai $ 71,242,879 USD. Aset Sebenar Di Bawah Pengurusan (AUM) ialah nilai ini ditambah dengan tunai (yang tidak didedahkan). Pegangan teratas Clough Global Dividend & Income Fund ialah Microsoft Corporation (US:MSFT) , Philip Morris International Inc. (US:PM) , JPMorgan Chase & Co. (US:JPM) , Airbus SE (FR:AIR) , and Citigroup Inc (US:US172967NB34) . Kedudukan baharu Clough Global Dividend & Income Fund termasuk Citigroup Inc (US:US172967NB34) , United States Treasury Note/Bond (US:US912810TT51) , Alibaba Group Holding Limited - Depositary Receipt (Common Stock) (US:BABA) , GE Vernova Inc. (US:GEV) , and Broadcom Inc (US:US11135FBG54) .
Kenaikan Teratas Suku Tahun Ini
Kami menggunakan perubahan dalam peruntukan portfolio kerana ini adalah metrik yang paling bermakna. Perubahan boleh disebabkan oleh perdagangan atau perubahan dalam harga saham.
| Sekuriti | Saham (MM) |
Nilai (MM$) |
Portfolio % | ΔPortfolio % |
|---|---|---|---|---|
| 0.00 | 1.98 | 2.6430 | 2.6430 | |
| 1.95 | 2.6028 | 2.6028 | ||
| 3.73 | 4.9619 | 2.3561 | ||
| 0.01 | 1.46 | 1.9404 | 1.9404 | |
| 0.01 | 1.23 | 1.6372 | 1.9398 | |
| 2.64 | 3.5093 | 1.8482 | ||
| 1.34 | 1.7795 | 1.7795 | ||
| 0.02 | 1.77 | 2.3570 | 1.3261 | |
| 0.00 | 0.96 | 1.2840 | 1.2840 | |
| 0.00 | 0.00 | 1.2819 |
Penurunan Teratas Suku Tahun Ini
Kami menggunakan perubahan dalam peruntukan portfolio kerana ini adalah metrik yang paling bermakna. Perubahan boleh disebabkan oleh perdagangan atau perubahan dalam harga saham.
| Sekuriti | Saham (MM) |
Nilai (MM$) |
Portfolio % | ΔPortfolio % |
|---|---|---|---|---|
| -0.01 | -0.72 | -0.9531 | -3.1130 | |
| 0.01 | 0.71 | 0.9479 | -2.3994 | |
| -0.00 | -0.88 | -1.1733 | -2.1460 | |
| -0.00 | -0.81 | -1.0726 | -1.6487 | |
| 1.45 | 1.45 | 1.9373 | -1.4770 | |
| 0.01 | 1.43 | 1.9103 | -1.4590 | |
| -0.01 | -1.09 | -1.4581 | -1.4581 | |
| -0.02 | -0.97 | -1.2929 | -1.2929 | |
| -0.00 | -0.97 | -1.2863 | -1.2863 | |
| -0.01 | -0.96 | -1.2836 | -1.2836 |
13F dan Pemfailan Dana
Borang ini telah difailkan pada 2025-06-26 untuk tempoh pelaporan 2025-04-30. Klik ikon pautan untuk melihat sejarah transaksi penuh.
Tingkatkan untuk membuka data premium dan eksport ke Excel ![]() .
.
| Sekuriti | Jenis | Purata Harga Saham | Saham (MM) |
ΔSaham (%) |
ΔSaham (%) |
Nilai ($MM) |
Portfolio (%) |
ΔPortfolio (%) |
|
|---|---|---|---|---|---|---|---|---|---|
| TRANSDIGM INC TDG 6 01/15/33 / DBT (US893647BW65) | 4.09 | 1.16 | 5.4403 | 0.1414 | |||||
| MSFT / Microsoft Corporation | 0.01 | 4.19 | 4.08 | -0.78 | 5.4270 | 0.0382 | |||
| US TREASURY N/B T 4 3/8 05/15/34 / DBT (US91282CKQ32) | 3.73 | 87.66 | 4.9619 | 2.3561 | |||||
| PM / Philip Morris International Inc. | 0.02 | 0.00 | 3.70 | 31.61 | 4.9293 | 1.2392 | |||
| JPM / JPMorgan Chase & Co. | 0.01 | 0.00 | 3.25 | -8.50 | 4.3328 | -0.3319 | |||
| AIR / Airbus SE | 0.02 | -20.00 | 3.14 | -23.10 | 4.1773 | -1.1735 | |||
| US172967NB34 / Citigroup Inc | 2.64 | 108.30 | 3.5093 | 1.8482 | |||||
| RIGG34 / Transocean Ltd. - Depositary Receipt (Common Stock) | 2.45 | 1.12 | 3.2569 | 0.0842 | |||||
| META / Meta Platforms, Inc. | 0.00 | 1.98 | 2.6430 | 2.6430 | |||||
| RTX / RTX Corporation | 0.02 | 31.95 | 1.98 | 29.09 | 2.6363 | 0.6238 | |||
| C / Citigroup Inc. - Depositary Receipt (Common Stock) | 1.95 | 2.6028 | 2.6028 | ||||||
| AAPL / Apple Inc. | 0.01 | 53.36 | 1.84 | 38.13 | 2.4564 | 0.7037 | |||
| AVGO / Broadcom Inc. | 0.01 | 29.17 | 1.79 | 12.37 | 2.3835 | 0.2934 | |||
| APH / Amphenol Corporation | 0.02 | 107.21 | 1.77 | 125.35 | 2.3570 | 1.3261 | |||
| US912810TT51 / United States Treasury Note/Bond | 1.63 | 1.75 | 2.1733 | 0.0691 | |||||
| CLF / Cleveland-Cliffs Inc. | 1.60 | 23.19 | 2.1298 | 0.4261 | |||||
| IBN / ICICI Bank Limited - Depositary Receipt (Common Stock) | 0.05 | 0.00 | 1.57 | 17.04 | 2.0961 | 0.3318 | |||
| NGL EN OP/FIN NGL 8 1/8 02/15/29 / DBT (US62922LAC28) | 1.49 | -8.38 | 1.9799 | -0.1491 | |||||
| M1GM34 / MGM Resorts International - Depositary Receipt (Common Stock) | 1.48 | 13.68 | 1.9699 | 0.2617 | |||||
| BABA / Alibaba Group Holding Limited - Depositary Receipt (Common Stock) | 0.01 | 1.46 | 1.9404 | 1.9404 | |||||
| US09248U7182 / BlackRock Liquidity Funds: T-Fund, Institutional Shares | 1.45 | -44.10 | 1.45 | -44.12 | 1.9373 | -1.4770 | |||
| MS / Morgan Stanley | 0.01 | -33.00 | 1.43 | -44.14 | 1.9103 | -1.4590 | |||
| EHC / Encompass Health Corporation | 0.01 | 0.00 | 1.43 | 17.84 | 1.9008 | 0.3117 | |||
| GD / General Dynamics Corporation | 0.01 | 24.13 | 1.40 | 31.46 | 1.8645 | 0.4669 | |||
| HII / Huntington Ingalls Industries, Inc. | 0.01 | 25.26 | 1.37 | 46.37 | 1.8252 | 0.5958 | |||
| PHM / PulteGroup, Inc. | 0.01 | 0.00 | 1.34 | -9.88 | 1.7869 | -0.1659 | |||
| US TREASURY N/B T 4 1/2 11/15/54 / DBT (US912810UE63) | 1.34 | 1.7795 | 1.7795 | ||||||
| PG / The Procter & Gamble Company | 0.01 | 0.00 | 1.32 | -2.08 | 1.7537 | -0.0105 | |||
| DHI / D.R. Horton, Inc. | 0.01 | 0.00 | 1.30 | -10.98 | 1.7280 | -0.1842 | |||
| BANK OF AMER CRP BAC 5.518 10/25/35 / DBT (US06051GMD87) | 1.28 | 0.24 | 1.6987 | 0.0296 | |||||
| DUK / Duke Energy Corporation | 0.01 | 0.00 | 1.27 | 9.02 | 1.6900 | 0.1618 | |||
| GE / General Electric Company | 0.01 | -325.93 | 1.23 | -560.30 | 1.6372 | 1.9398 | |||
| NVDA / NVIDIA Corporation | 0.01 | 63.64 | 1.18 | 34.25 | 1.5666 | 0.4812 | |||
| EG / Everest Group, Ltd. | 0.00 | 0.00 | 1.13 | 3.30 | 1.5029 | 0.0689 | |||
| CI / The Cigna Group | 0.00 | 0.00 | 1.12 | 15.67 | 1.4944 | 0.2205 | |||
| EXE / Expand Energy Corporation | 0.01 | -50.00 | 1.02 | -48.87 | 1.3602 | -1.2607 | |||
| GEV / GE Vernova Inc. | 0.00 | 0.96 | 1.2840 | 1.2840 | |||||
| AER / AerCap Holdings N.V. | 0.01 | 0.00 | 0.96 | 10.88 | 1.2761 | 0.1422 | |||
| BAC / Bank of America Corporation | 0.02 | 0.00 | 0.96 | -13.86 | 1.2746 | -0.1834 | |||
| LNG / Cheniere Energy, Inc. | 0.00 | -49.94 | 0.92 | -48.28 | 1.2219 | -1.1052 | |||
| FCX / Freeport-McMoRan Inc. | 0.02 | 0.00 | 0.88 | 0.45 | 1.1780 | 0.0232 | |||
| VZ / Verizon Communications Inc. | 0.02 | 0.00 | 0.82 | 11.89 | 1.0914 | 0.1301 | |||
| 3 Month SOFR Opt Mar28C 97.5 / DIR (N/A) | 0.81 | 1.0784 | 1.0784 | ||||||
| HON / Honeywell International Inc. | 0.00 | 0.00 | 0.78 | -5.93 | 1.0372 | -0.0489 | |||
| XOM / Exxon Mobil Corporation | 0.01 | -49.97 | 0.77 | -50.51 | 1.0283 | -1.0196 | |||
| ECL / Ecolab Inc. | 0.00 | 0.00 | 0.76 | 0.40 | 1.0146 | 0.0199 | |||
| BYDDY / BYD Company Limited - Depositary Receipt (Common Stock) | 0.02 | 0.00 | 0.76 | 36.09 | 1.0107 | 0.2798 | |||
| SPG / Simon Property Group, Inc. | 0.00 | 0.00 | 0.76 | -9.47 | 1.0060 | -0.0890 | |||
| FIHL / Fidelis Insurance Holdings Limited | 0.04 | 0.00 | 0.73 | -0.95 | 0.9755 | 0.0056 | |||
| CVX / Chevron Corporation | 0.01 | -50.00 | 0.72 | -54.40 | 0.9603 | -1.1146 | |||
| 000660 / SK hynix Inc. | 0.01 | -69.37 | 0.71 | -72.13 | 0.9479 | -2.3994 | |||
| GILD / Gilead Sciences, Inc. | 0.01 | 0.00 | 0.67 | 9.64 | 0.8939 | 0.0904 | |||
| UNH / UnitedHealth Group Incorporated | 0.00 | 19.23 | 0.64 | -14.95 | 0.8493 | -0.0434 | |||
| DELL / Dell Technologies Inc. | 0.01 | -40.00 | 0.58 | -46.90 | 0.7772 | -0.6637 | |||
| T / AT&T Inc. | 0.02 | 0.00 | 0.56 | 16.84 | 0.7489 | 0.1168 | |||
| C / Citigroup Inc. | 0.01 | -65.40 | 0.56 | -48.43 | 0.7467 | -0.4184 | |||
| 3 Month SOFR Opt Mar28C 98 / DIR (N/A) | 0.56 | 0.7430 | 0.7430 | ||||||
| STWD / Starwood Property Trust, Inc. | 0.03 | 0.00 | 0.55 | -0.90 | 0.7309 | 0.0048 | |||
| ETR / Entergy Corporation | 0.01 | -10.00 | 0.55 | -7.61 | 0.7277 | -0.0489 | |||
| VICI / VICI Properties Inc. | 0.02 | 0.00 | 0.53 | 7.54 | 0.7036 | 0.0591 | |||
| US11135FBG54 / Broadcom Inc | 0.53 | -0.57 | 0.6994 | 0.0055 | |||||
| VALE / Vale S.A. - Depositary Receipt (Common Stock) | 0.06 | 0.00 | 0.52 | 0.19 | 0.6980 | 0.0118 | |||
| SCHW / The Charles Schwab Corporation | 0.01 | 0.00 | 0.52 | -1.70 | 0.6938 | -0.0009 | |||
| MDT / Medtronic plc | 0.01 | 0.00 | 0.51 | -6.62 | 0.6773 | -0.0377 | |||
| US896442AG58 / Trinity Capital Inc | 0.49 | 2.10 | 0.6497 | 0.0236 | |||||
| JNJ / Johnson & Johnson | 0.00 | 0.00 | 0.49 | 2.75 | 0.6468 | 0.0265 | |||
| HSY / The Hershey Company | 0.00 | -221.74 | 0.47 | -236.44 | 0.6234 | 1.0738 | |||
| RRC / Range Resources Corporation | 0.01 | -34.46 | 0.45 | -40.00 | 0.6041 | -0.3873 | |||
| GOOG / Alphabet Inc. | 0.00 | 0.35 | 0.4650 | 0.4650 | |||||
| PRU / Prudential Financial, Inc. | 0.00 | 0.00 | 0.34 | -15.08 | 0.4514 | -0.0715 | |||
| US58547DAE94 / Melco Resorts Finance Ltd | 0.24 | -1.26 | 0.3148 | 0.0007 | |||||
| US172967MU24 / CITIGROUP INC JR SUBORDINA 12/99 VAR | 0.20 | -0.51 | 0.2611 | 0.0018 | |||||
| US83162CSE48 / United States Small Business Administration | 0.01 | 0.00 | 0.0190 | 0.0004 | |||||
| CAVA / CAVA Group, Inc. | 0.00 | -100.00 | 0.00 | -100.00 | 0.6113 | ||||
| HAYW / Hayward Holdings, Inc. | 0.00 | -100.00 | 0.00 | -100.00 | 0.5252 | ||||
| GIII / G-III Apparel Group, Ltd. | 0.00 | -100.00 | 0.00 | -100.00 | 0.2827 | ||||
| ABG / Asbury Automotive Group, Inc. | 0.00 | -100.00 | 0.00 | -100.00 | 0.9763 | ||||
| HOG / Harley-Davidson, Inc. | 0.00 | -100.00 | 0.00 | -100.00 | 0.3302 | ||||
| MU / Micron Technology, Inc. | 0.00 | -100.00 | 0.00 | -100.00 | -1.0284 | ||||
| GM / General Motors Company | 0.00 | -100.00 | 0.00 | -100.00 | 0.5971 | ||||
| ENR / Energizer Holdings, Inc. | 0.00 | -100.00 | 0.00 | -100.00 | 0.5307 | ||||
| DE / Deere & Company | 0.00 | -100.00 | 0.00 | -100.00 | 1.2819 | ||||
| BC / Brunswick Corporation | Short | -0.00 | -59.54 | -0.16 | -72.35 | -0.2159 | 0.5540 | ||
| LAD / Lithia Motors, Inc. | Short | -0.00 | -30.49 | -0.17 | -46.10 | -0.2222 | 0.1824 | ||
| AFRM / Affirm Holdings, Inc. | Short | -0.00 | -42.76 | -0.24 | -53.50 | -0.3194 | 0.3553 | ||
| 3 Month SOFR Opt Mar28C 99 / DIR (N/A) | -0.25 | -0.3354 | -0.3354 | ||||||
| MIDD / The Middleby Corporation | Short | -0.00 | -0.00 | -0.27 | -22.00 | -0.3641 | 0.0963 | ||
| PZZA / Papa John's International, Inc. | Short | -0.01 | -0.32 | -0.4323 | -0.4323 | ||||
| ROK / Rockwell Automation, Inc. | Short | -0.00 | -0.00 | -0.33 | -11.08 | -0.4387 | 0.0472 | ||
| R / Ryder System, Inc. | Short | -0.00 | -0.00 | -0.33 | -13.51 | -0.4437 | 0.0625 | ||
| 3 Month SOFR Opt Mar28C 98.5 / DIR (N/A) | -0.38 | -0.4997 | -0.4997 | ||||||
| MNST / Monster Beverage Corporation | Short | -0.01 | -37.17 | -0.43 | -22.55 | -0.5685 | 0.1538 | ||
| TTC / The Toro Company | Short | -0.01 | 3.28 | -0.43 | -15.19 | -0.5729 | 0.0936 | ||
| LOW / Lowe's Companies, Inc. | Short | -0.00 | -33.11 | -0.46 | -42.50 | -0.6074 | 0.4333 | ||
| SITE / SiteOne Landscape Supply, Inc. | Short | -0.00 | -0.00 | -0.46 | -19.33 | -0.6116 | 0.1353 | ||
| ARE / Alexandria Real Estate Equities, Inc. | Short | -0.01 | 6.56 | -0.47 | -20.40 | -0.6290 | 0.1502 | ||
| WSM / Williams-Sonoma, Inc. | Short | -0.00 | -0.48 | -0.6377 | -0.6377 | ||||
| IYT / iShares Trust - iShares U.S. Transportation ETF | Short | -0.01 | -0.49 | -0.6481 | -0.6481 | ||||
| SOFI / SoFi Technologies, Inc. | Short | -0.04 | 128.74 | -0.50 | 81.39 | -0.6631 | -0.3028 | ||
| VVV / Valvoline Inc. | Short | -0.02 | -0.00 | -0.53 | -7.71 | -0.7026 | 0.0472 | ||
| OSW / OneSpaWorld Holdings Limited | Short | -0.03 | -0.55 | -0.7384 | -0.7384 | ||||
| VRTX / Vertex Pharmaceuticals Incorporated | Short | -0.00 | -0.64 | -0.8482 | -0.8482 | ||||
| MRK / Merck & Co., Inc. | Short | -0.01 | -152.43 | -0.72 | -139.46 | -0.9531 | -3.1130 | ||
| ORCL / Oracle Corporation | Short | -0.01 | -0.74 | -0.9876 | -0.9876 | ||||
| IBM / International Business Machines Corporation | Short | -0.00 | -34.91 | -0.77 | -38.46 | -1.0299 | 0.6184 | ||
| LULU / lululemon athletica inc. | Short | -0.00 | -0.78 | -1.0421 | -1.0421 | ||||
| EME / EMCOR Group, Inc. | Short | -0.00 | -305.10 | -0.81 | -283.37 | -1.0726 | -1.6487 | ||
| F / Ford Motor Company | Short | -0.09 | 3.23 | -0.86 | 2.49 | -1.1504 | -0.0448 | ||
| PWR / Quanta Services, Inc. | Short | -0.00 | -224.90 | -0.88 | -218.76 | -1.1733 | -2.1460 | ||
| CHH / Choice Hotels International, Inc. | Short | -0.01 | 25.00 | -0.95 | 7.02 | -1.2596 | -0.0997 | ||
| STRL / Sterling Infrastructure, Inc. | Short | -0.01 | -0.96 | -1.2836 | -1.2836 | ||||
| DUOL / Duolingo, Inc. | Short | -0.00 | -0.97 | -1.2863 | -1.2863 | ||||
| DTG / Daimler Truck Holding AG | Short | -0.02 | -0.97 | -1.2929 | -1.2929 | ||||
| DLR / Digital Realty Trust, Inc. | Short | -0.01 | -1.09 | -1.4581 | -1.4581 | ||||
| KRE / SPDR Series Trust - SPDR S&P Regional Banking ETF | Short | -0.02 | 2.66 | -1.19 | 45.89 | -1.5838 | -0.5848 |