Statistik Asas
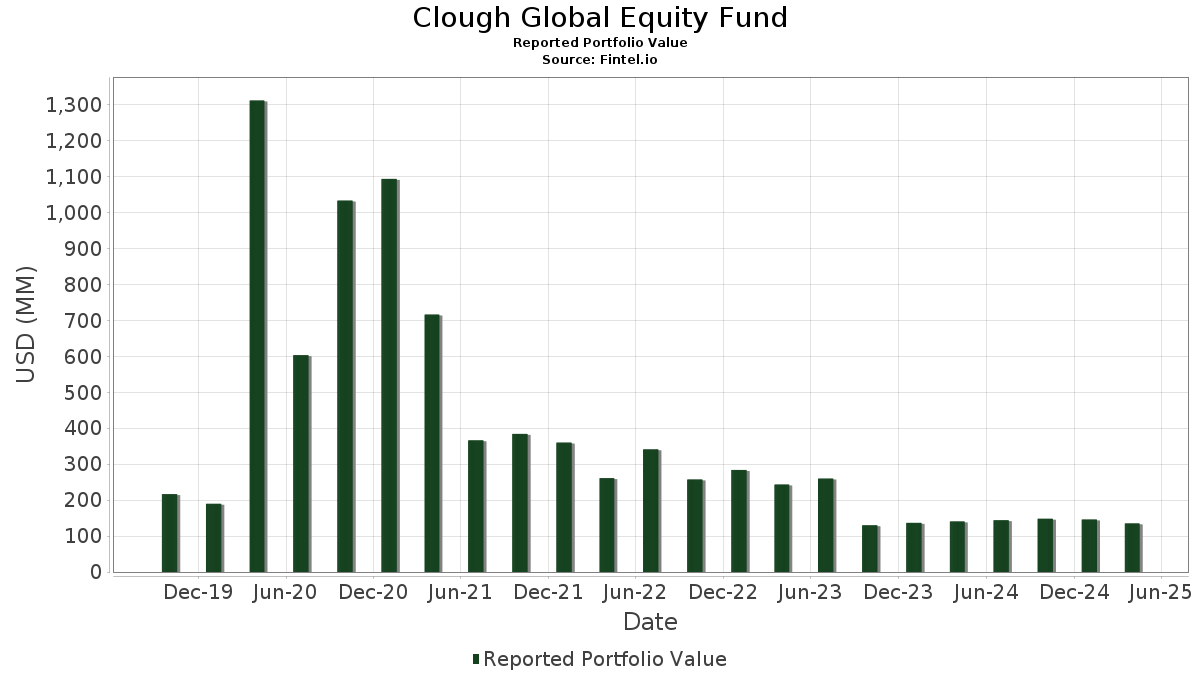
| Nilai Portfolio | $ 134,926,057 |
| Kedudukan Semasa | 98 |
Pegangan Terkini, Prestasi, AUM (dari 13F, 13D)
Clough Global Equity Fund telah mendedahkan 98 jumlah pegangan dalam pemfailan SEC terkini mereka. Nilai portfolio terkini dikira sebagai $ 134,926,057 USD. Aset Sebenar Di Bawah Pengurusan (AUM) ialah nilai ini ditambah dengan tunai (yang tidak didedahkan). Pegangan teratas Clough Global Equity Fund ialah Microsoft Corporation (US:MSFT) , Amazon.com, Inc. (US:AMZN) , Carnival Corporation & plc (US:CCL) , Philip Morris International Inc. (US:PM) , and Amphenol Corporation (US:APH) . Kedudukan baharu Clough Global Equity Fund termasuk Nu Holdings Ltd. (US:NU) , Criteo S.A. - Depositary Receipt (Common Stock) (GB:0I4T) , GE Vernova Inc. (US:GEV) , Magnite, Inc. (US:MGNI) , and Papa John's International, Inc. (US:PZZA) .
Kenaikan Teratas Suku Tahun Ini
Kami menggunakan perubahan dalam peruntukan portfolio kerana ini adalah metrik yang paling bermakna. Perubahan boleh disebabkan oleh perdagangan atau perubahan dalam harga saham.
| Sekuriti | Saham (MM) |
Nilai (MM$) |
Portfolio % | ΔPortfolio % |
|---|---|---|---|---|
| 0.01 | 2.10 | 1.5678 | 1.8749 | |
| 0.02 | 2.51 | 1.8742 | 1.8742 | |
| 0.37 | 6.70 | 5.0084 | 1.8162 | |
| 0.19 | 2.40 | 1.7972 | 1.7972 | |
| 0.08 | 5.86 | 4.3858 | 1.7569 | |
| 0.02 | 4.70 | 3.5139 | 1.4693 | |
| 0.04 | 6.29 | 4.7040 | 1.4593 | |
| 0.06 | 1.91 | 1.4307 | 1.4307 | |
| 0.04 | 3.60 | 2.6921 | 1.2784 | |
| 0.00 | 1.71 | 1.2759 | 1.2759 |
Penurunan Teratas Suku Tahun Ini
Kami menggunakan perubahan dalam peruntukan portfolio kerana ini adalah metrik yang paling bermakna. Perubahan boleh disebabkan oleh perdagangan atau perubahan dalam harga saham.
| Sekuriti | Saham (MM) |
Nilai (MM$) |
Portfolio % | ΔPortfolio % |
|---|---|---|---|---|
| -0.01 | -1.27 | -0.9495 | -3.1251 | |
| 0.02 | 3.99 | 2.9857 | -2.9184 | |
| 0.04 | 7.29 | 5.4542 | -2.5169 | |
| -0.01 | -1.37 | -1.0248 | -2.2149 | |
| 0.01 | 1.25 | 0.9340 | -2.1920 | |
| -0.00 | -1.37 | -1.0250 | -2.1647 | |
| -0.01 | -1.57 | -1.1756 | -2.1281 | |
| -0.00 | -1.23 | -0.9223 | -1.8896 | |
| 0.00 | 0.00 | -1.7389 | ||
| 0.01 | 3.41 | 2.5488 | -1.4158 |
13F dan Pemfailan Dana
Borang ini telah difailkan pada 2025-06-26 untuk tempoh pelaporan 2025-04-30. Klik ikon pautan untuk melihat sejarah transaksi penuh.
Tingkatkan untuk membuka data premium dan eksport ke Excel ![]() .
.
| Sekuriti | Jenis | Purata Harga Saham | Saham (MM) |
ΔSaham (%) |
ΔSaham (%) |
Nilai ($MM) |
Portfolio (%) |
ΔPortfolio (%) |
|
|---|---|---|---|---|---|---|---|---|---|
| MSFT / Microsoft Corporation | 0.02 | 12.81 | 9.50 | 7.44 | 7.1073 | 1.1014 | |||
| AMZN / Amazon.com, Inc. | 0.04 | -19.94 | 7.29 | -37.89 | 5.4542 | -2.5169 | |||
| CCL / Carnival Corporation & plc | 0.37 | 114.89 | 6.70 | 42.42 | 5.0084 | 1.8162 | |||
| PM / Philip Morris International Inc. | 0.04 | 0.00 | 6.29 | 31.60 | 4.7040 | 1.4593 | |||
| APH / Amphenol Corporation | 0.08 | 39.31 | 5.86 | 51.46 | 4.3858 | 1.7569 | |||
| US09248U7182 / BlackRock Liquidity Funds: T-Fund, Institutional Shares | 4.81 | -18.33 | 4.81 | -18.34 | 3.5977 | -0.4013 | |||
| AAPL / Apple Inc. | 0.02 | 44.69 | 4.81 | 30.26 | 3.5969 | 1.0906 | |||
| AVGO / Broadcom Inc. | 0.02 | 79.37 | 4.70 | 55.99 | 3.5139 | 1.4693 | |||
| IBN / ICICI Bank Limited - Depositary Receipt (Common Stock) | 0.14 | 22.67 | 4.63 | 43.60 | 3.4641 | 1.2740 | |||
| RCL / Royal Caribbean Cruises Ltd. | 0.02 | 6.14 | 4.61 | -14.44 | 3.4480 | -0.2106 | |||
| BA / The Boeing Company | 0.02 | 0.00 | 4.55 | 3.81 | 3.4052 | 0.4273 | |||
| AIR / Airbus SE | 0.03 | -20.00 | 4.47 | -23.08 | 3.3431 | -0.6026 | |||
| GOOG / Alphabet Inc. | 0.02 | -41.33 | 3.99 | -54.09 | 2.9857 | -2.9184 | |||
| JPM / JPMorgan Chase & Co. | 0.02 | 0.00 | 3.86 | -8.50 | 2.8909 | 0.0232 | |||
| WMT / Walmart Inc. | 0.04 | 74.49 | 3.60 | 72.95 | 2.6921 | 1.2784 | |||
| META / Meta Platforms, Inc. | 0.01 | -26.74 | 3.41 | -41.64 | 2.5488 | -1.4158 | |||
| DUK / Duke Energy Corporation | 0.02 | 36.59 | 2.96 | 48.84 | 2.2134 | 0.8633 | |||
| DHI / D.R. Horton, Inc. | 0.02 | 0.00 | 2.90 | -10.97 | 2.1664 | -0.0425 | |||
| PHM / PulteGroup, Inc. | 0.03 | 0.00 | 2.83 | -9.84 | 2.1185 | -0.0147 | |||
| RTX / RTX Corporation | 0.02 | -31.63 | 2.66 | -1.92 | 1.9887 | 0.1021 | |||
| HII / Huntington Ingalls Industries, Inc. | 0.01 | 25.50 | 2.61 | 46.54 | 1.9503 | 0.7421 | |||
| BYDDY / BYD Company Limited - Depositary Receipt (Common Stock) | 0.05 | 0.00 | 2.54 | 36.26 | 1.9030 | 0.6349 | |||
| BABA / Alibaba Group Holding Limited - Depositary Receipt (Common Stock) | 0.02 | 2.51 | 1.8742 | 1.8742 | |||||
| NU / Nu Holdings Ltd. | 0.19 | 2.40 | 1.7972 | 1.7972 | |||||
| BRK.A / Berkshire Hathaway Inc. | 0.00 | 0.00 | 2.40 | 13.95 | 1.7964 | 0.3651 | |||
| NOC / Northrop Grumman Corporation | 0.00 | 79.08 | 2.30 | 78.87 | 1.7223 | 0.8478 | |||
| JAZZ / Jazz Pharmaceuticals plc | 0.02 | 43.28 | 2.25 | 34.75 | 1.6797 | 0.5480 | |||
| PANW / Palo Alto Networks, Inc. | 0.01 | 57.89 | 2.24 | 60.10 | 1.6778 | 0.7261 | |||
| CI / The Cigna Group | 0.01 | 0.00 | 2.13 | 15.61 | 1.5896 | 0.3410 | |||
| GE / General Electric Company | 0.01 | -341.86 | 2.10 | -593.18 | 1.5678 | 1.8749 | |||
| DKNG / DraftKings Inc. | 0.06 | 0.00 | 2.08 | -20.68 | 1.5588 | -0.2244 | |||
| NVDA / NVIDIA Corporation | 0.02 | -24.50 | 2.00 | -38.05 | 1.4990 | -0.6973 | |||
| GD / General Dynamics Corporation | 0.01 | 44.94 | 1.95 | 53.51 | 1.4573 | 0.5953 | |||
| EG / Everest Group, Ltd. | 0.01 | 0.00 | 1.93 | 3.22 | 1.4413 | 0.1741 | |||
| 0I4T / Criteo S.A. - Depositary Receipt (Common Stock) | 0.06 | 1.91 | 1.4307 | 1.4307 | |||||
| FWONK / Formula One Group | 0.02 | 112.38 | 1.90 | 96.79 | 1.4226 | 0.7663 | |||
| AER / AerCap Holdings N.V. | 0.02 | 0.00 | 1.87 | 10.91 | 1.3998 | 0.2537 | |||
| EXE / Expand Energy Corporation | 0.02 | -49.99 | 1.84 | -48.88 | 1.3784 | -1.0684 | |||
| BKNG / Booking Holdings Inc. | 0.00 | 0.00 | 1.78 | 7.60 | 1.3350 | 0.2090 | |||
| LNG / Cheniere Energy, Inc. | 0.01 | -50.03 | 1.75 | -48.38 | 1.3086 | -0.9922 | |||
| PGR / The Progressive Corporation | 0.01 | 0.00 | 1.72 | 14.30 | 1.2855 | 0.2647 | |||
| GEV / GE Vernova Inc. | 0.00 | 1.71 | 1.2759 | 1.2759 | |||||
| ECL / Ecolab Inc. | 0.01 | 0.00 | 1.66 | 0.48 | 1.2412 | 0.1200 | |||
| MELI / MercadoLibre, Inc. | 0.00 | 0.00 | 1.52 | 21.30 | 1.1332 | 0.2848 | |||
| EHC / Encompass Health Corporation | 0.01 | 0.00 | 1.50 | 17.87 | 1.1201 | 0.2573 | |||
| HON / Honeywell International Inc. | 0.01 | 0.00 | 1.47 | -5.94 | 1.1021 | 0.0388 | |||
| DELL / Dell Technologies Inc. | 0.02 | -39.98 | 1.46 | -46.86 | 1.0940 | -0.7744 | |||
| BWXT / BWX Technologies, Inc. | 0.01 | 0.00 | 1.40 | -3.39 | 1.0447 | 0.0632 | |||
| FCX / Freeport-McMoRan Inc. | 0.04 | 0.00 | 1.37 | 0.52 | 1.0214 | 0.0988 | |||
| UNH / UnitedHealth Group Incorporated | 0.00 | -10.81 | 1.36 | -32.39 | 1.0156 | -0.3474 | |||
| BKD / Brookdale Senior Living Inc. | 0.20 | 76.80 | 1.34 | 78.53 | 1.0020 | 0.7210 | |||
| MGNI / Magnite, Inc. | 0.11 | 1.34 | 1.0014 | 1.0014 | |||||
| PDD / PDD Holdings Inc. - Depositary Receipt (Common Stock) | 0.01 | -44.30 | 1.33 | -51.23 | 0.9949 | -0.8567 | |||
| RDDT / Reddit, Inc. | 0.01 | -14.97 | 1.31 | -50.34 | 0.9809 | -0.8118 | |||
| FIHL / Fidelis Insurance Holdings Limited | 0.08 | 0.00 | 1.29 | -0.92 | 0.9673 | 0.0811 | |||
| 000660 / SK hynix Inc. | 0.01 | -70.22 | 1.25 | -72.89 | 0.9340 | -2.1920 | |||
| HQY / HealthEquity, Inc. | 0.01 | -50.17 | 1.23 | -61.34 | 0.9169 | -1.2350 | |||
| SCHW / The Charles Schwab Corporation | 0.01 | 0.00 | 1.11 | -1.51 | 0.8280 | 0.0641 | |||
| HSY / The Hershey Company | 0.01 | -241.86 | 1.02 | -258.97 | 0.7628 | 1.1986 | |||
| C / Citigroup Inc. | 0.01 | -31.94 | 1.01 | 1.52 | 0.7519 | 0.0820 | |||
| PG / The Procter & Gamble Company | 0.01 | 0.00 | 0.99 | -2.08 | 0.7418 | 0.0542 | |||
| RRC / Range Resources Corporation | 0.02 | -36.15 | 0.84 | -41.52 | 0.6271 | -0.3462 | |||
| CVX / Chevron Corporation | 0.00 | -50.00 | 0.67 | -54.45 | 0.4987 | -0.4941 | |||
| OFIX / Orthofix Medical Inc. | 0.05 | 0.00 | 0.66 | -24.08 | 0.4952 | -0.0972 | |||
| RIG / Transocean Ltd. | 0.24 | -49.99 | 0.51 | -72.87 | 0.3836 | -0.8980 | |||
| SPG / Simon Property Group, Inc. | 0.00 | 0.00 | 0.50 | -9.53 | 0.3767 | -0.0011 | |||
| ETR / Entergy Corporation | 0.01 | -32.71 | 0.47 | -30.98 | 0.3516 | -0.1109 | |||
| CAVA / CAVA Group, Inc. | 0.00 | -100.00 | 0.00 | -100.00 | 0.6052 | ||||
| GIII / G-III Apparel Group, Ltd. | 0.00 | -100.00 | 0.00 | -100.00 | 0.2565 | ||||
| DE / Deere & Company | 0.00 | -100.00 | 0.00 | -100.00 | 1.2588 | ||||
| GM / General Motors Company | 0.00 | -100.00 | 0.00 | -100.00 | 0.5777 | ||||
| HOG / Harley-Davidson, Inc. | 0.00 | -100.00 | 0.00 | -100.00 | 0.3234 | ||||
| MC / Moelis & Company | 0.00 | -100.00 | 0.00 | -100.00 | -1.0632 | ||||
| ABG / Asbury Automotive Group, Inc. | 0.00 | -100.00 | 0.00 | -100.00 | 0.8989 | ||||
| ENR / Energizer Holdings, Inc. | 0.00 | -100.00 | 0.00 | -100.00 | 0.5147 | ||||
| HAYW / Hayward Holdings, Inc. | 0.00 | -100.00 | 0.00 | -100.00 | 0.4883 | ||||
| COIN / Coinbase Global, Inc. | 0.00 | -100.00 | 0.00 | -100.00 | -1.7389 | ||||
| ALV / Autoliv, Inc. | 0.00 | -100.00 | 0.00 | -100.00 | -0.9845 | ||||
| LAD / Lithia Motors, Inc. | Short | -0.00 | -31.82 | -0.31 | -46.98 | -0.2299 | 0.1634 | ||
| BC / Brunswick Corporation | Short | -0.01 | 23.18 | -0.31 | -15.99 | -0.2325 | 0.0185 | ||
| AFRM / Affirm Holdings, Inc. | Short | -0.01 | -43.14 | -0.45 | -53.74 | -0.3380 | 0.3243 | ||
| MIDD / The Middleby Corporation | Short | -0.00 | -0.00 | -0.51 | -22.04 | -0.3840 | 0.0634 | ||
| PZZA / Papa John's International, Inc. | Short | -0.02 | -0.57 | -0.4262 | -0.4262 | ||||
| ROK / Rockwell Automation, Inc. | Short | -0.00 | -0.00 | -0.63 | -11.08 | -0.4687 | 0.0096 | ||
| R / Ryder System, Inc. | Short | -0.00 | -0.00 | -0.64 | -13.69 | -0.4768 | 0.0244 | ||
| TTC / The Toro Company | Short | -0.01 | -0.90 | -0.75 | -18.72 | -0.5618 | 0.0658 | ||
| MNST / Monster Beverage Corporation | Short | -0.01 | -37.26 | -0.80 | -22.58 | -0.5981 | 0.1031 | ||
| ARE / Alexandria Real Estate Equities, Inc. | Short | -0.01 | -1.74 | -0.82 | -26.63 | -0.6141 | 0.1461 | ||
| IYT / iShares Trust - iShares U.S. Transportation ETF | Short | -0.01 | -0.86 | -0.6461 | -0.6461 | ||||
| WSM / Williams-Sonoma, Inc. | Short | -0.01 | -0.87 | -0.6470 | -0.6470 | ||||
| LOW / Lowe's Companies, Inc. | Short | -0.00 | -32.93 | -0.87 | -42.37 | -0.6505 | 0.3737 | ||
| SITE / SiteOne Landscape Supply, Inc. | Short | -0.01 | -0.00 | -0.87 | -19.33 | -0.6527 | 0.0817 | ||
| SOFI / SoFi Technologies, Inc. | Short | -0.08 | 129.31 | -0.95 | 81.80 | -0.7102 | -0.3555 | ||
| OSW / OneSpaWorld Holdings Limited | Short | -0.06 | -0.99 | -0.7382 | -0.7382 | ||||
| VVV / Valvoline Inc. | Short | -0.03 | -0.00 | -1.00 | -7.66 | -0.7483 | -0.0125 | ||
| VRTX / Vertex Pharmaceuticals Incorporated | Short | -0.00 | -161.34 | -1.23 | -188.70 | -0.9223 | -1.8896 | ||
| MRK / Merck & Co., Inc. | Short | -0.01 | -151.77 | -1.27 | -138.99 | -0.9495 | -3.1251 | ||
| ORCL / Oracle Corporation | Short | -0.01 | -1.32 | -0.9894 | -0.9894 | ||||
| IBM / International Business Machines Corporation | Short | -0.01 | -36.03 | -1.37 | -39.51 | -1.0245 | 0.5128 | ||
| LULU / lululemon athletica inc. | Short | -0.01 | -185.98 | -1.37 | -178.15 | -1.0248 | -2.2149 | ||
| EME / EMCOR Group, Inc. | Short | -0.00 | -191.30 | -1.37 | -181.64 | -1.0250 | -2.1647 | ||
| F / Ford Motor Company | Short | -0.15 | -4.93 | -1.51 | -5.58 | -1.1268 | -0.0433 | ||
| PWR / Quanta Services, Inc. | Short | -0.01 | -217.76 | -1.57 | -212.05 | -1.1756 | -2.1281 | ||
| STRL / Sterling Infrastructure, Inc. | Short | -0.01 | -1.63 | -1.2228 | -1.2228 | ||||
| DTG / Daimler Truck Holding AG | Short | -0.04 | -1.70 | -1.2712 | -1.2712 | ||||
| DUOL / Duolingo, Inc. | Short | -0.00 | -1.74 | -1.3051 | -1.3051 | ||||
| CHH / Choice Hotels International, Inc. | Short | -0.01 | 21.93 | -1.75 | 4.35 | -1.3112 | -0.1707 | ||
| DLR / Digital Realty Trust, Inc. | Short | -0.01 | -1.86 | -1.3905 | -1.3905 | ||||
| KRE / SPDR Series Trust - SPDR S&P Regional Banking ETF | Short | -0.04 | 4.89 | -2.12 | 48.88 | -1.5883 | -0.6228 |