Statistik Asas
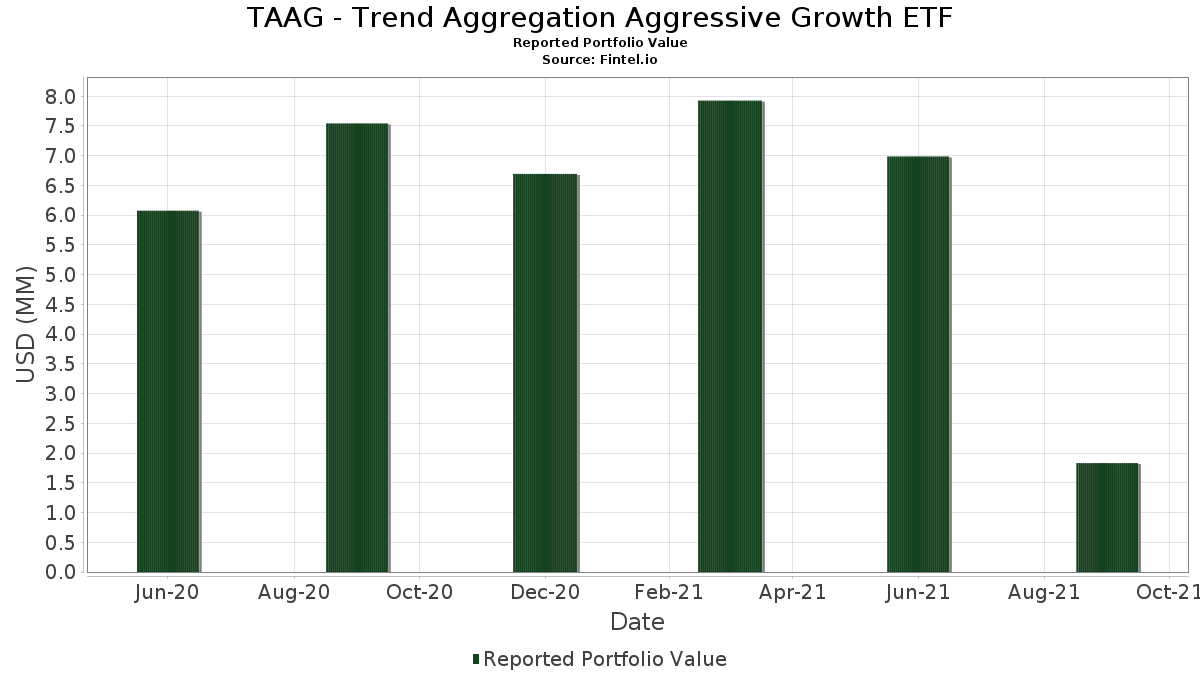
| Nilai Portfolio | $ 1,831,749 |
| Kedudukan Semasa | 43 |
Pegangan Terkini, Prestasi, AUM (dari 13F, 13D)
TAAG - Trend Aggregation Aggressive Growth ETF telah mendedahkan 43 jumlah pegangan dalam pemfailan SEC terkini mereka. Nilai portfolio terkini dikira sebagai $ 1,831,749 USD. Aset Sebenar Di Bawah Pengurusan (AUM) ialah nilai ini ditambah dengan tunai (yang tidak didedahkan). Pegangan teratas TAAG - Trend Aggregation Aggressive Growth ETF ialah Cabot Oil & Gas Corp. (US:COG) , Playtika Holding Corp. (US:PLTK) , Continental Resources Inc (OKLA) (US:CLR) , DISH Network Corporation (US:DISH) , and KBR, Inc. (US:KBR) . Kedudukan baharu TAAG - Trend Aggregation Aggressive Growth ETF termasuk Cabot Oil & Gas Corp. (US:COG) , Playtika Holding Corp. (US:PLTK) , Continental Resources Inc (OKLA) (US:CLR) , DISH Network Corporation (US:DISH) , and KBR, Inc. (US:KBR) .
Kenaikan Teratas Suku Tahun Ini
Kami menggunakan perubahan dalam peruntukan portfolio kerana ini adalah metrik yang paling bermakna. Perubahan boleh disebabkan oleh perdagangan atau perubahan dalam harga saham.
| Sekuriti | Saham (MM) |
Nilai (MM$) |
Portfolio % | ΔPortfolio % |
|---|---|---|---|---|
| 0.00 | 0.05 | 2.5500 | 2.5500 | |
| 0.00 | 0.05 | 2.5389 | 2.5389 | |
| 0.00 | 0.05 | 2.4870 | 2.4870 | |
| 0.00 | 0.05 | 2.4852 | 2.4852 | |
| 0.00 | 0.05 | 2.4352 | 2.4352 | |
| 0.00 | 0.05 | 2.4034 | 2.4034 | |
| 0.00 | 0.05 | 2.4031 | 2.4031 | |
| 0.00 | 0.05 | 2.3935 | 2.3935 | |
| 0.00 | 0.04 | 2.3779 | 2.3779 | |
| 0.00 | 0.04 | 2.3750 | 2.3750 |
Penurunan Teratas Suku Tahun Ini
Kami menggunakan perubahan dalam peruntukan portfolio kerana ini adalah metrik yang paling bermakna. Perubahan boleh disebabkan oleh perdagangan atau perubahan dalam harga saham.
| Sekuriti | Saham (MM) |
Nilai (MM$) |
Portfolio % | ΔPortfolio % |
|---|---|---|---|---|
| 0.00 | 0.00 | -1.2242 | ||
| 0.00 | 0.00 | -1.1826 | ||
| 0.00 | 0.00 | -1.1754 | ||
| 0.00 | 0.00 | -1.1695 | ||
| 0.00 | 0.00 | -1.1692 | ||
| 0.00 | 0.00 | -1.1668 | ||
| 0.00 | 0.00 | -1.1600 | ||
| 0.00 | 0.00 | -1.1582 | ||
| 0.00 | 0.00 | -1.1559 | ||
| 0.00 | 0.00 | -1.1550 |
13F dan Pemfailan Dana
Borang ini telah difailkan pada 2021-11-26 untuk tempoh pelaporan 2021-09-30. Klik ikon pautan untuk melihat sejarah transaksi penuh.
Tingkatkan untuk membuka data premium dan eksport ke Excel ![]() .
.
| Sekuriti | Jenis | Purata Harga Saham | Saham (MM) |
ΔSaham (%) |
ΔSaham (%) |
Nilai ($MM) |
Portfolio (%) |
ΔPortfolio (%) |
|
|---|---|---|---|---|---|---|---|---|---|
| COG / Cabot Oil & Gas Corp. | 0.00 | 0.05 | 2.5500 | 2.5500 | |||||
| PLTK / Playtika Holding Corp. | 0.00 | 0.05 | 2.5389 | 2.5389 | |||||
| CLR / Continental Resources Inc (OKLA) | 0.00 | 0.05 | 2.4870 | 2.4870 | |||||
| DISH / DISH Network Corporation | 0.00 | 0.05 | 2.4852 | 2.4852 | |||||
| KBR / KBR, Inc. | 0.00 | 0.05 | 2.4352 | 2.4352 | |||||
| CYXT / Cyxtera Technologies Inc - Class A | 0.00 | 0.05 | 2.4034 | 2.4034 | |||||
| DBI / Designer Brands Inc. | 0.00 | 0.05 | 2.4031 | 2.4031 | |||||
| SNDL / SNDL Inc. | 0.07 | -20.52 | 0.05 | -43.04 | 2.4019 | 1.2773 | |||
| X / United States Steel Corporation | 0.00 | -40.34 | 0.05 | -45.12 | 2.3971 | 1.2300 | |||
| CHPT / ChargePoint Holdings, Inc. | 0.00 | 0.05 | 2.3935 | 2.3935 | |||||
| GCMG / GCM Grosvenor Inc. | 0.00 | 0.04 | 2.3779 | 2.3779 | |||||
| FCNCA / First Citizens BancShares, Inc. | 0.00 | 0.04 | 2.3750 | 2.3750 | |||||
| IRM / Iron Mountain Incorporated | 0.00 | 0.04 | 2.3392 | 2.3392 | |||||
| SPCE / Virgin Galactic Holdings, Inc. | 0.00 | 18.90 | 0.04 | -34.85 | 2.3261 | 1.3802 | |||
| CHWY / Chewy, Inc. | 0.00 | -36.56 | 0.04 | -46.25 | 2.3239 | 1.1838 | |||
| DISCA / Discovery Inc - Class A | 0.00 | -35.47 | 0.04 | -46.25 | 2.2944 | 1.1514 | |||
| AAL / American Airlines Group Inc. | 0.00 | -42.70 | 0.04 | -44.16 | 2.2869 | 1.1898 | |||
| GTLS / Chart Industries, Inc. | 0.00 | -61.80 | 0.04 | -51.16 | 2.2852 | 1.0673 | |||
| WOOF / Petco Health and Wellness Company, Inc. | 0.00 | -43.58 | 0.04 | -47.50 | 2.2809 | 1.1391 | |||
| KIDS / OrthoPediatrics Corp. | 0.00 | 0.04 | 2.2804 | 2.2804 | |||||
| VICI / VICI Properties Inc. | 0.00 | -40.85 | 0.04 | -46.84 | 2.2784 | 1.1600 | |||
| M / Macy's, Inc. | 0.00 | -54.34 | 0.04 | -46.15 | 2.2737 | 1.1627 | |||
| AMC / AMC Entertainment Holdings, Inc. | 0.00 | -25.51 | 0.04 | -50.59 | 2.2675 | 1.0619 | |||
| NCLH / Norwegian Cruise Line Holdings Ltd. | 0.00 | -39.11 | 0.04 | -45.45 | 2.2655 | 1.1762 | |||
| GME / GameStop Corp. | 0.00 | -37.63 | 0.04 | -49.40 | 2.2567 | 1.0825 | |||
| OPK / OPKO Health, Inc. | 0.01 | 0.04 | 2.2508 | 2.2508 | |||||
| TDOC / Teladoc Health, Inc. | 0.00 | -32.45 | 0.04 | -48.15 | 2.2442 | 1.0856 | |||
| PTON / Peloton Interactive, Inc. | 0.00 | 0.04 | 2.2391 | 2.2391 | |||||
| DKNG / DraftKings Inc. | 0.00 | -44.47 | 0.04 | -48.78 | 2.2370 | 1.0765 | |||
| HOOD / Robinhood Markets, Inc. | 0.00 | 0.04 | 2.2341 | 2.2341 | |||||
| LPSN / LivePerson, Inc. | 0.00 | 0.04 | 2.2150 | 2.2150 | |||||
| CVNA / Carvana Co. | 0.00 | -49.08 | 0.04 | -49.38 | 2.2115 | 1.0556 | |||
| ESTC / Elastic N.V. | 0.00 | 0.04 | 2.2092 | 2.2092 | |||||
| FATE / Fate Therapeutics, Inc. | 0.00 | -28.07 | 0.04 | -50.60 | 2.1797 | 0.9998 | |||
| POLY / Plantronics, Inc. | 0.00 | 0.04 | 2.1753 | 2.1753 | |||||
| W / Wayfair Inc. | 0.00 | -36.76 | 0.04 | -49.37 | 2.1727 | 1.0438 | |||
| QS / QuantumScape Corporation | 0.00 | 0.04 | 2.1663 | 2.1663 | |||||
| / Jaws Acquisition Corp | 0.00 | 0.04 | 2.1497 | 2.1497 | |||||
| PD / PagerDuty, Inc. | 0.00 | 0.04 | 2.1198 | 2.1198 | |||||
| CDLX / Cardlytics, Inc. | 0.00 | -27.34 | 0.04 | -51.85 | 2.0744 | 0.9263 | |||
| SDC / Smiledirectclub Inc - Class A | 0.01 | 0.04 | 1.9206 | 1.9206 | |||||
| DATS / Myseum, Inc. | 0.00 | 0.04 | 1.9072 | 1.9072 | |||||
| CITIBANK NA DDCA 0.07% 10/1/2021 / STIV (N/A) | 0.03 | 0.03 | 1.6369 | 1.6369 | |||||
| ATH / Athene Holding Ltd - Class A | 0.00 | -100.00 | 0.00 | -100.00 | -1.1600 | ||||
| V / Visa Inc. | 0.00 | -100.00 | 0.00 | -100.00 | -1.1334 | ||||
| AAPL / Apple Inc. | 0.00 | -100.00 | 0.00 | -100.00 | -1.1826 | ||||
| PFE / Pfizer Inc. | 0.00 | -100.00 | 0.00 | -100.00 | -1.1550 | ||||
| VRT / Vertiv Holdings Co | 0.00 | -100.00 | 0.00 | -100.00 | -1.1559 | ||||
| BYND / Beyond Meat, Inc. | 0.00 | -100.00 | 0.00 | -100.00 | -1.2242 | ||||
| TMUS / T-Mobile US, Inc. | 0.00 | -100.00 | 0.00 | -100.00 | -1.1462 | ||||
| MSFT / Microsoft Corporation | 0.00 | -100.00 | 0.00 | -100.00 | -1.1754 | ||||
| AMZN / Amazon.com, Inc. | 0.00 | -100.00 | 0.00 | -100.00 | -1.1668 | ||||
| META / Meta Platforms, Inc. | 0.00 | -100.00 | 0.00 | -100.00 | -1.1695 | ||||
| BDX / Becton, Dickinson and Company | 0.00 | -100.00 | 0.00 | -100.00 | -1.1582 | ||||
| CAR / Avis Budget Group, Inc. | 0.00 | -100.00 | 0.00 | -100.00 | -1.1085 | ||||
| MNST / Monster Beverage Corporation | 0.00 | -100.00 | 0.00 | -100.00 | -1.1400 | ||||
| IDXX / IDEXX Laboratories, Inc. | 0.00 | -100.00 | 0.00 | -100.00 | -1.1692 |