Statistik Asas
| Nilai Portfolio | $ 166,814,381 |
| Kedudukan Semasa | 99 |
Pegangan Terkini, Prestasi, AUM (dari 13F, 13D)
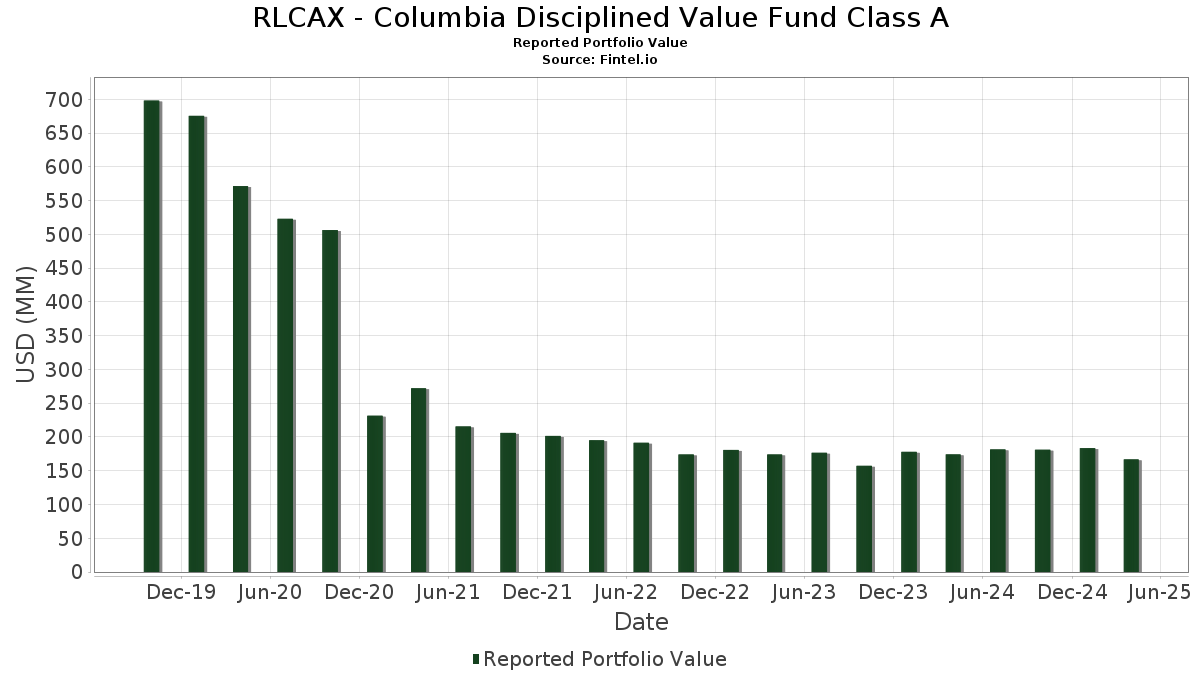
RLCAX - Columbia Disciplined Value Fund Class A telah mendedahkan 99 jumlah pegangan dalam pemfailan SEC terkini mereka. Nilai portfolio terkini dikira sebagai $ 166,814,381 USD. Aset Sebenar Di Bawah Pengurusan (AUM) ialah nilai ini ditambah dengan tunai (yang tidak didedahkan). Pegangan teratas RLCAX - Columbia Disciplined Value Fund Class A ialah JPMorgan Chase & Co. (US:JPM) , Exxon Mobil Corporation (US:XOM) , AT&T Inc. (US:T) , CME Group Inc. (US:CME) , and Berkshire Hathaway Inc. (US:BRK.B) . Kedudukan baharu RLCAX - Columbia Disciplined Value Fund Class A termasuk Valmont Industries, Inc. (US:VMI) , Virtu Financial, Inc. (US:VIRT) , The Scotts Miracle-Gro Company (US:SMG) , The TJX Companies, Inc. (US:TJX) , and Premier, Inc. (US:PINC) .
Kenaikan Teratas Suku Tahun Ini
Kami menggunakan perubahan dalam peruntukan portfolio kerana ini adalah metrik yang paling bermakna. Perubahan boleh disebabkan oleh perdagangan atau perubahan dalam harga saham.
| Sekuriti | Saham (MM) |
Nilai (MM$) |
Portfolio % | ΔPortfolio % |
|---|---|---|---|---|
| 0.06 | 2.82 | 1.6892 | 1.5223 | |
| 0.03 | 1.53 | 0.9163 | 0.9163 | |
| 0.02 | 1.35 | 0.8077 | 0.8077 | |
| 0.00 | 1.21 | 0.7253 | 0.7253 | |
| 0.00 | 2.11 | 1.2635 | 0.6309 | |
| 0.01 | 3.67 | 2.2011 | 0.5990 | |
| 0.02 | 0.95 | 0.5720 | 0.5720 | |
| 0.02 | 0.90 | 0.5382 | 0.5382 | |
| 0.01 | 1.00 | 0.6010 | 0.4452 | |
| 0.01 | 3.45 | 2.0672 | 0.4418 |
Penurunan Teratas Suku Tahun Ini
Kami menggunakan perubahan dalam peruntukan portfolio kerana ini adalah metrik yang paling bermakna. Perubahan boleh disebabkan oleh perdagangan atau perubahan dalam harga saham.
| Sekuriti | Saham (MM) |
Nilai (MM$) |
Portfolio % | ΔPortfolio % |
|---|---|---|---|---|
| 0.02 | 0.56 | 0.3383 | -1.7413 | |
| 0.00 | 0.32 | 0.1924 | -1.4059 | |
| 0.01 | 0.50 | 0.2998 | -1.1438 | |
| 0.01 | 0.96 | 0.5746 | -0.6215 | |
| 0.01 | 2.27 | 1.3616 | -0.6058 | |
| 0.00 | 0.39 | 0.2351 | -0.5431 | |
| 0.00 | 0.00 | -0.5039 | ||
| 0.03 | 7.30 | 4.3822 | -0.4142 | |
| 0.07 | 2.48 | 1.4899 | -0.3972 | |
| 0.00 | 0.51 | 0.3073 | -0.3628 |
13F dan Pemfailan Dana
Borang ini telah difailkan pada 2025-06-25 untuk tempoh pelaporan 2025-04-30. Klik ikon pautan untuk melihat sejarah transaksi penuh.
Tingkatkan untuk membuka data premium dan eksport ke Excel ![]() .
.
| Sekuriti | Jenis | Purata Harga Saham | Saham (MM) |
ΔSaham (%) |
ΔSaham (%) |
Nilai ($MM) |
Portfolio (%) |
ΔPortfolio (%) |
|
|---|---|---|---|---|---|---|---|---|---|
| JPM / JPMorgan Chase & Co. | 0.03 | -9.31 | 7.30 | -17.00 | 4.3822 | -0.4142 | |||
| XOM / Exxon Mobil Corporation | 0.04 | -2.97 | 4.62 | -4.07 | 2.7710 | 0.1472 | |||
| T / AT&T Inc. | 0.15 | -19.25 | 4.22 | -5.74 | 2.5329 | 0.0919 | |||
| CME / CME Group Inc. | 0.01 | -16.59 | 3.69 | -2.28 | 2.2134 | 0.1557 | |||
| BRK.B / Berkshire Hathaway Inc. | 0.01 | 9.69 | 3.67 | 24.80 | 2.2011 | 0.5990 | |||
| MO / Altria Group, Inc. | 0.06 | -15.88 | 3.61 | -4.73 | 2.1656 | 0.1006 | |||
| C / Citigroup Inc. | 0.05 | -2.97 | 3.59 | -18.51 | 2.1523 | -0.2473 | |||
| CVX / Chevron Corporation | 0.03 | -2.97 | 3.57 | -11.52 | 2.1441 | -0.0570 | |||
| SBAC / SBA Communications Corporation | 0.01 | -6.23 | 3.45 | 15.53 | 2.0672 | 0.4418 | |||
| CAT / Caterpillar Inc. | 0.01 | -2.97 | 3.37 | -19.20 | 2.0202 | -0.2513 | |||
| CSCO / Cisco Systems, Inc. | 0.05 | 2.33 | 3.01 | -2.50 | 1.8037 | 0.1230 | |||
| 19766H239 / COLUMBIA SHORT TERM CASH FUND | 2.99 | -19.09 | 2.99 | -19.12 | 1.7947 | -0.2208 | |||
| ADP / Automatic Data Processing, Inc. | 0.01 | -11.59 | 2.95 | -12.30 | 1.7708 | -0.0632 | |||
| CRM / Salesforce, Inc. | 0.01 | -2.96 | 2.86 | -23.70 | 1.7155 | -0.3267 | |||
| PCG / PG&E Corporation | 0.17 | -2.97 | 2.83 | 2.43 | 1.6969 | 0.1919 | |||
| FOXA / Fox Corporation | 0.06 | 844.99 | 2.82 | 819.93 | 1.6892 | 1.5223 | |||
| BLK / BlackRock, Inc. | 0.00 | -2.97 | 2.81 | -17.51 | 1.6845 | -0.1707 | |||
| MTG / MGIC Investment Corporation | 0.11 | -2.97 | 2.80 | -5.37 | 1.6824 | 0.0675 | |||
| QCOM / QUALCOMM Incorporated | 0.02 | 5.69 | 2.73 | -9.26 | 1.6351 | -0.0019 | |||
| SNA / Snap-on Incorporated | 0.01 | 7.40 | 2.68 | -5.10 | 1.6067 | 0.0687 | |||
| JAZZ / Jazz Pharmaceuticals plc | 0.02 | 28.11 | 2.63 | 20.51 | 1.5755 | 0.3876 | |||
| MET / MetLife, Inc. | 0.03 | -2.97 | 2.56 | -15.46 | 1.5354 | -0.1146 | |||
| JLL / Jones Lang LaSalle Incorporated | 0.01 | -2.98 | 2.52 | -21.97 | 1.5125 | -0.2485 | |||
| ETR / Entergy Corporation | 0.03 | 4.09 | 2.50 | 6.76 | 1.4980 | 0.2235 | |||
| VTRS / Viatris Inc. | 0.30 | 9.62 | 2.49 | -18.18 | 1.4935 | -0.1645 | |||
| JHG / Janus Henderson Group plc | 0.07 | -2.97 | 2.48 | -28.28 | 1.4899 | -0.3972 | |||
| PHM / PulteGroup, Inc. | 0.02 | -2.97 | 2.47 | -12.52 | 1.4844 | -0.0570 | |||
| FDX / FedEx Corporation | 0.01 | -2.98 | 2.37 | -22.96 | 1.4236 | -0.2549 | |||
| PM / Philip Morris International Inc. | 0.01 | -2.97 | 2.34 | 27.71 | 1.4049 | 0.4055 | |||
| EME / EMCOR Group, Inc. | 0.01 | -2.98 | 2.31 | -13.23 | 1.3847 | -0.0651 | |||
| RL / Ralph Lauren Corporation | 0.01 | -30.21 | 2.27 | -37.13 | 1.3616 | -0.6058 | |||
| FI / Fiserv, Inc. | 0.01 | -2.97 | 2.26 | -17.13 | 1.3535 | -0.1297 | |||
| OC / Owens Corning | 0.02 | -6.31 | 2.25 | -26.17 | 1.3490 | -0.3110 | |||
| MTZ / MasTec, Inc. | 0.02 | -2.97 | 2.25 | -14.86 | 1.3478 | -0.0901 | |||
| THC / Tenet Healthcare Corporation | 0.02 | -2.97 | 2.20 | -1.52 | 1.3218 | 0.1021 | |||
| MMC / Marsh & McLennan Companies, Inc. | 0.01 | -2.97 | 2.20 | 0.87 | 1.3215 | 0.1314 | |||
| TGT / Target Corporation | 0.02 | 87.60 | 2.13 | -30.14 | 1.2755 | -0.2004 | |||
| BKNG / Booking Holdings Inc. | 0.00 | 68.57 | 2.11 | 81.55 | 1.2635 | 0.6309 | |||
| EIX / Edison International | 0.04 | -2.97 | 2.02 | -3.86 | 1.2094 | 0.0667 | |||
| NTAP / NetApp, Inc. | 0.02 | -2.97 | 2.01 | -28.66 | 1.2037 | -0.3294 | |||
| CL / Colgate-Palmolive Company | 0.02 | -2.97 | 1.99 | 3.17 | 1.1914 | 0.1424 | |||
| VLO / Valero Energy Corporation | 0.02 | -2.97 | 1.97 | -15.32 | 1.1810 | -0.0857 | |||
| CF / CF Industries Holdings, Inc. | 0.02 | 3.56 | 1.93 | -11.99 | 1.1581 | -0.0372 | |||
| LMT / Lockheed Martin Corporation | 0.00 | 12.18 | 1.90 | 15.71 | 1.1405 | 0.2455 | |||
| BMY / Bristol-Myers Squibb Company | 0.04 | -2.97 | 1.84 | -17.36 | 1.1028 | -0.1096 | |||
| ABT / Abbott Laboratories | 0.01 | -14.88 | 1.83 | -13.00 | 1.1001 | -0.0486 | |||
| PG / The Procter & Gamble Company | 0.01 | -2.96 | 1.80 | -4.97 | 1.0791 | 0.0476 | |||
| CI / The Cigna Group | 0.01 | -2.97 | 1.79 | 12.15 | 1.0749 | 0.2042 | |||
| CRH / CRH plc | 0.02 | 9.64 | 1.66 | 5.67 | 0.9951 | 0.1395 | |||
| ABBV / AbbVie Inc. | 0.01 | -2.97 | 1.61 | 2.95 | 0.9636 | 0.1132 | |||
| MDT / Medtronic plc | 0.02 | 11.80 | 1.58 | 4.37 | 0.9451 | 0.1223 | |||
| SYF / Synchrony Financial | 0.03 | 1.53 | 0.9163 | 0.9163 | |||||
| LPX / Louisiana-Pacific Corporation | 0.02 | -2.97 | 1.52 | -28.42 | 0.9129 | -0.2454 | |||
| NTNX / Nutanix, Inc. | 0.02 | -2.97 | 1.37 | -3.05 | 0.8195 | 0.0515 | |||
| CVS / CVS Health Corporation | 0.02 | 1.35 | 0.8077 | 0.8077 | |||||
| VMI / Valmont Industries, Inc. | 0.00 | 1.21 | 0.7253 | 0.7253 | |||||
| GAP / The Gap, Inc. | 0.05 | -19.42 | 1.20 | -26.65 | 0.7182 | -0.1717 | |||
| TT / Trane Technologies plc | 0.00 | -2.96 | 1.07 | 2.60 | 0.6402 | 0.0730 | |||
| UAL / United Airlines Holdings, Inc. | 0.01 | 439.07 | 1.00 | 251.23 | 0.6010 | 0.4452 | |||
| ADT / ADT Inc. | 0.12 | -2.97 | 1.00 | 1.32 | 0.5983 | 0.0619 | |||
| ALL / The Allstate Corporation | 0.00 | -2.96 | 0.96 | 0.10 | 0.5775 | 0.0534 | |||
| STLD / Steel Dynamics, Inc. | 0.01 | -56.87 | 0.96 | -56.38 | 0.5746 | -0.6215 | |||
| VIRT / Virtu Financial, Inc. | 0.02 | 0.95 | 0.5720 | 0.5720 | |||||
| TAP / Molson Coors Beverage Company | 0.02 | -2.97 | 0.95 | 1.94 | 0.5683 | 0.0620 | |||
| VRTX / Vertex Pharmaceuticals Incorporated | 0.00 | -2.95 | 0.92 | 7.20 | 0.5539 | 0.0841 | |||
| BAX / Baxter International Inc. | 0.03 | -2.97 | 0.92 | -7.09 | 0.5508 | 0.0121 | |||
| SMG / The Scotts Miracle-Gro Company | 0.02 | 0.90 | 0.5382 | 0.5382 | |||||
| CRUS / Cirrus Logic, Inc. | 0.01 | 50.01 | 0.88 | 43.56 | 0.5284 | 0.1937 | |||
| REGN / Regeneron Pharmaceuticals, Inc. | 0.00 | -2.95 | 0.65 | -13.68 | 0.3901 | -0.0203 | |||
| DBX / Dropbox, Inc. | 0.02 | -2.97 | 0.63 | -13.86 | 0.3806 | -0.0207 | |||
| COLM / Columbia Sportswear Company | 0.01 | -2.97 | 0.60 | -31.69 | 0.3571 | -0.1177 | |||
| TJX / The TJX Companies, Inc. | 0.00 | 0.57 | 0.3446 | 0.3446 | |||||
| VZ / Verizon Communications Inc. | 0.01 | -2.97 | 0.57 | 8.56 | 0.3429 | 0.0559 | |||
| PFE / Pfizer Inc. | 0.02 | -77.32 | 0.56 | -84.67 | 0.3383 | -1.7413 | |||
| CBRE / CBRE Group, Inc. | 0.00 | -2.96 | 0.54 | -18.18 | 0.3245 | -0.0354 | |||
| JNJ / Johnson & Johnson | 0.00 | -59.45 | 0.51 | -58.34 | 0.3073 | -0.3628 | |||
| WFC / Wells Fargo & Company | 0.01 | -79.07 | 0.50 | -81.16 | 0.2998 | -1.1438 | |||
| AMGN / Amgen Inc. | 0.00 | -2.99 | 0.47 | -1.05 | 0.2833 | 0.0230 | |||
| PINC / Premier, Inc. | 0.02 | 0.46 | 0.2772 | 0.2772 | |||||
| GLPI / Gaming and Leisure Properties, Inc. | 0.01 | -40.25 | 0.46 | -40.93 | 0.2756 | -0.1480 | |||
| TTC / The Toro Company | 0.01 | 0.46 | 0.2734 | 0.2734 | |||||
| RGA / Reinsurance Group of America, Incorporated | 0.00 | -2.98 | 0.43 | -20.30 | 0.2596 | -0.0361 | |||
| BMRN / BioMarin Pharmaceutical Inc. | 0.01 | -2.98 | 0.42 | -2.32 | 0.2526 | 0.0173 | |||
| VRSN / VeriSign, Inc. | 0.00 | 0.40 | 0.2381 | 0.2381 | |||||
| EA / Electronic Arts Inc. | 0.00 | -76.75 | 0.39 | -72.60 | 0.2351 | -0.5431 | |||
| MCK / McKesson Corporation | 0.00 | -3.02 | 0.37 | 16.19 | 0.2198 | 0.0480 | |||
| QGEN / Qiagen N.V. | 0.01 | 27.69 | 0.34 | 22.46 | 0.2030 | 0.0522 | |||
| HOLX / Hologic, Inc. | 0.01 | -2.98 | 0.32 | -21.74 | 0.1945 | -0.0312 | |||
| SPG / Simon Property Group, Inc. | 0.00 | -91.71 | 0.32 | -88.51 | 0.1924 | -1.4059 | |||
| BRX / Brixmor Property Group Inc. | 0.01 | -2.97 | 0.30 | -7.08 | 0.1813 | 0.0037 | |||
| PRU / Prudential Financial, Inc. | 0.00 | 0.28 | 0.1674 | 0.1674 | |||||
| FTNT / Fortinet, Inc. | 0.00 | -2.96 | 0.27 | -0.37 | 0.1632 | 0.0147 | |||
| KMB / Kimberly-Clark Corporation | 0.00 | -2.97 | 0.27 | -1.45 | 0.1627 | 0.0125 | |||
| CAG / Conagra Brands, Inc. | 0.01 | 0.27 | 0.1625 | 0.1625 | |||||
| UNH / UnitedHealth Group Incorporated | 0.00 | -2.96 | 0.24 | -26.36 | 0.1459 | -0.0342 | |||
| LNC / Lincoln National Corporation | 0.01 | -65.84 | 0.23 | -60.18 | 0.1354 | -0.1888 | |||
| MAS / Masco Corporation | 0.00 | -2.96 | 0.22 | -25.85 | 0.1311 | -0.0294 | |||
| DE000C4SA6R6 / EURO STOXX 50 Index | 0.17 | 0.0995 | 0.0995 | ||||||
| EXAS / Exact Sciences Corporation | 0.00 | -2.97 | 0.11 | -20.98 | 0.0679 | -0.0102 | |||
| KEX / Kirby Corporation | 0.00 | -100.00 | 0.00 | -100.00 | -0.5039 | ||||
| ARMK / Aramark | 0.00 | -100.00 | 0.00 | -100.00 | -0.1463 |