Statistik Asas
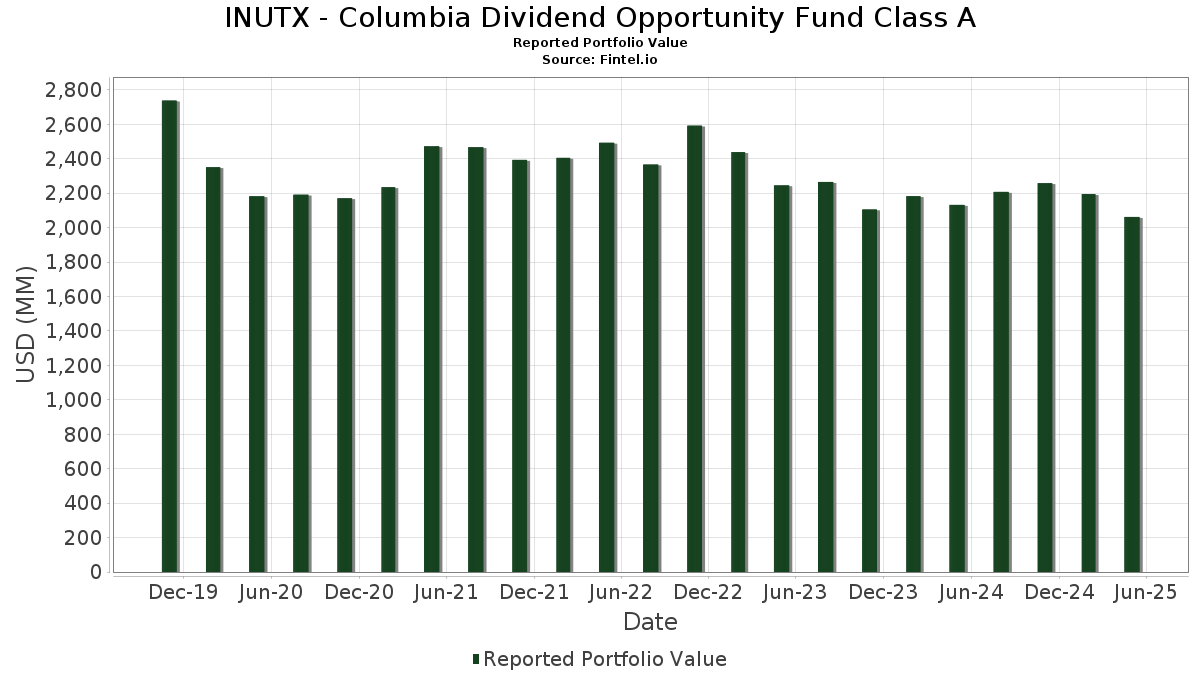
| Nilai Portfolio | $ 2,061,805,499 |
| Kedudukan Semasa | 88 |
Pegangan Terkini, Prestasi, AUM (dari 13F, 13D)
INUTX - Columbia Dividend Opportunity Fund Class A telah mendedahkan 88 jumlah pegangan dalam pemfailan SEC terkini mereka. Nilai portfolio terkini dikira sebagai $ 2,061,805,499 USD. Aset Sebenar Di Bawah Pengurusan (AUM) ialah nilai ini ditambah dengan tunai (yang tidak didedahkan). Pegangan teratas INUTX - Columbia Dividend Opportunity Fund Class A ialah Exxon Mobil Corporation (US:XOM) , JPMorgan Chase & Co. (US:JPM) , Philip Morris International Inc. (US:PM) , AbbVie Inc. (US:ABBV) , and International Business Machines Corporation (US:IBM) . Kedudukan baharu INUTX - Columbia Dividend Opportunity Fund Class A termasuk American Financial Group, Inc. (US:AFG) , UnitedHealth Group Incorporated (US:UNH) , Microchip Technology Incorporated - Preferred Stock (US:MROCL) , Cabot Oil & Gas Corp. (US:COG) , and Microchip Technology Incorporated (US:MCHP) .
Kenaikan Teratas Suku Tahun Ini
Kami menggunakan perubahan dalam peruntukan portfolio kerana ini adalah metrik yang paling bermakna. Perubahan boleh disebabkan oleh perdagangan atau perubahan dalam harga saham.
| Sekuriti | Saham (MM) |
Nilai (MM$) |
Portfolio % | ΔPortfolio % |
|---|---|---|---|---|
| 0.17 | 21.01 | 1.0167 | 1.0167 | |
| 0.05 | 14.37 | 0.6953 | 0.6953 | |
| 0.33 | 59.02 | 2.8552 | 0.5495 | |
| 0.20 | 11.35 | 0.5489 | 0.5489 | |
| 15.69 | 15.69 | 0.7591 | 0.4255 | |
| 0.70 | 30.81 | 1.4906 | 0.2918 | |
| 0.14 | 21.51 | 1.0405 | 0.2894 | |
| 0.10 | 25.42 | 1.2297 | 0.2782 | |
| 0.23 | 5.66 | 0.2739 | 0.2739 | |
| 0.65 | 23.41 | 1.1326 | 0.2358 |
Penurunan Teratas Suku Tahun Ini
Kami menggunakan perubahan dalam peruntukan portfolio kerana ini adalah metrik yang paling bermakna. Perubahan boleh disebabkan oleh perdagangan atau perubahan dalam harga saham.
| Sekuriti | Saham (MM) |
Nilai (MM$) |
Portfolio % | ΔPortfolio % |
|---|---|---|---|---|
| 0.07 | 5.74 | 0.2778 | -0.7193 | |
| 0.00 | 0.00 | -0.7160 | ||
| 0.28 | 13.29 | 0.6430 | -0.6147 | |
| 0.15 | 14.48 | 0.7004 | -0.4687 | |
| 0.23 | 5.48 | 0.2654 | -0.4250 | |
| 0.10 | 37.93 | 1.8352 | -0.3884 | |
| 0.28 | 17.87 | 0.8647 | -0.3626 | |
| 0.17 | 14.29 | 0.6916 | -0.3480 | |
| 0.38 | 15.18 | 0.7344 | -0.3411 | |
| 0.89 | 39.48 | 1.9099 | -0.3334 |
13F dan Pemfailan Dana
Borang ini telah difailkan pada 2025-07-25 untuk tempoh pelaporan 2025-05-31. Klik ikon pautan untuk melihat sejarah transaksi penuh.
Tingkatkan untuk membuka data premium dan eksport ke Excel ![]() .
.
| Sekuriti | Jenis | Purata Harga Saham | Saham (MM) |
ΔSaham (%) |
ΔSaham (%) |
Nilai ($MM) |
Portfolio (%) |
ΔPortfolio (%) |
|
|---|---|---|---|---|---|---|---|---|---|
| XOM / Exxon Mobil Corporation | 0.78 | 0.00 | 79.50 | -8.11 | 3.8460 | -0.0849 | |||
| JPM / JPMorgan Chase & Co. | 0.27 | 0.00 | 72.07 | -0.24 | 3.4868 | 0.2041 | |||
| PM / Philip Morris International Inc. | 0.33 | 0.00 | 59.02 | 16.30 | 2.8552 | 0.5495 | |||
| ABBV / AbbVie Inc. | 0.32 | 0.00 | 58.89 | -10.97 | 2.8488 | -0.1562 | |||
| IBM / International Business Machines Corporation | 0.22 | -6.23 | 56.53 | -3.77 | 2.7347 | 0.0657 | |||
| CSCO / Cisco Systems, Inc. | 0.86 | -3.92 | 54.51 | -5.53 | 2.6372 | 0.0156 | |||
| JNJ / Johnson & Johnson | 0.31 | -12.24 | 48.32 | -17.45 | 2.3375 | -0.3220 | |||
| GS / The Goldman Sachs Group, Inc. | 0.08 | -5.77 | 48.04 | -9.08 | 2.3239 | -0.0765 | |||
| KO / The Coca-Cola Company | 0.62 | 0.00 | 44.59 | 1.25 | 2.1571 | 0.1562 | |||
| CVX / Chevron Corporation | 0.31 | 0.00 | 42.94 | -13.82 | 2.0773 | -0.1865 | |||
| BAC / Bank of America Corporation | 0.89 | -16.47 | 39.48 | -20.04 | 1.9099 | -0.3334 | |||
| T / AT&T Inc. | 1.41 | 0.00 | 39.20 | 1.42 | 1.8966 | 0.1404 | |||
| HD / The Home Depot, Inc. | 0.10 | -16.53 | 37.93 | -22.49 | 1.8352 | -0.3884 | |||
| PG / The Procter & Gamble Company | 0.22 | 0.00 | 36.76 | -2.27 | 1.7786 | 0.0694 | |||
| SO / The Southern Company | 0.39 | 0.00 | 34.67 | 0.23 | 1.6772 | 0.1057 | |||
| MRK / Merck & Co., Inc. | 0.43 | -2.65 | 33.01 | -18.91 | 1.5970 | -0.2527 | |||
| VZ / Verizon Communications Inc. | 0.70 | 14.49 | 30.81 | 16.77 | 1.4906 | 0.2918 | |||
| PEP / PepsiCo, Inc. | 0.23 | -10.26 | 30.80 | -23.14 | 1.4900 | -0.3306 | |||
| MDT / Medtronic plc | 0.37 | 20.01 | 30.31 | 8.22 | 1.4665 | 0.1938 | |||
| RTX / RTX Corporation | 0.22 | 0.00 | 30.22 | 2.63 | 1.4619 | 0.1240 | |||
| CMCSA / Comcast Corporation | 0.86 | 13.61 | 29.58 | 9.46 | 1.4311 | 0.2032 | |||
| WFC / Wells Fargo & Company | 0.39 | -17.76 | 29.09 | -21.48 | 1.4073 | -0.2759 | |||
| MMM / 3M Company | 0.19 | -6.66 | 28.68 | -10.74 | 1.3873 | -0.0723 | |||
| C / Citigroup Inc. | 0.37 | -14.95 | 28.15 | -19.88 | 1.3621 | -0.2344 | |||
| CME / CME Group Inc. | 0.09 | 0.00 | 27.17 | 13.88 | 1.3143 | 0.2304 | |||
| GLW / Corning Incorporated | 0.53 | -2.54 | 26.25 | -3.63 | 1.2701 | 0.0324 | |||
| XEL / Xcel Energy Inc. | 0.37 | 13.73 | 26.13 | 10.58 | 1.2640 | 0.1904 | |||
| AVGO / Broadcom Inc. | 0.10 | 0.00 | 25.42 | 21.38 | 1.2297 | 0.2782 | |||
| USB / U.S. Bancorp | 0.58 | 0.00 | 25.07 | -7.06 | 1.2130 | -0.0127 | |||
| TXN / Texas Instruments Incorporated | 0.13 | 0.00 | 24.27 | -6.70 | 1.1743 | -0.0078 | |||
| LMT / Lockheed Martin Corporation | 0.05 | 8.26 | 24.02 | -1.36 | 1.1622 | 0.0870 | |||
| MO / Altria Group, Inc. | 0.39 | 0.00 | 23.81 | 8.52 | 1.1518 | 0.1550 | |||
| UGI / UGI Corporation | 0.65 | 12.36 | 23.41 | 18.61 | 1.1326 | 0.2358 | |||
| DLR / Digital Realty Trust, Inc. | 0.13 | 0.00 | 22.90 | 9.72 | 1.1078 | 0.1596 | |||
| MET / MetLife, Inc. | 0.29 | 10.54 | 22.42 | 0.79 | 1.0846 | 0.0740 | |||
| PAYX / Paychex, Inc. | 0.14 | 24.95 | 21.51 | 30.09 | 1.0405 | 0.2894 | |||
| AFG / American Financial Group, Inc. | 0.17 | 21.01 | 1.0167 | 1.0167 | |||||
| STWD / Starwood Property Trust, Inc. | 1.05 | 14.94 | 20.83 | 10.62 | 1.0079 | 0.1522 | |||
| BLK / BlackRock, Inc. | 0.02 | 0.00 | 20.77 | 0.22 | 1.0050 | 0.0632 | |||
| MCD / McDonald's Corporation | 0.07 | -27.12 | 20.75 | -25.82 | 1.0036 | -0.2670 | |||
| SWK / Stanley Black & Decker, Inc. | 0.31 | 27.03 | 20.60 | -3.95 | 0.9968 | 0.0222 | |||
| KMI / Kinder Morgan, Inc. | 0.73 | 0.00 | 20.40 | 3.47 | 0.9870 | 0.0911 | |||
| DTE / DTE Energy Company | 0.15 | 0.00 | 20.36 | 2.20 | 0.9850 | 0.0799 | |||
| AMGN / Amgen Inc. | 0.07 | -11.53 | 20.35 | -17.24 | 0.9843 | -0.1327 | |||
| VLO / Valero Energy Corporation | 0.16 | 0.00 | 20.05 | -1.35 | 0.9702 | 0.0466 | |||
| SPG / Simon Property Group, Inc. | 0.12 | 0.00 | 20.04 | -12.37 | 0.9696 | -0.0696 | |||
| GPC / Genuine Parts Company | 0.15 | 12.32 | 18.80 | 13.79 | 0.9096 | 0.1589 | |||
| DRI / Darden Restaurants, Inc. | 0.09 | 0.00 | 18.34 | 6.86 | 0.8871 | 0.1074 | |||
| AMT / American Tower Corporation | 0.09 | -2.63 | 18.31 | -6.72 | 0.8858 | -0.0000 | |||
| CVS / CVS Health Corporation | 0.28 | -32.09 | 17.87 | -33.83 | 0.8647 | -0.3626 | |||
| IP / International Paper Company | 0.36 | 0.00 | 17.04 | -15.16 | 0.8244 | -0.0881 | |||
| NTR / Nutrien Ltd. | 0.28 | 7.16 | 16.61 | 20.82 | 0.8036 | 0.1789 | |||
| BRX / Brixmor Property Group Inc. | 0.64 | -14.50 | 16.34 | -22.29 | 0.7903 | -0.1649 | |||
| LUV / Southwest Airlines Co. | 0.48 | 0.00 | 16.04 | 7.47 | 0.7761 | 0.0979 | |||
| EXR / Extra Space Storage Inc. | 0.10 | -18.45 | 15.70 | -19.20 | 0.7598 | -0.1233 | |||
| 19766H239 / COLUMBIA SHORT TERM CASH FUND | 15.69 | 113.75 | 15.69 | 113.72 | 0.7591 | 0.4255 | |||
| BXP / Boston Properties, Inc. | 0.23 | 5.63 | 15.67 | 0.27 | 0.7580 | 0.0480 | |||
| ARES.PRB / Ares Management Corporation - Preferred Security | 0.30 | 0.00 | 15.50 | -2.77 | 0.7499 | 0.0256 | |||
| F / Ford Motor Company | 1.48 | -25.95 | 15.36 | -19.52 | 0.7433 | -0.1241 | |||
| TFC / Truist Financial Corporation | 0.38 | -24.75 | 15.18 | -35.87 | 0.7344 | -0.3411 | |||
| CAG / Conagra Brands, Inc. | 0.65 | 3.73 | 14.91 | -7.03 | 0.7212 | -0.0074 | |||
| UPS / United Parcel Service, Inc. | 0.15 | -12.79 | 14.63 | -28.54 | 0.7078 | -0.2224 | |||
| SBUX / Starbucks Corporation | 0.17 | 0.00 | 14.59 | -27.51 | 0.7059 | -0.2086 | |||
| TGT / Target Corporation | 0.15 | -25.64 | 14.48 | -43.73 | 0.7004 | -0.4687 | |||
| BX / Blackstone Inc. | 0.10 | 16.67 | 14.38 | 0.45 | 0.6955 | 0.0452 | |||
| UNH / UnitedHealth Group Incorporated | 0.05 | 14.37 | 0.6953 | 0.6953 | |||||
| K / Kellanova | 0.17 | -37.32 | 14.29 | -37.53 | 0.6916 | -0.3480 | |||
| W1EL34 / Welltower Inc. - Depositary Receipt (Common Stock) | 13.46 | 3.26 | 0.6509 | 0.0589 | |||||
| BMY / Bristol-Myers Squibb Company | 0.28 | -40.71 | 13.29 | -51.99 | 0.6430 | -0.6147 | |||
| GAP / The Gap, Inc. | 0.60 | 3.57 | 13.29 | -30.93 | 0.6427 | -0.1325 | |||
| JCI / Johnson Controls International plc | 0.12 | -16.96 | 12.56 | -1.73 | 0.6076 | 0.0269 | |||
| PEG / Public Service Enterprise Group Incorporated | 0.15 | 0.00 | 12.52 | -0.14 | 0.6057 | 0.0360 | |||
| HPE / Hewlett Packard Enterprise Company | 0.67 | 0.00 | 11.54 | -12.77 | 0.5584 | -0.0428 | |||
| MROCL / Microchip Technology Incorporated - Preferred Stock | 0.20 | 11.35 | 0.5489 | 0.5489 | |||||
| WELL / Welltower Inc. | 0.07 | -14.02 | 10.88 | -13.59 | 0.5262 | -0.0457 | |||
| NEE / NextEra Energy, Inc. | 0.15 | 0.00 | 10.72 | 0.68 | 0.5184 | 0.0348 | |||
| NEE.PRT / NextEra Energy, Inc. - Debt/Equity Composite Units | 0.24 | 0.00 | 10.66 | -0.83 | 0.5158 | 0.0273 | |||
| APO.PRA / Apollo Global Management, Inc. - Preferred Stock | 0.15 | -20.63 | 10.54 | -29.57 | 0.5102 | -0.1701 | |||
| LYB / LyondellBasell Industries N.V. | 0.18 | 30.09 | 10.11 | -4.35 | 0.4892 | 0.0089 | |||
| PCAR / PACCAR Inc | 0.10 | 0.00 | 9.81 | -12.48 | 0.4745 | -0.0347 | |||
| BA.PRA / The Boeing Company - Preferred Security | 0.14 | 0.00 | 9.72 | 13.19 | 0.4703 | 0.0801 | |||
| QCOM / QUALCOMM Incorporated | 0.07 | -24.28 | 9.60 | -30.05 | 0.4643 | -0.1591 | |||
| HPE.PRC / Hewlett Packard Enterprise Company - Preferred Security | 0.17 | 0.00 | 8.77 | -11.53 | 0.4244 | -0.0261 | |||
| STX / Seagate Technology Holdings plc | 0.06 | -66.48 | 6.52 | -40.97 | 0.3155 | -0.1489 | |||
| TPR / Tapestry, Inc. | 0.07 | -71.55 | 5.74 | -73.83 | 0.2778 | -0.7193 | |||
| COG / Cabot Oil & Gas Corp. | 0.23 | 5.66 | 0.2739 | 0.2739 | |||||
| PFE / Pfizer Inc. | 0.23 | -59.38 | 5.48 | -63.91 | 0.2654 | -0.4250 | |||
| MCHP / Microchip Technology Incorporated | 0.08 | 4.85 | 0.2345 | 0.2345 | |||||
| CMI / Cummins Inc. | 0.00 | -100.00 | 0.00 | -100.00 | -0.7160 |