Statistik Asas
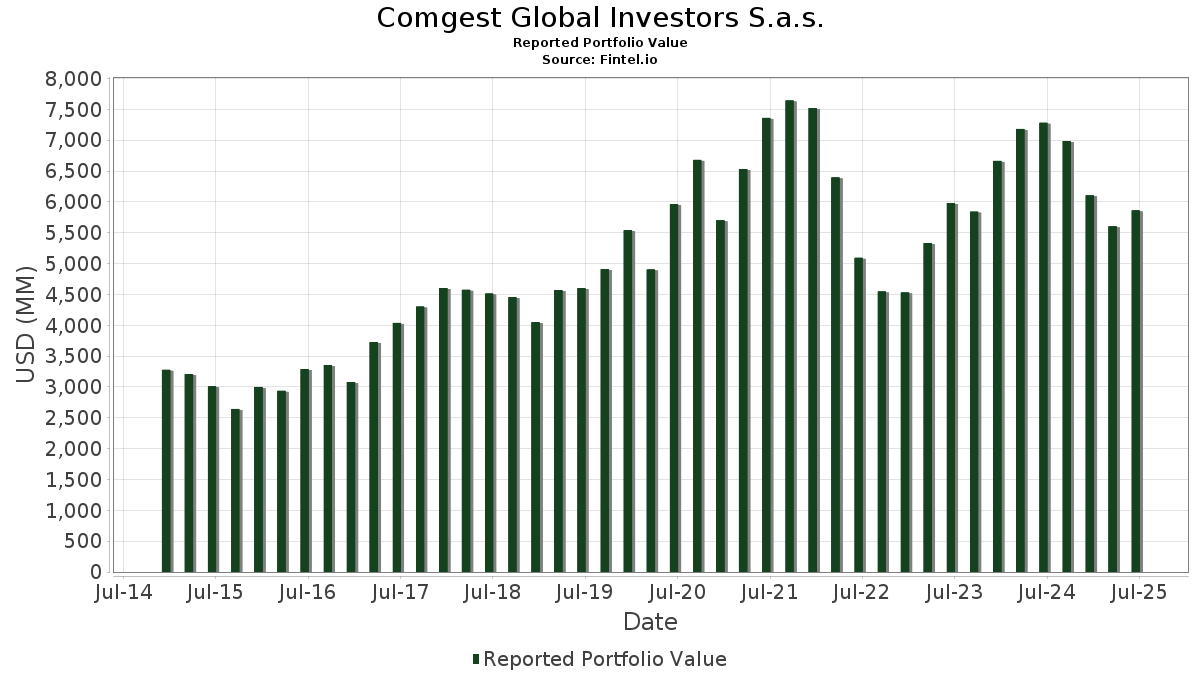
| Nilai Portfolio | $ 5,861,024,959 |
| Kedudukan Semasa | 64 |
Pegangan Terkini, Prestasi, AUM (dari 13F, 13D)
Comgest Global Investors S.a.s. telah mendedahkan 64 jumlah pegangan dalam pemfailan SEC terkini mereka. Nilai portfolio terkini dikira sebagai $ 5,861,024,959 USD. Aset Sebenar Di Bawah Pengurusan (AUM) ialah nilai ini ditambah dengan tunai (yang tidak didedahkan). Pegangan teratas Comgest Global Investors S.a.s. ialah Microsoft Corporation (US:MSFT) , Taiwan Semiconductor Manufacturing Company Limited - Depositary Receipt (Common Stock) (US:TSM) , Linde plc (US:LIN) , Visa Inc. (US:V) , and Intuit Inc. (US:INTU) . Kedudukan baharu Comgest Global Investors S.a.s. termasuk MakeMyTrip Limited (US:MMYT) , Uber Technologies, Inc. (US:UBER) , Kanzhun Limited - Depositary Receipt (Common Stock) (US:BZ) , .
Kenaikan Teratas Suku Tahun Ini
Kami menggunakan perubahan dalam peruntukan portfolio kerana ini adalah metrik yang paling bermakna. Perubahan boleh disebabkan oleh perdagangan atau perubahan dalam harga saham.
| Sekuriti | Saham (MM) |
Nilai (MM$) |
Portfolio % | ΔPortfolio % |
|---|---|---|---|---|
| 2.22 | 503.91 | 8.5976 | 2.0834 | |
| 1.10 | 548.31 | 9.3552 | 1.6015 | |
| 0.46 | 358.79 | 6.1217 | 1.1851 | |
| 0.43 | 41.81 | 0.7133 | 0.7133 | |
| 1.37 | 299.83 | 5.1157 | 0.5656 | |
| 0.59 | 128.11 | 2.1858 | 0.4247 | |
| 1.78 | 314.26 | 5.3618 | 0.4218 | |
| 0.24 | 130.93 | 2.2338 | 0.3951 | |
| 0.04 | 95.19 | 1.6241 | 0.3679 | |
| 0.65 | 154.69 | 2.6394 | 0.2932 |
Penurunan Teratas Suku Tahun Ini
Kami menggunakan perubahan dalam peruntukan portfolio kerana ini adalah metrik yang paling bermakna. Perubahan boleh disebabkan oleh perdagangan atau perubahan dalam harga saham.
| Sekuriti | Saham (MM) |
Nilai (MM$) |
Portfolio % | ΔPortfolio % |
|---|---|---|---|---|
| 0.87 | 260.16 | 4.4388 | -2.2295 | |
| 0.36 | 281.79 | 4.8079 | -1.8105 | |
| 1.06 | 154.89 | 2.6427 | -1.0713 | |
| 2.07 | 316.15 | 5.3941 | -0.9962 | |
| 0.45 | 236.13 | 4.0288 | -0.4877 | |
| 0.10 | 1.81 | 0.0309 | -0.3418 | |
| 1.42 | 221.09 | 3.7723 | -0.3333 | |
| 0.13 | 18.04 | 0.3078 | -0.2766 | |
| 1.08 | 385.23 | 6.5727 | -0.2697 | |
| 0.27 | 55.36 | 0.9445 | -0.2243 |
13F dan Pemfailan Dana
Borang ini telah difailkan pada 2025-08-07 untuk tempoh pelaporan 2025-06-30. Klik ikon pautan untuk melihat sejarah transaksi penuh.
Tingkatkan untuk membuka data premium dan eksport ke Excel ![]() .
.
| Sekuriti | Jenis | Purata Harga Saham | Saham (MM) |
ΔSaham (%) |
ΔSaham (%) |
Nilai ($MM) |
Portfolio (%) |
ΔPortfolio (%) |
|
|---|---|---|---|---|---|---|---|---|---|
| MSFT / Microsoft Corporation | 1.10 | -4.74 | 548.31 | 26.22 | 9.3552 | 1.6015 | |||
| TSM / Taiwan Semiconductor Manufacturing Company Limited - Depositary Receipt (Common Stock) | 2.22 | 1.20 | 503.91 | 38.07 | 8.5976 | 2.0834 | |||
| LIN / Linde plc | 0.88 | 4.17 | 413.45 | 4.97 | 7.0542 | 0.0238 | |||
| V / Visa Inc. | 1.08 | -0.81 | 385.23 | 0.49 | 6.5727 | -0.2697 | |||
| INTU / Intuit Inc. | 0.46 | 1.13 | 358.79 | 29.73 | 6.1217 | 1.1851 | |||
| JNJ / Johnson & Johnson | 2.07 | -4.13 | 316.15 | -11.69 | 5.3941 | -0.9962 | |||
| GOOGL / Alphabet Inc. | 1.78 | -0.36 | 314.26 | 13.55 | 5.3618 | 0.4218 | |||
| AMZN / Amazon.com, Inc. | 1.37 | 2.00 | 299.83 | 17.62 | 5.1157 | 0.5656 | |||
| LLY / Eli Lilly and Company | 0.36 | -19.48 | 281.79 | -24.00 | 4.8079 | -1.8105 | |||
| ACN / Accenture plc | 0.87 | -27.30 | 260.16 | -30.36 | 4.4388 | -2.2295 | |||
| SPGI / S&P Global Inc. | 0.45 | -10.08 | 236.13 | -6.68 | 4.0288 | -0.4877 | |||
| ZTS / Zoetis Inc. | 1.42 | 1.48 | 221.09 | -3.88 | 3.7723 | -0.3333 | |||
| VRSK / Verisk Analytics, Inc. | 0.52 | -2.20 | 162.91 | 2.36 | 2.7796 | -0.0611 | |||
| ICLR / ICON Public Limited Company | 1.06 | -10.45 | 154.89 | -25.56 | 2.6427 | -1.0713 | |||
| ADI / Analog Devices, Inc. | 0.65 | -0.29 | 154.69 | 17.69 | 2.6394 | 0.2932 | |||
| CPRT / Copart, Inc. | 2.97 | 32.77 | 145.71 | 15.13 | 2.4861 | 0.2271 | |||
| COST / Costco Wholesale Corporation | 0.14 | -4.79 | 135.33 | -0.34 | 2.3089 | -0.1148 | |||
| IDXX / IDEXX Laboratories, Inc. | 0.24 | -0.49 | 130.93 | 27.09 | 2.2338 | 0.3951 | |||
| ORCL / Oracle Corporation | 0.59 | -16.97 | 128.11 | 29.84 | 2.1858 | 0.4247 | |||
| MELI / MercadoLibre, Inc. | 0.04 | 0.96 | 95.19 | 35.25 | 1.6241 | 0.3679 | |||
| AAPL / Apple Inc. | 0.27 | -8.48 | 55.36 | -15.46 | 0.9445 | -0.2243 | |||
| META / Meta Platforms, Inc. | 0.07 | 0.20 | 54.24 | 28.32 | 0.9254 | 0.1709 | |||
| VMC / Vulcan Materials Company | 0.16 | -15.32 | 41.90 | -5.33 | 0.7149 | -0.0751 | |||
| MMYT / MakeMyTrip Limited | 0.43 | 41.81 | 0.7133 | 0.7133 | |||||
| SCI / Service Corporation International | 0.49 | -5.66 | 39.55 | -4.25 | 0.6747 | -0.0625 | |||
| CTAS / Cintas Corporation | 0.17 | 0.38 | 38.12 | 8.85 | 0.6504 | 0.0253 | |||
| SYK / Stryker Corporation | 0.09 | 13.03 | 33.68 | 20.13 | 0.5747 | 0.0742 | |||
| FMX / Fomento Económico Mexicano, S.A.B. de C.V. - Depositary Receipt (Common Stock) | 0.29 | -29.85 | 29.81 | -25.97 | 0.5086 | -0.2101 | |||
| AVY / Avery Dennison Corporation | 0.16 | -21.37 | 28.41 | -22.48 | 0.4847 | -0.1694 | |||
| HDB / HDFC Bank Limited - Depositary Receipt (Common Stock) | 0.29 | -11.31 | 22.45 | 2.34 | 0.3831 | -0.0085 | |||
| JBHT / J.B. Hunt Transport Services, Inc. | 0.13 | -43.23 | 18.04 | -44.90 | 0.3078 | -0.2766 | |||
| OTIS / Otis Worldwide Corporation | 0.17 | -6.07 | 16.51 | -9.87 | 0.2816 | -0.0453 | |||
| GLOB / Globant S.A. | 0.17 | 0.00 | 15.90 | -22.84 | 0.2712 | -0.0965 | |||
| MA / Mastercard Incorporated | 0.03 | 10.93 | 15.68 | 13.73 | 0.2676 | 0.0214 | |||
| NFLX / Netflix, Inc. | 0.01 | 0.27 | 13.93 | 43.99 | 0.2376 | 0.0650 | |||
| FERG / Ferguson Enterprises Inc. | 0.06 | -3.13 | 13.89 | 31.65 | 0.2369 | 0.0487 | |||
| AXP / American Express Company | 0.04 | 70.15 | 12.00 | 101.73 | 0.2047 | 0.0985 | |||
| NVDD / Direxion Shares ETF Trust - Direxion Daily NVDA Bear 1X Shares | 0.07 | 6.49 | 11.51 | 55.23 | 0.1964 | 0.0641 | |||
| KSPI / Joint Stock Company Kaspi.kz - Depositary Receipt (Common Stock) | 0.13 | 0.98 | 10.88 | -7.68 | 0.1856 | -0.0247 | |||
| YUMC / Yum China Holdings, Inc. | 0.20 | -3.16 | 9.10 | -16.83 | 0.1552 | -0.0400 | |||
| FAST / Fastenal Company | 0.21 | 89.82 | 8.77 | 2.80 | 0.1497 | -0.0026 | |||
| SPOT / Spotify Technology S.A. | 0.01 | -29.89 | 8.47 | -2.20 | 0.1445 | -0.0101 | |||
| UBER / Uber Technologies, Inc. | 0.09 | 7.97 | 0.1359 | 0.1359 | |||||
| STVN / Stevanato Group S.p.A. | 0.32 | 4.52 | 7.92 | 25.05 | 0.1352 | 0.0221 | |||
| ISRG / Intuitive Surgical, Inc. | 0.01 | -9.93 | 7.91 | -1.19 | 0.1349 | -0.0079 | |||
| BDX / Becton, Dickinson and Company | 0.04 | -0.89 | 7.23 | -25.47 | 0.1233 | -0.0498 | |||
| TME / Tencent Music Entertainment Group - Depositary Receipt (Common Stock) | 0.30 | 26.39 | 5.91 | 70.97 | 0.1008 | 0.0391 | |||
| PDD / PDD Holdings Inc. - Depositary Receipt (Common Stock) | 0.05 | 19.35 | 5.33 | 5.54 | 0.0910 | 0.0008 | |||
| ASML / ASML Holding N.V. - Depositary Receipt (Common Stock) | 0.01 | 0.00 | 4.29 | 20.94 | 0.0731 | 0.0099 | |||
| ALC / Alcon Inc. | 0.04 | 0.00 | 3.41 | -7.01 | 0.0582 | -0.0073 | |||
| MDT / Medtronic plc | 0.04 | 0.00 | 3.20 | -3.00 | 0.0545 | -0.0043 | |||
| RELX / RELX PLC - Depositary Receipt (Common Stock) | 0.06 | 0.00 | 3.10 | 7.80 | 0.0528 | 0.0016 | |||
| WMT / Walmart Inc. | 0.03 | -21.11 | 3.08 | -12.12 | 0.0526 | -0.0100 | |||
| NVO / Novo Nordisk A/S - Depositary Receipt (Common Stock) | 0.04 | 0.00 | 2.81 | -0.60 | 0.0480 | -0.0025 | |||
| CSCO / Cisco Systems, Inc. | 0.04 | 0.00 | 2.54 | 12.39 | 0.0433 | 0.0030 | |||
| INFY / Infosys Limited - Depositary Receipt (Common Stock) | 0.10 | -91.45 | 1.81 | -91.32 | 0.0309 | -0.3418 | |||
| VIPS / Vipshop Holdings Limited - Depositary Receipt (Common Stock) | 0.10 | -46.16 | 1.47 | -48.35 | 0.0251 | -0.0257 | |||
| CTSH / Cognizant Technology Solutions Corporation | 0.02 | -24.36 | 1.23 | -22.90 | 0.0210 | -0.0075 | |||
| RACE / Ferrari N.V. | 0.00 | 0.00 | 1.20 | 14.61 | 0.0205 | 0.0018 | |||
| MTD / Mettler-Toledo International Inc. | 0.00 | 4.05 | 0.97 | 3.43 | 0.0165 | -0.0002 | |||
| BZ / Kanzhun Limited - Depositary Receipt (Common Stock) | 0.05 | 0.89 | 0.0152 | 0.0152 | |||||
| TCOM / Trip.com Group Limited - Depositary Receipt (Common Stock) | 0.01 | 67.33 | 0.72 | 54.39 | 0.0123 | 0.0040 | |||
| TMO / Thermo Fisher Scientific Inc. | 0.00 | 4.05 | 0.61 | -15.19 | 0.0105 | -0.0025 | |||
| MPWR / Monolithic Power Systems, Inc. | 0.00 | -45.16 | 0.60 | -30.94 | 0.0102 | -0.0052 | |||
| NYT / The New York Times Company | 0.00 | -100.00 | 0.00 | 0.0000 |