Statistik Asas
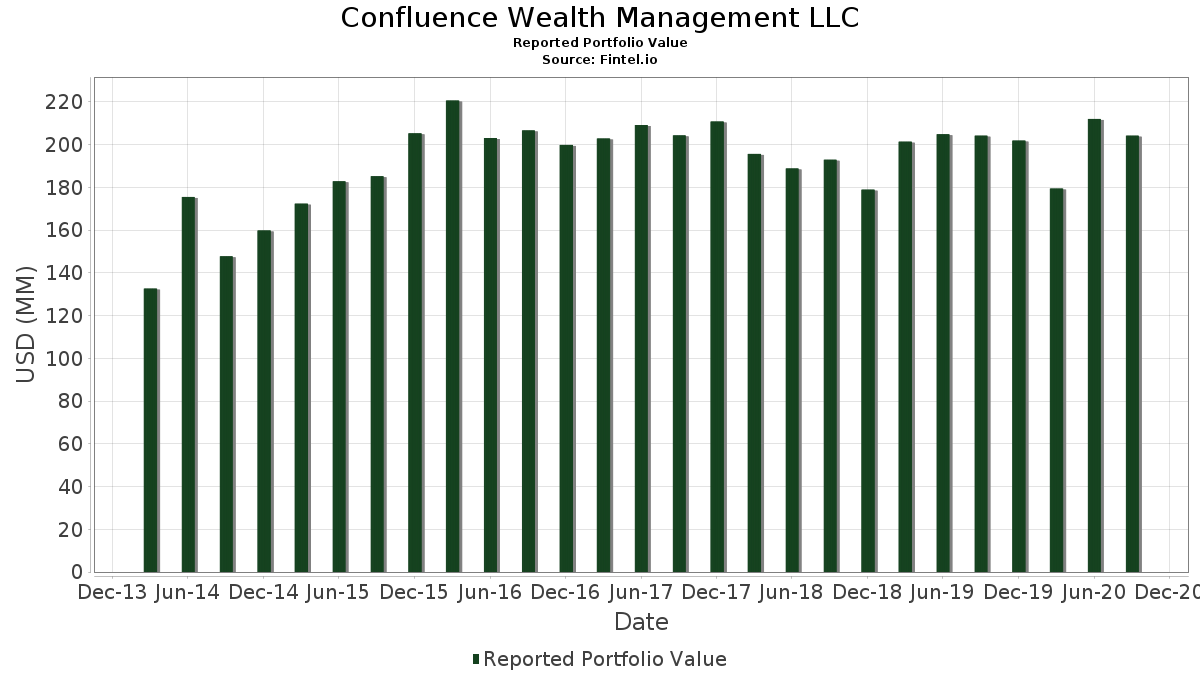
| Nilai Portfolio | $ 204,161,000 |
| Kedudukan Semasa | 114 |
Pegangan Terkini, Prestasi, AUM (dari 13F, 13D)
Confluence Wealth Management LLC telah mendedahkan 114 jumlah pegangan dalam pemfailan SEC terkini mereka. Nilai portfolio terkini dikira sebagai $ 204,161,000 USD. Aset Sebenar Di Bawah Pengurusan (AUM) ialah nilai ini ditambah dengan tunai (yang tidak didedahkan). Pegangan teratas Confluence Wealth Management LLC ialah iShares Trust - iShares Core S&P 500 ETF (US:IVV) , Vanguard Charlotte Funds - Vanguard Total International Bond ETF (US:BNDX) , iShares Trust - iShares MSCI EAFE ETF (US:EFA) , SPDR S&P MidCap 400 ETF Trust (US:MDY) , and FlexShares Trust - FlexShares Quality Dividend Index Fund (US:QDF) .
Kenaikan Teratas Suku Tahun Ini
Kami menggunakan perubahan dalam peruntukan portfolio kerana ini adalah metrik yang paling bermakna. Perubahan boleh disebabkan oleh perdagangan atau perubahan dalam harga saham.
| Sekuriti | Saham (MM) |
Nilai (MM$) |
Portfolio % | ΔPortfolio % |
|---|---|---|---|---|
| 0.19 | 12.13 | 5.9414 | 2.8875 | |
| 0.03 | 11.84 | 5.7998 | 1.3416 | |
| 0.16 | 6.37 | 3.1186 | 1.2539 | |
| 0.01 | 1.48 | 0.7230 | 0.7230 | |
| 0.09 | 6.25 | 3.0589 | 0.6390 | |
| 0.04 | 1.11 | 0.5422 | 0.5422 | |
| 0.01 | 2.15 | 1.0531 | 0.5413 | |
| 0.01 | 1.06 | 0.5207 | 0.5207 | |
| 0.23 | 10.30 | 5.0436 | 0.5184 | |
| 0.05 | 2.50 | 1.2240 | 0.5047 |
Penurunan Teratas Suku Tahun Ini
Kami menggunakan perubahan dalam peruntukan portfolio kerana ini adalah metrik yang paling bermakna. Perubahan boleh disebabkan oleh perdagangan atau perubahan dalam harga saham.
| Sekuriti | Saham (MM) |
Nilai (MM$) |
Portfolio % | ΔPortfolio % |
|---|---|---|---|---|
| 0.00 | 0.00 | -2.6643 | ||
| 0.02 | 2.81 | 1.3739 | -2.2607 | |
| 0.00 | 0.28 | 0.1352 | -1.9894 | |
| 0.01 | 0.75 | 0.3678 | -1.6733 | |
| 0.01 | 0.57 | 0.2772 | -1.3153 | |
| 0.00 | 0.00 | -1.1571 | ||
| 0.02 | 4.26 | 2.0876 | -0.7932 | |
| 0.02 | 2.47 | 1.2098 | -0.5143 | |
| 0.00 | 1.00 | 0.4918 | -0.5106 | |
| 0.00 | 0.00 | -0.5071 |
13F dan Pemfailan Dana
Borang ini telah difailkan pada 2020-10-26 untuk tempoh pelaporan 2020-09-30. Klik ikon pautan untuk melihat sejarah transaksi penuh.
Tingkatkan untuk membuka data premium dan eksport ke Excel ![]() .
.
| Sekuriti | Jenis | Purata Harga Saham | Saham (MM) |
ΔSaham (%) |
ΔSaham (%) |
Nilai ($MM) |
Portfolio (%) |
ΔPortfolio (%) |
|
|---|---|---|---|---|---|---|---|---|---|
| IVV / iShares Trust - iShares Core S&P 500 ETF | 0.06 | 0.05 | 16.48 | -3.57 | 8.0711 | 0.0104 | |||
| BNDX / Vanguard Charlotte Funds - Vanguard Total International Bond ETF | 0.23 | -2.82 | 13.79 | -0.96 | 6.7525 | 0.1862 | |||
| EFA / iShares Trust - iShares MSCI EAFE ETF | 0.19 | 74.89 | 12.13 | 87.36 | 5.9414 | 2.8875 | |||
| MDY / SPDR S&P MidCap 400 ETF Trust | 0.03 | 15.34 | 11.84 | 25.29 | 5.7998 | 1.3416 | |||
| QDF / FlexShares Trust - FlexShares Quality Dividend Index Fund | 0.23 | -0.20 | 10.30 | 7.34 | 5.0436 | 0.5184 | |||
| SPY / SPDR S&P 500 ETF | 0.03 | 9.26 | 8.32 | 5.16 | 4.0757 | 0.3430 | |||
| IWR / iShares Trust - iShares Russell Mid-Cap ETF | 0.14 | -3.84 | 7.67 | 0.37 | 3.7559 | 0.1519 | |||
| EEM / iShares, Inc. - iShares MSCI Emerging Markets ETF | 0.16 | 57.61 | 6.37 | 61.07 | 3.1186 | 1.2539 | |||
| SCHA / Schwab Strategic Trust - Schwab U.S. Small-Cap ETF | 0.09 | 14.07 | 6.25 | 21.73 | 3.0589 | 0.6390 | |||
| IWM / iShares Trust - iShares Russell 2000 ETF | 0.03 | -1.68 | 5.26 | 3.93 | 2.5769 | 0.1891 | |||
| GVI / iShares Trust - iShares Intermediate Government/Credit Bond ETF | 0.04 | -3.94 | 4.32 | -7.62 | 2.1150 | -0.0898 | |||
| AAPL / Apple Inc. | 0.02 | 13.66 | 4.26 | -30.21 | 2.0876 | -0.7932 | |||
| SCHE / Schwab Strategic Trust - Schwab Emerging Markets Equity ETF | 0.15 | 6.83 | 3.85 | 10.24 | 1.8872 | 0.2386 | |||
| IWF / iShares Trust - iShares Russell 1000 Growth ETF | 0.02 | -56.22 | 2.81 | -63.60 | 1.3739 | -2.2607 | |||
| USB / U.S. Bancorp | 0.05 | 9.06 | 2.50 | 63.87 | 1.2240 | 0.5047 | |||
| MSFT / Microsoft Corporation | 0.02 | -1.07 | 2.47 | -32.42 | 1.2098 | -0.5143 | |||
| IWB / iShares Trust - iShares Russell 1000 ETF | 0.01 | -18.32 | 2.47 | -21.70 | 1.2088 | -0.2780 | |||
| VTI / Vanguard Index Funds - Vanguard Total Stock Market ETF | 0.01 | -1.51 | 2.18 | -4.97 | 1.0683 | -0.0143 | |||
| BA / The Boeing Company | 0.01 | -4.53 | 2.15 | 98.16 | 1.0531 | 0.5413 | |||
| VWO / Vanguard International Equity Index Funds - Vanguard FTSE Emerging Markets ETF | 0.05 | 34.98 | 1.86 | 37.20 | 0.9106 | 0.2714 | |||
| SBUX / Starbucks Corporation | 0.02 | 3.99 | 1.85 | 24.98 | 0.9042 | 0.2075 | |||
| ISRG / Intuitive Surgical, Inc. | 0.00 | 1.77 | 1.83 | -3.57 | 0.8988 | 0.0011 | |||
| HD / The Home Depot, Inc. | 0.01 | 5.78 | 1.80 | -2.02 | 0.8812 | 0.0151 | |||
| NKE / NIKE, Inc. | 0.02 | -3.56 | 1.75 | -7.62 | 0.8557 | -0.0363 | |||
| JPM / JPMorgan Chase & Co. | 0.01 | 2.46 | 1.73 | 28.25 | 0.8493 | 0.2116 | |||
| ICE / Intercontinental Exchange, Inc. | 0.02 | 2.01 | 1.72 | 2.75 | 0.8430 | 0.0528 | |||
| TMO / Thermo Fisher Scientific Inc. | 0.01 | 9.46 | 1.71 | -12.00 | 0.8371 | -0.0790 | |||
| GOOGL / Alphabet Inc. | 0.00 | -7.84 | 1.71 | -20.67 | 0.8366 | -0.1790 | |||
| NEE / NextEra Energy, Inc. | 0.01 | -2.60 | 1.70 | -5.52 | 0.8302 | -0.0160 | |||
| COST / Costco Wholesale Corporation | 0.01 | 0.68 | 1.67 | -4.36 | 0.8175 | -0.0057 | |||
| AMZN / Amazon.com, Inc. | 0.00 | -3.06 | 1.65 | -38.99 | 0.8087 | -0.4678 | |||
| META / Meta Platforms, Inc. | 0.01 | 7.26 | 1.63 | -15.90 | 0.8003 | -0.1162 | |||
| SUB / iShares Trust - iShares Short-Term National Muni Bond ETF | 0.01 | 44.99 | 1.50 | 43.20 | 0.7372 | 0.2414 | |||
| IJJ / iShares Trust - iShares S&P Mid-Cap 400 Value ETF | 0.01 | 1.48 | 0.7230 | 0.7230 | |||||
| MUB / iShares Trust - iShares National Muni Bond ETF | 0.01 | 20.83 | 1.47 | 19.54 | 0.7190 | 0.1398 | |||
| FISV / Fiserv, Inc. | 0.01 | -4.82 | 1.39 | 0.94 | 0.6823 | 0.0313 | |||
| BRK.B / Berkshire Hathaway Inc. | 0.01 | 33.40 | 1.32 | 55.41 | 0.6470 | 0.2461 | |||
| NOC / Northrop Grumman Corporation | 0.00 | -2.56 | 1.30 | 18.76 | 0.6358 | 0.1202 | |||
| IWD / iShares Trust - iShares Russell 1000 Value ETF | 0.01 | -47.90 | 1.24 | -40.63 | 0.6069 | -0.3776 | |||
| INTC / Intel Corporation | 0.02 | -18.61 | 1.19 | -29.91 | 0.5843 | -0.2185 | |||
| AGG / iShares Trust - iShares Core U.S. Aggregate Bond ETF | 0.01 | 132.20 | 1.18 | 122.37 | 0.5794 | 0.3285 | |||
| EW / Edwards Lifesciences Corporation | 0.01 | -70.08 | 1.17 | -4.80 | 0.5736 | -0.0066 | |||
| V / Visa Inc. | 0.01 | 4.76 | 1.17 | -6.71 | 0.5716 | -0.0185 | |||
| SYY / Sysco Corporation | 0.01 | 1.05 | 1.11 | 46.83 | 0.5437 | 0.1871 | |||
| HEFA / iShares Trust - iShares Currency Hedged MSCI EAFE ETF | 0.04 | 1.11 | 0.5422 | 0.5422 | |||||
| EXR / Extra Space Storage Inc. | 0.01 | 1.06 | 0.5207 | 0.5207 | |||||
| BSV / Vanguard Bond Index Funds - Vanguard Short-Term Bond ETF | 0.01 | 90.54 | 1.06 | 85.17 | 0.5197 | 0.2494 | |||
| VLO / Valero Energy Corporation | 0.01 | 74.54 | 1.05 | 152.64 | 0.5148 | 0.3186 | |||
| AMT / American Tower Corporation | 0.00 | -17.17 | 1.02 | -29.16 | 0.5021 | -0.1805 | |||
| ROP / Roper Technologies, Inc. | 0.00 | 0.18 | 1.02 | -8.05 | 0.4976 | -0.0236 | |||
| ADBE / Adobe Inc. | 0.00 | -25.54 | 1.00 | -52.75 | 0.4918 | -0.5106 | |||
| STZ / Constellation Brands, Inc. | 0.00 | 3.82 | 0.97 | 22.95 | 0.4776 | 0.1035 | |||
| ACN / Accenture plc | 0.00 | 26.93 | 0.95 | 13.82 | 0.4638 | 0.0714 | |||
| DG / Dollar General Corporation | 0.01 | -13.02 | 0.94 | -27.46 | 0.4594 | -0.1505 | |||
| EFV / iShares Trust - iShares MSCI EAFE Value ETF | 0.02 | 90.98 | 0.92 | 126.23 | 0.4521 | 0.2596 | |||
| ROST / Ross Stores, Inc. | 0.01 | -13.01 | 0.87 | 12.16 | 0.4247 | 0.0600 | |||
| MA / Mastercard Incorporated | 0.00 | -3.10 | 0.86 | -11.01 | 0.4237 | -0.0348 | |||
| MMC / Marsh & McLennan Companies, Inc. | 0.01 | 0.86 | 0.4207 | 0.4207 | |||||
| MKC / McCormick & Company, Incorporated | 0.01 | 0.83 | 0.4075 | 0.4075 | |||||
| NFLX / Netflix, Inc. | 0.00 | -3.79 | 0.82 | -43.42 | 0.4021 | -0.2823 | |||
| CTXS / Citrix Systems, Inc. | 0.01 | 0.80 | 0.3938 | 0.3938 | |||||
| AON / Aon plc | 0.00 | 0.78 | 0.3840 | 0.3840 | |||||
| SCHO / Schwab Strategic Trust - Schwab Short-Term U.S. Treasury ETF | 0.01 | -82.28 | 0.75 | -82.64 | 0.3678 | -1.6733 | |||
| JNJ / Johnson & Johnson | 0.01 | -7.19 | 0.72 | -14.56 | 0.3536 | -0.0450 | |||
| C.WSA / Citigroup, Inc. | 0.00 | 223.94 | 0.71 | 165.67 | 0.3487 | 0.2223 | |||
| UNH / UnitedHealth Group Incorporated | 0.00 | 0.93 | 0.71 | -25.60 | 0.3473 | -0.1023 | |||
| IVE / iShares Trust - iShares S&P 500 Value ETF | 0.01 | 8.68 | 0.71 | 19.59 | 0.3468 | 0.0675 | |||
| IDXX / IDEXX Laboratories, Inc. | 0.00 | -10.86 | 0.71 | -26.58 | 0.3463 | -0.1080 | |||
| LRCX / Lam Research Corporation | 0.00 | -34.19 | 0.70 | -52.97 | 0.3409 | -0.3572 | |||
| HON / Honeywell International Inc. | 0.00 | 161.23 | 0.66 | 205.09 | 0.3228 | 0.2209 | |||
| RCL / Royal Caribbean Cruises Ltd. | 0.01 | 0.59 | 0.2909 | 0.2909 | |||||
| PFE / Pfizer Inc. | 0.02 | 25.10 | 0.58 | 37.50 | 0.2856 | 0.0856 | |||
| EOG / EOG Resources, Inc. | 0.01 | 0.58 | 0.2846 | 0.2846 | |||||
| PG / The Procter & Gamble Company | 0.00 | -30.30 | 0.58 | -27.47 | 0.2846 | -0.0933 | |||
| LMT / Lockheed Martin Corporation | 0.00 | 0.68 | 0.58 | 7.64 | 0.2831 | 0.0298 | |||
| SCHM / Schwab Strategic Trust - Schwab U.S. Mid-Cap ETF | 0.01 | -84.40 | 0.57 | -83.23 | 0.2772 | -1.3153 | |||
| PEP / PepsiCo, Inc. | 0.00 | -17.12 | 0.55 | -14.06 | 0.2694 | -0.0325 | |||
| IWN / iShares Trust - iShares Russell 2000 Value ETF | 0.00 | 0.54 | 0.2665 | 0.2665 | |||||
| CSCO / Cisco Systems, Inc. | 0.01 | 16.39 | 0.54 | 23.36 | 0.2665 | 0.0584 | |||
| INTU / Intuit Inc. | 0.00 | -30.08 | 0.54 | -37.21 | 0.2645 | -0.1412 | |||
| SPGI / S&P Global Inc. | 0.00 | -31.60 | 0.54 | -49.15 | 0.2635 | -0.2356 | |||
| BIIB / Biogen Inc. | 0.00 | -7.38 | 0.53 | -19.39 | 0.2606 | -0.0508 | |||
| VZ / Verizon Communications Inc. | 0.01 | -16.62 | 0.53 | -8.75 | 0.2606 | -0.0144 | |||
| CLX / The Clorox Company | 0.00 | 0.52 | 0.2523 | 0.2523 | |||||
| SO / The Southern Company | 0.01 | -0.40 | 0.51 | 18.79 | 0.2508 | 0.0475 | |||
| EA / Electronic Arts Inc. | 0.01 | -25.13 | 0.51 | -44.50 | 0.2498 | -0.1837 | |||
| WM / Waste Management, Inc. | 0.00 | 9.31 | 0.45 | 18.85 | 0.2224 | 0.0422 | |||
| APD / Air Products and Chemicals, Inc. | 0.00 | 30.98 | 0.45 | 20.48 | 0.2219 | 0.0445 | |||
| CMS / CMS Energy Corporation | 0.01 | -17.42 | 0.42 | -9.76 | 0.2038 | -0.0137 | |||
| SCHW / The Charles Schwab Corporation | 0.01 | 0.41 | 0.2018 | 0.2018 | |||||
| LLY / Eli Lilly and Company | 0.00 | -2.46 | 0.41 | -33.50 | 0.2003 | -0.0898 | |||
| DIS / The Walt Disney Company | 0.00 | -5.20 | 0.40 | 10.68 | 0.1979 | 0.0257 | |||
| DBEF / DBX ETF Trust - Xtrackers MSCI EAFE Hedged Equity ETF | 0.01 | 0.39 | 0.1915 | 0.1915 | |||||
| MET / MetLife, Inc. | 0.01 | 0.37 | 0.1817 | 0.1817 | |||||
| HAS / Hasbro, Inc. | 0.00 | 0.36 | 0.1758 | 0.1758 | |||||
| GIS / General Mills, Inc. | 0.01 | -24.14 | 0.35 | -32.23 | 0.1709 | -0.0720 | |||
| SMG / The Scotts Miracle-Gro Company | 0.00 | 35.71 | 0.35 | 2.97 | 0.1700 | 0.0110 | |||
| AVA / Avista Corporation | 0.01 | -23.96 | 0.34 | 1.19 | 0.1670 | 0.0081 | |||
| VFH / Vanguard World Fund - Vanguard Financials ETF | 0.00 | 0.34 | 0.1665 | 0.1665 | |||||
| IJH / iShares Trust - iShares Core S&P Mid-Cap ETF | 0.00 | 13.00 | 0.33 | 23.05 | 0.1621 | 0.0352 | |||
| D / Dominion Energy, Inc. | 0.00 | -35.90 | 0.33 | -36.06 | 0.1607 | -0.0813 | |||
| T / AT&T Inc. | 0.01 | -9.99 | 0.32 | 12.72 | 0.1562 | 0.0228 | |||
| WFC / Wells Fargo & Company | 0.01 | -64.01 | 0.32 | -29.21 | 0.1543 | -0.0556 | |||
| KMB / Kimberly-Clark Corporation | 0.00 | -25.75 | 0.31 | -25.30 | 0.1504 | -0.0435 | |||
| XOM / Exxon Mobil Corporation | 0.00 | -38.74 | 0.30 | -3.19 | 0.1484 | 0.0008 | |||
| ILMN / Illumina, Inc. | 0.00 | 0.29 | 0.1411 | 0.1411 | |||||
| EFG / iShares Trust - iShares MSCI EAFE Growth ETF | 0.00 | -93.67 | 0.28 | -93.87 | 0.1352 | -1.9894 | |||
| IVW / iShares Trust - iShares S&P 500 Growth ETF | 0.00 | -0.46 | 0.27 | -13.74 | 0.1322 | -0.0154 | |||
| MMM / 3M Company | 0.00 | -38.49 | 0.26 | -35.18 | 0.1264 | -0.0614 | |||
| SCHD / Schwab Strategic Trust - Schwab U.S. Dividend Equity ETF | 0.00 | -3.46 | 0.26 | 1.98 | 0.1264 | 0.0070 | |||
| ADM / Archer-Daniels-Midland Company | 0.01 | 0.26 | 0.1254 | 0.1254 | |||||
| SCHZ / Schwab Strategic Trust - Schwab U.S. Aggregate Bond ETF | 0.00 | 0.23 | 0.1131 | 0.1131 | |||||
| KO / The Coca-Cola Company | 0.00 | 0.22 | 0.1078 | 0.1078 | |||||
| ED / Consolidated Edison, Inc. | 0.00 | 0.22 | 0.1068 | 0.1068 | |||||
| CDNS / Cadence Design Systems, Inc. | 0.00 | -100.00 | 0.00 | -100.00 | -0.3760 | ||||
| SCHX / Schwab Strategic Trust - Schwab U.S. Large-Cap ETF | 0.00 | -100.00 | 0.00 | -100.00 | -1.1571 | ||||
| VIG / Vanguard Specialized Funds - Vanguard Dividend Appreciation ETF | 0.00 | -100.00 | 0.00 | 0.0000 | |||||
| XLE / The Select Sector SPDR Trust - The Energy Select Sector SPDR Fund | 0.00 | -100.00 | 0.00 | -100.00 | -0.1288 | ||||
| NOW / ServiceNow, Inc. | 0.00 | -100.00 | 0.00 | -100.00 | -0.5071 | ||||
| SCHF / Schwab Strategic Trust - Schwab International Equity ETF | 0.00 | -100.00 | 0.00 | -100.00 | -2.6643 | ||||
| CVX / Chevron Corporation | 0.00 | -100.00 | 0.00 | -100.00 | -0.1354 | ||||
| UMPQ / Umpqua Holdings Corp | 0.00 | -100.00 | 0.00 | 0.0000 | |||||
| MCD / McDonald's Corporation | 0.00 | -100.00 | 0.00 | -100.00 | -0.1627 | ||||
| MO / Altria Group, Inc. | 0.00 | -100.00 | 0.00 | -100.00 | -0.0958 |