Statistik Asas
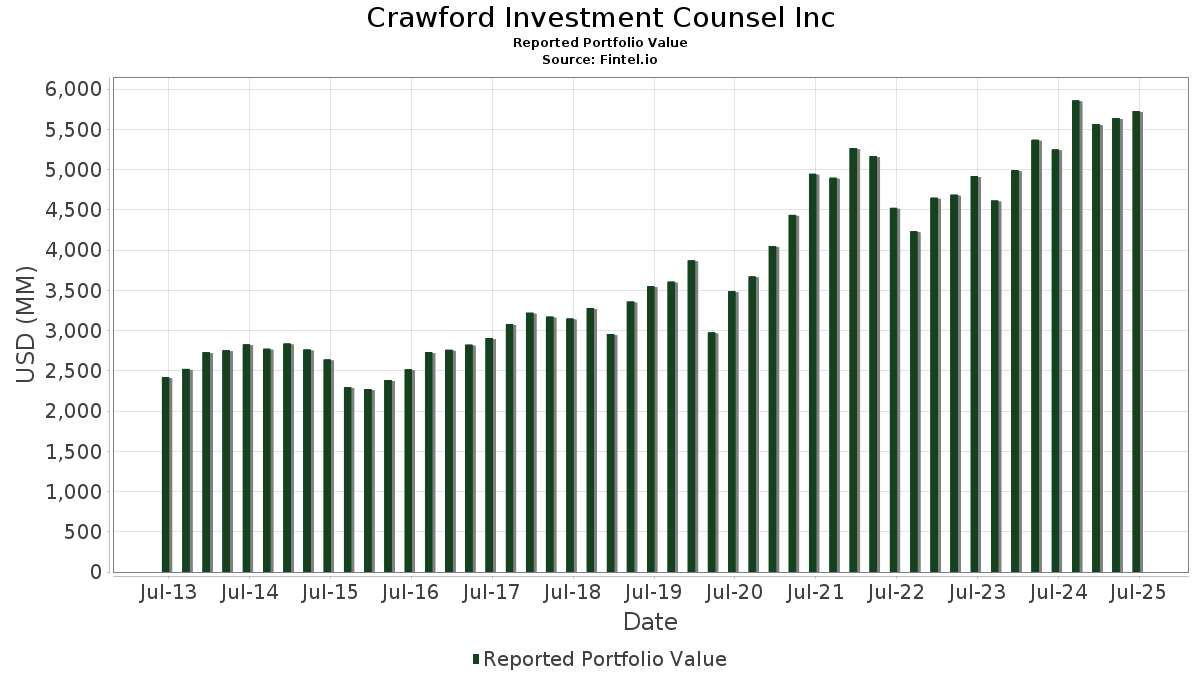
| Nilai Portfolio | $ 5,725,406,016 |
| Kedudukan Semasa | 291 |
Pegangan Terkini, Prestasi, AUM (dari 13F, 13D)
Crawford Investment Counsel Inc telah mendedahkan 291 jumlah pegangan dalam pemfailan SEC terkini mereka. Nilai portfolio terkini dikira sebagai $ 5,725,406,016 USD. Aset Sebenar Di Bawah Pengurusan (AUM) ialah nilai ini ditambah dengan tunai (yang tidak didedahkan). Pegangan teratas Crawford Investment Counsel Inc ialah Microsoft Corporation (US:MSFT) , AbbVie Inc. (US:ABBV) , Johnson Controls International plc (US:JCI) , Philip Morris International Inc. (US:PM) , and The Coca-Cola Company (US:KO) . Kedudukan baharu Crawford Investment Counsel Inc termasuk The Scotts Miracle-Gro Company (US:SMG) , FirstCash Holdings, Inc. (US:FCFS) , California Water Service Group (US:CWT) , Cognex Corporation (US:CGNX) , and Churchill Downs Incorporated (US:CHDN) .
Kenaikan Teratas Suku Tahun Ini
Kami menggunakan perubahan dalam peruntukan portfolio kerana ini adalah metrik yang paling bermakna. Perubahan boleh disebabkan oleh perdagangan atau perubahan dalam harga saham.
| Sekuriti | Saham (MM) |
Nilai (MM$) |
Portfolio % | ΔPortfolio % |
|---|---|---|---|---|
| 0.47 | 233.00 | 4.0695 | 0.8893 | |
| 0.29 | 43.56 | 0.7608 | 0.5261 | |
| 1.39 | 146.42 | 2.5574 | 0.4704 | |
| 0.49 | 91.93 | 1.6057 | 0.4478 | |
| 0.25 | 16.67 | 0.2912 | 0.2912 | |
| 0.34 | 108.64 | 1.8975 | 0.2559 | |
| 0.23 | 23.09 | 0.4033 | 0.2505 | |
| 0.61 | 103.58 | 1.8091 | 0.2368 | |
| 0.66 | 25.37 | 0.4431 | 0.2363 | |
| 0.17 | 27.04 | 0.4723 | 0.2208 |
Penurunan Teratas Suku Tahun Ini
Kami menggunakan perubahan dalam peruntukan portfolio kerana ini adalah metrik yang paling bermakna. Perubahan boleh disebabkan oleh perdagangan atau perubahan dalam harga saham.
| Sekuriti | Saham (MM) |
Nilai (MM$) |
Portfolio % | ΔPortfolio % |
|---|---|---|---|---|
| 0.06 | 4.71 | 0.0823 | -1.0478 | |
| 0.90 | 167.58 | 2.9269 | -0.5224 | |
| 0.50 | 36.24 | 0.6330 | -0.3599 | |
| 0.79 | 143.04 | 2.4984 | -0.3513 | |
| 0.03 | 0.43 | 0.0076 | -0.3332 | |
| 0.13 | 12.89 | 0.2251 | -0.3250 | |
| 0.03 | 0.68 | 0.0119 | -0.2818 | |
| 1.20 | 124.59 | 2.1760 | -0.1956 | |
| 0.02 | 1.51 | 0.0263 | -0.1847 | |
| 1.09 | 114.00 | 1.9911 | -0.1819 |
13F dan Pemfailan Dana
Borang ini telah difailkan pada 2025-08-14 untuk tempoh pelaporan 2025-06-30. Klik ikon pautan untuk melihat sejarah transaksi penuh.
Tingkatkan untuk membuka data premium dan eksport ke Excel ![]() .
.
| Sekuriti | Jenis | Purata Harga Saham | Saham (MM) |
ΔSaham (%) |
ΔSaham (%) |
Nilai ($MM) |
Portfolio (%) |
ΔPortfolio (%) |
|
|---|---|---|---|---|---|---|---|---|---|
| MSFT / Microsoft Corporation | 0.47 | -1.92 | 233.00 | 29.96 | 4.0695 | 0.8893 | |||
| ABBV / AbbVie Inc. | 0.90 | -2.72 | 167.58 | -13.82 | 2.9269 | -0.5224 | |||
| JCI / Johnson Controls International plc | 1.39 | -5.60 | 146.42 | 24.46 | 2.5574 | 0.4704 | |||
| PM / Philip Morris International Inc. | 0.79 | -22.40 | 143.04 | -10.96 | 2.4984 | -0.3513 | |||
| KO / The Coca-Cola Company | 1.90 | -2.82 | 134.51 | -4.01 | 2.3493 | -0.1363 | |||
| AEP / American Electric Power Company, Inc. | 1.20 | -1.86 | 124.59 | -6.81 | 2.1760 | -0.1956 | |||
| V / Visa Inc. | 0.35 | -2.00 | 123.08 | -0.71 | 2.1497 | -0.0494 | |||
| MDT / Medtronic plc | 1.34 | 0.48 | 117.11 | -2.53 | 2.0454 | -0.0859 | |||
| WEC / WEC Energy Group, Inc. | 1.09 | -2.67 | 114.00 | -6.94 | 1.9911 | -0.1819 | |||
| SAP / SAP SE - Depositary Receipt (Common Stock) | 0.36 | -4.45 | 109.97 | 8.24 | 1.9208 | 0.1185 | |||
| AXP / American Express Company | 0.34 | -0.98 | 108.64 | 17.40 | 1.8975 | 0.2559 | |||
| AZN / AstraZeneca PLC - Depositary Receipt (Common Stock) | 1.54 | -1.83 | 107.54 | -6.66 | 1.8782 | -0.1655 | |||
| RTX / RTX Corporation | 0.72 | -2.40 | 105.22 | 7.59 | 1.8377 | 0.1030 | |||
| HON / Honeywell International Inc. | 0.45 | -1.32 | 105.03 | 8.53 | 1.8344 | 0.1178 | |||
| TEL / TE Connectivity plc | 0.61 | -2.09 | 103.58 | 16.86 | 1.8091 | 0.2368 | |||
| UPS / United Parcel Service, Inc. | 1.02 | 4.47 | 102.62 | -4.13 | 1.7924 | -0.1065 | |||
| HD / The Home Depot, Inc. | 0.28 | -1.10 | 101.99 | -1.06 | 1.7813 | -0.0473 | |||
| GPC / Genuine Parts Company | 0.83 | 0.87 | 101.13 | 2.70 | 1.7663 | 0.0196 | |||
| ACN / Accenture plc | 0.33 | 3.57 | 97.22 | -0.80 | 1.6980 | -0.0404 | |||
| WTW / Willis Towers Watson Public Limited Company | 0.32 | 11.57 | 97.18 | 1.19 | 1.6973 | -0.0063 | |||
| SCHW / The Charles Schwab Corporation | 1.02 | -1.61 | 93.17 | 14.68 | 1.6273 | 0.1861 | |||
| PNC / The PNC Financial Services Group, Inc. | 0.49 | 32.80 | 91.93 | 40.84 | 1.6057 | 0.4478 | |||
| PG / The Procter & Gamble Company | 0.56 | -1.59 | 89.35 | -8.00 | 1.5605 | -0.1623 | |||
| SPGI / S&P Global Inc. | 0.17 | -1.68 | 87.58 | 2.04 | 1.5297 | 0.0071 | |||
| DGX / Quest Diagnostics Incorporated | 0.48 | -2.85 | 87.11 | 3.14 | 1.5215 | 0.0232 | |||
| DOX / Amdocs Limited | 0.93 | -1.40 | 84.46 | -1.68 | 1.4752 | -0.0487 | |||
| BLK / BlackRock, Inc. | 0.08 | -0.37 | 79.46 | 10.45 | 1.3879 | 0.1117 | |||
| OMC / Omnicom Group Inc. | 1.06 | 3.42 | 76.15 | -10.26 | 1.3301 | -0.1753 | |||
| CNQ / Canadian Natural Resources Limited | 2.33 | 1.67 | 73.24 | 3.65 | 1.2792 | 0.0258 | |||
| CAH / Cardinal Health, Inc. | 0.43 | -5.38 | 71.73 | 15.38 | 1.2529 | 0.1500 | |||
| JNJ / Johnson & Johnson | 0.43 | -0.61 | 65.60 | -8.46 | 1.1458 | -0.1254 | |||
| JPM / JPMorgan Chase & Co. | 0.22 | -7.39 | 64.12 | 9.46 | 1.1199 | 0.0807 | |||
| MMC / Marsh & McLennan Companies, Inc. | 0.29 | -1.52 | 62.72 | -11.76 | 1.0955 | -0.1655 | |||
| ROP / Roper Technologies, Inc. | 0.11 | 12.41 | 59.79 | 8.07 | 1.0443 | 0.0629 | |||
| ICE / Intercontinental Exchange, Inc. | 0.32 | 1.13 | 59.54 | 7.56 | 1.0400 | 0.0580 | |||
| ROST / Ross Stores, Inc. | 0.44 | 9.59 | 55.99 | 9.41 | 0.9779 | 0.0701 | |||
| PFE / Pfizer Inc. | 2.14 | -1.59 | 51.93 | -5.86 | 0.9070 | -0.0716 | |||
| AAPL / Apple Inc. | 0.25 | 5.79 | 51.50 | -2.28 | 0.8995 | -0.0354 | |||
| MDLZ / Mondelez International, Inc. | 0.74 | -0.56 | 49.59 | -1.16 | 0.8661 | -0.0239 | |||
| CSX / CSX Corporation | 1.49 | 3.95 | 48.70 | 15.25 | 0.8505 | 0.1010 | |||
| HBAN / Huntington Bancshares Incorporated | 2.66 | 4.37 | 44.59 | 16.54 | 0.7788 | 0.1001 | |||
| MAA / Mid-America Apartment Communities, Inc. | 0.29 | 272.81 | 43.56 | 229.29 | 0.7608 | 0.5261 | |||
| DUK / Duke Energy Corporation | 0.35 | -2.12 | 41.62 | -5.31 | 0.7270 | -0.0527 | |||
| AVGO / Broadcom Inc. | 0.13 | -8.49 | 36.39 | 50.65 | 0.6356 | 0.2071 | |||
| ARE / Alexandria Real Estate Equities, Inc. | 0.50 | -17.53 | 36.24 | -35.25 | 0.6330 | -0.3599 | |||
| CVX / Chevron Corporation | 0.25 | 19.44 | 35.70 | 2.23 | 0.6235 | 0.0041 | |||
| MSM / MSC Industrial Direct Co., Inc. | 0.40 | -1.69 | 33.98 | 7.61 | 0.5936 | 0.0333 | |||
| PRGO / Perrigo Company plc | 1.24 | 30.10 | 33.01 | 23.98 | 0.5765 | 0.1042 | |||
| ORCL / Oracle Corporation | 0.15 | -5.17 | 32.72 | 48.29 | 0.5715 | 0.1801 | |||
| KMI / Kinder Morgan, Inc. | 1.06 | -2.59 | 31.18 | 0.38 | 0.5446 | -0.0064 | |||
| PEGA / Pegasystems Inc. | 0.54 | 72.24 | 29.20 | 34.11 | 0.5100 | 0.1238 | |||
| PRU / Prudential Financial, Inc. | 0.27 | 2.80 | 28.93 | -1.11 | 0.5053 | -0.0136 | |||
| ESE / ESCO Technologies Inc. | 0.14 | -11.37 | 27.08 | 6.87 | 0.4729 | 0.0235 | |||
| ATR / AptarGroup, Inc. | 0.17 | 80.89 | 27.04 | 90.70 | 0.4723 | 0.2208 | |||
| EVRG / Evergy, Inc. | 0.39 | 36.32 | 26.88 | 36.28 | 0.4696 | 0.1196 | |||
| GSK / GSK plc - Depositary Receipt (Common Stock) | 0.66 | 119.58 | 25.37 | 117.66 | 0.4431 | 0.2363 | |||
| CCI / Crown Castle Inc. | 0.24 | 4.99 | 24.68 | 3.48 | 0.4310 | 0.0080 | |||
| DOC / Healthpeak Properties, Inc. | 1.41 | -8.89 | 24.61 | -21.10 | 0.4299 | -0.1235 | |||
| STAG / STAG Industrial, Inc. | 0.68 | -1.29 | 24.61 | -0.85 | 0.4298 | -0.0105 | |||
| LAMR / Lamar Advertising Company | 0.20 | 2.13 | 24.54 | 8.93 | 0.4287 | 0.0290 | |||
| TXN / Texas Instruments Incorporated | 0.12 | -1.30 | 24.46 | 14.04 | 0.4272 | 0.0467 | |||
| VZ / Verizon Communications Inc. | 0.56 | -2.02 | 24.45 | -6.53 | 0.4270 | -0.0370 | |||
| HAS / Hasbro, Inc. | 0.33 | -11.53 | 24.08 | 6.21 | 0.4206 | 0.0184 | |||
| D / Dominion Energy, Inc. | 0.43 | 0.62 | 24.08 | 1.43 | 0.4205 | -0.0006 | |||
| ORI / Old Republic International Corporation | 0.62 | -4.15 | 24.01 | -6.05 | 0.4194 | -0.0340 | |||
| SO / The Southern Company | 0.26 | 1.19 | 23.94 | 1.06 | 0.4181 | -0.0021 | |||
| APAM / Artisan Partners Asset Management Inc. | 0.52 | -0.67 | 23.14 | 12.61 | 0.4042 | 0.0397 | |||
| DEO / Diageo plc - Depositary Receipt (Common Stock) | 0.23 | 178.63 | 23.09 | 168.13 | 0.4033 | 0.2505 | |||
| IBM / International Business Machines Corporation | 0.08 | -36.13 | 22.37 | -24.28 | 0.3907 | -0.1333 | |||
| OKE / ONEOK, Inc. | 0.27 | -4.40 | 21.97 | -21.35 | 0.3837 | -0.1118 | |||
| CUBE / CubeSmart | 0.50 | 15.78 | 21.32 | 15.20 | 0.3724 | 0.0441 | |||
| DG / Dollar General Corporation | 0.18 | -10.88 | 20.77 | 15.93 | 0.3627 | 0.0449 | |||
| NVT / nVent Electric plc | 0.28 | -8.00 | 20.47 | 28.56 | 0.3576 | 0.0751 | |||
| MAN / ManpowerGroup Inc. | 0.49 | 91.35 | 19.88 | 33.57 | 0.3473 | 0.0832 | |||
| META / Meta Platforms, Inc. | 0.03 | -4.49 | 19.34 | 22.31 | 0.3377 | 0.0573 | |||
| GOOGL / Alphabet Inc. | 0.10 | -3.49 | 18.43 | 9.99 | 0.3220 | 0.0246 | |||
| PEP / PepsiCo, Inc. | 0.14 | 8.14 | 18.13 | -4.77 | 0.3167 | -0.0211 | |||
| LAZ / Lazard, Inc. | 0.37 | 2.38 | 17.93 | 13.45 | 0.3132 | 0.0328 | |||
| SSNC / SS&C Technologies Holdings, Inc. | 0.22 | -9.53 | 17.86 | -10.33 | 0.3120 | -0.0414 | |||
| ASO / Academy Sports and Outdoors, Inc. | 0.39 | 3.62 | 17.64 | 1.80 | 0.3081 | 0.0007 | |||
| SMG / The Scotts Miracle-Gro Company | 0.25 | 16.67 | 0.2912 | 0.2912 | |||||
| SBAC / SBA Communications Corporation | 0.07 | -16.43 | 16.31 | -10.79 | 0.2848 | -0.0395 | |||
| NTRS / Northern Trust Corporation | 0.13 | -1.26 | 16.27 | 26.90 | 0.2842 | 0.0567 | |||
| MRK / Merck & Co., Inc. | 0.20 | -25.30 | 16.01 | -34.13 | 0.2796 | -0.1515 | |||
| SBUX / Starbucks Corporation | 0.17 | -7.08 | 15.96 | -13.20 | 0.2787 | -0.0474 | |||
| CRM / Salesforce, Inc. | 0.06 | -3.74 | 15.13 | -2.18 | 0.2643 | -0.0101 | |||
| CNMD / CONMED Corporation | 0.29 | 0.78 | 14.99 | -13.09 | 0.2618 | -0.0441 | |||
| BKNG / Booking Holdings Inc. | 0.00 | -3.11 | 14.42 | 21.77 | 0.2518 | 0.0418 | |||
| GILD / Gilead Sciences, Inc. | 0.13 | -15.36 | 14.02 | -16.25 | 0.2449 | -0.0521 | |||
| DTM / DT Midstream, Inc. | 0.12 | -10.66 | 13.61 | 1.78 | 0.2377 | 0.0005 | |||
| WMB / The Williams Companies, Inc. | 0.21 | -2.83 | 13.03 | 2.13 | 0.2276 | 0.0013 | |||
| MRVL / Marvell Technology, Inc. | 0.17 | -5.69 | 12.90 | 18.55 | 0.2254 | 0.0323 | |||
| WMT / Walmart Inc. | 0.13 | -62.69 | 12.89 | -58.44 | 0.2251 | -0.3250 | |||
| KNTK / Kinetik Holdings Inc. | 0.28 | 3.03 | 12.36 | -12.62 | 0.2158 | -0.0350 | |||
| MOGA / Moog, Inc. - Class A | 0.07 | -1.86 | 12.14 | 2.46 | 0.2121 | 0.0018 | |||
| AZZ / AZZ Inc. | 0.12 | -8.59 | 11.41 | 3.30 | 0.1993 | 0.0033 | |||
| ARES / Ares Management Corporation | 0.07 | -9.22 | 11.35 | 7.24 | 0.1982 | 0.0105 | |||
| USPH / U.S. Physical Therapy, Inc. | 0.14 | 1.65 | 10.68 | 9.85 | 0.1866 | 0.0141 | |||
| MWA / Mueller Water Products, Inc. | 0.44 | -1.84 | 10.68 | -7.17 | 0.1866 | -0.0176 | |||
| THG / The Hanover Insurance Group, Inc. | 0.06 | -11.54 | 10.61 | -13.61 | 0.1853 | -0.0326 | |||
| HCKT / The Hackett Group, Inc. | 0.41 | 7.86 | 10.47 | -6.17 | 0.1829 | -0.0151 | |||
| SXI / Standex International Corporation | 0.07 | 2.68 | 10.43 | -0.45 | 0.1822 | -0.0037 | |||
| BDC / Belden Inc. | 0.09 | -15.12 | 10.18 | -1.96 | 0.1777 | -0.0064 | |||
| VMI / Valmont Industries, Inc. | 0.03 | -9.85 | 10.09 | 3.16 | 0.1763 | 0.0027 | |||
| POWI / Power Integrations, Inc. | 0.18 | 1.97 | 9.95 | 12.87 | 0.1738 | 0.0174 | |||
| SYK / Stryker Corporation | 0.02 | 0.00 | 9.78 | 6.28 | 0.1709 | 0.0076 | |||
| EXPD / Expeditors International of Washington, Inc. | 0.08 | -0.42 | 9.52 | -5.39 | 0.1662 | -0.0122 | |||
| LW / Lamb Weston Holdings, Inc. | 0.18 | -9.68 | 9.49 | -12.14 | 0.1657 | -0.0258 | |||
| TPB / Turning Point Brands, Inc. | 0.12 | -3.57 | 9.42 | 22.93 | 0.1645 | 0.0286 | |||
| IRT / Independence Realty Trust, Inc. | 0.53 | 2.43 | 9.34 | -14.65 | 0.1631 | -0.0310 | |||
| WFC.PRL / Wells Fargo & Company - Preferred Stock | 0.01 | -0.80 | 9.28 | -3.08 | 0.1621 | -0.0078 | |||
| LMAT / LeMaitre Vascular, Inc. | 0.11 | 1.84 | 9.22 | 0.82 | 0.1610 | -0.0012 | |||
| LFUS / Littelfuse, Inc. | 0.04 | 5.05 | 9.04 | 21.06 | 0.1578 | 0.0254 | |||
| BRK.B / Berkshire Hathaway Inc. | 0.02 | -1.81 | 8.73 | -10.43 | 0.1525 | -0.0204 | |||
| TRNO / Terreno Realty Corporation | 0.15 | 23.10 | 8.68 | 9.18 | 0.1516 | 0.0106 | |||
| SSB / SouthState Corporation | 0.09 | 1.41 | 8.06 | 0.54 | 0.1408 | -0.0014 | |||
| AEIS / Advanced Energy Industries, Inc. | 0.06 | 3.41 | 7.94 | 43.76 | 0.1387 | 0.0407 | |||
| HNI / HNI Corporation | 0.16 | -6.51 | 7.85 | 3.67 | 0.1371 | 0.0028 | |||
| HUBB / Hubbell Incorporated | 0.02 | -2.12 | 7.85 | 20.80 | 0.1370 | 0.0218 | |||
| CB / Chubb Limited | 0.03 | 0.00 | 7.81 | -4.07 | 0.1364 | -0.0080 | |||
| FELE / Franklin Electric Co., Inc. | 0.09 | 8.04 | 7.69 | 3.28 | 0.1344 | 0.0022 | |||
| SYBT / Stock Yards Bancorp, Inc. | 0.10 | -18.42 | 7.64 | -6.72 | 0.1334 | -0.0118 | |||
| FUL / H.B. Fuller Company | 0.13 | -5.30 | 7.61 | 1.49 | 0.1330 | -0.0001 | |||
| CDRE / Cadre Holdings, Inc. | 0.23 | 2.40 | 7.46 | 10.15 | 0.1303 | 0.0101 | |||
| LLY / Eli Lilly and Company | 0.01 | 10.22 | 7.34 | 4.04 | 0.1283 | 0.0031 | |||
| TCBK / TriCo Bancshares | 0.18 | -5.84 | 7.34 | -4.61 | 0.1282 | -0.0083 | |||
| WPC / W. P. Carey Inc. | 0.12 | -3.63 | 7.29 | -4.74 | 0.1273 | -0.0084 | |||
| BKH / Black Hills Corporation | 0.12 | -5.99 | 6.88 | -13.05 | 0.1202 | -0.0202 | |||
| ALL / The Allstate Corporation | 0.03 | -1.95 | 6.74 | -4.68 | 0.1178 | -0.0077 | |||
| WD / Walker & Dunlop, Inc. | 0.10 | 9.90 | 6.72 | -9.26 | 0.1174 | -0.0140 | |||
| FCPT / Four Corners Property Trust, Inc. | 0.25 | -3.62 | 6.71 | -9.63 | 0.1172 | -0.0145 | |||
| PAYX / Paychex, Inc. | 0.04 | -0.11 | 6.55 | -5.81 | 0.1143 | -0.0090 | |||
| HXL / Hexcel Corporation | 0.11 | 4.31 | 6.44 | 7.60 | 0.1125 | 0.0063 | |||
| BANF / BancFirst Corporation | 0.05 | -10.17 | 6.35 | 1.08 | 0.1108 | -0.0005 | |||
| WSFS / WSFS Financial Corporation | 0.11 | -0.71 | 6.20 | 5.28 | 0.1083 | 0.0038 | |||
| XOM / Exxon Mobil Corporation | 0.06 | 1.53 | 6.19 | -7.97 | 0.1081 | -0.0112 | |||
| HLNE / Hamilton Lane Incorporated | 0.04 | -18.14 | 6.16 | -21.75 | 0.1076 | -0.0320 | |||
| PAHC / Phibro Animal Health Corporation | 0.24 | 2.09 | 6.03 | 22.06 | 0.1053 | 0.0177 | |||
| IPAR / Interparfums, Inc. | 0.04 | 1.24 | 5.80 | 16.74 | 0.1014 | 0.0132 | |||
| WHD / Cactus, Inc. | 0.13 | 8.98 | 5.57 | 3.98 | 0.0973 | 0.0022 | |||
| HRB / H&R Block, Inc. | 0.10 | -2.58 | 5.54 | -2.60 | 0.0968 | -0.0042 | |||
| NSA / National Storage Affiliates Trust | 0.17 | -13.56 | 5.35 | -29.82 | 0.0934 | -0.0418 | |||
| JJSF / J&J Snack Foods Corp. | 0.05 | 3.14 | 5.26 | -11.21 | 0.0918 | -0.0132 | |||
| MCD / McDonald's Corporation | 0.02 | 0.64 | 5.00 | -5.87 | 0.0874 | -0.0069 | |||
| MLAB / Mesa Laboratories, Inc. | 0.05 | 97.50 | 4.88 | 56.85 | 0.0852 | 0.0300 | |||
| WBS / Webster Financial Corporation | 0.09 | -13.15 | 4.78 | -8.00 | 0.0835 | -0.0087 | |||
| GPN / Global Payments Inc. | 0.06 | -90.95 | 4.71 | -92.60 | 0.0823 | -1.0478 | |||
| PIPR / Piper Sandler Companies | 0.02 | 2.14 | 4.64 | 14.62 | 0.0811 | 0.0092 | |||
| FHB / First Hawaiian, Inc. | 0.18 | 5.78 | 4.49 | 8.03 | 0.0785 | 0.0047 | |||
| FCFS / FirstCash Holdings, Inc. | 0.03 | 4.43 | 0.0773 | 0.0773 | |||||
| CCJ / Cameco Corporation | 0.06 | -22.65 | 4.37 | 39.50 | 0.0764 | 0.0208 | |||
| SCVL / Shoe Carnival, Inc. | 0.23 | -6.68 | 4.36 | -20.60 | 0.0762 | -0.0213 | |||
| COLM / Columbia Sportswear Company | 0.07 | 7.37 | 4.34 | -13.36 | 0.0758 | -0.0131 | |||
| CTS / CTS Corporation | 0.10 | -10.83 | 4.34 | -8.56 | 0.0758 | -0.0084 | |||
| ABT / Abbott Laboratories | 0.03 | -0.51 | 4.32 | 2.01 | 0.0755 | 0.0003 | |||
| MTB / M&T Bank Corporation | 0.02 | -18.08 | 4.17 | -11.09 | 0.0729 | -0.0104 | |||
| WDFC / WD-40 Company | 0.02 | -0.72 | 4.09 | -7.19 | 0.0715 | -0.0067 | |||
| UTZ / Utz Brands, Inc. | 0.32 | 5.59 | 4.03 | -5.89 | 0.0703 | -0.0056 | |||
| RCKY / Rocky Brands, Inc. | 0.18 | 2.26 | 4.01 | 30.63 | 0.0701 | 0.0156 | |||
| LSTR / Landstar System, Inc. | 0.03 | 3.59 | 4.01 | -4.14 | 0.0700 | -0.0041 | |||
| III / Information Services Group, Inc. | 0.82 | 1.01 | 3.93 | 23.98 | 0.0686 | 0.0124 | |||
| EMBC / Embecta Corp. | 0.40 | 10.90 | 3.90 | -15.72 | 0.0682 | -0.0140 | |||
| CWT / California Water Service Group | 0.09 | 3.89 | 0.0680 | 0.0680 | |||||
| NVDA / NVIDIA Corporation | 0.02 | -3.71 | 3.58 | 40.35 | 0.0625 | 0.0173 | |||
| EFX / Equifax Inc. | 0.01 | -7.55 | 3.50 | -1.55 | 0.0610 | -0.0019 | |||
| MCO / Moody's Corporation | 0.01 | -0.15 | 3.29 | 7.52 | 0.0574 | 0.0032 | |||
| COST / Costco Wholesale Corporation | 0.00 | 0.03 | 3.23 | 4.73 | 0.0564 | 0.0017 | |||
| AMZN / Amazon.com, Inc. | 0.01 | 9.54 | 3.09 | 26.33 | 0.0540 | 0.0106 | |||
| BRK.A / Berkshire Hathaway Inc. | 0.00 | 0.00 | 2.92 | -8.71 | 0.0509 | -0.0057 | |||
| BRO / Brown & Brown, Inc. | 0.03 | -14.42 | 2.85 | -23.74 | 0.0497 | -0.0165 | |||
| EMR / Emerson Electric Co. | 0.02 | -0.15 | 2.60 | 21.42 | 0.0453 | 0.0074 | |||
| DE / Deere & Company | 0.00 | 0.16 | 2.51 | 8.49 | 0.0438 | 0.0028 | |||
| LAKE / Lakeland Industries, Inc. | 0.18 | 6.36 | 2.49 | -28.71 | 0.0435 | -0.0185 | |||
| LOW / Lowe's Companies, Inc. | 0.01 | -0.72 | 2.45 | -5.56 | 0.0427 | -0.0032 | |||
| TMO / Thermo Fisher Scientific Inc. | 0.01 | -0.08 | 2.41 | -18.57 | 0.0421 | -0.0104 | |||
| CAT / Caterpillar Inc. | 0.01 | 2.92 | 2.34 | 21.15 | 0.0408 | 0.0066 | |||
| CGNX / Cognex Corporation | 0.07 | 2.21 | 0.0386 | 0.0386 | |||||
| AFL / Aflac Incorporated | 0.02 | 3.76 | 2.20 | -1.61 | 0.0385 | -0.0012 | |||
| AMGN / Amgen Inc. | 0.01 | 1.35 | 2.18 | -9.19 | 0.0382 | -0.0045 | |||
| TGT / Target Corporation | 0.02 | -0.76 | 2.04 | -6.18 | 0.0355 | -0.0029 | |||
| COF / Capital One Financial Corporation | 0.01 | 9.61 | 2.03 | 30.04 | 0.0355 | 0.0078 | |||
| CSCO / Cisco Systems, Inc. | 0.03 | -0.21 | 1.97 | 12.22 | 0.0345 | 0.0033 | |||
| ADP / Automatic Data Processing, Inc. | 0.01 | 6.52 | 1.97 | 7.49 | 0.0343 | 0.0019 | |||
| ETN / Eaton Corporation plc | 0.01 | -3.34 | 1.95 | 27.00 | 0.0341 | 0.0068 | |||
| TPL / Texas Pacific Land Corporation | 0.00 | -5.49 | 1.91 | -24.63 | 0.0334 | -0.0116 | |||
| GOOG / Alphabet Inc. | 0.01 | 6.43 | 1.91 | 20.91 | 0.0333 | 0.0053 | |||
| CL / Colgate-Palmolive Company | 0.02 | -1.89 | 1.88 | -4.85 | 0.0329 | -0.0022 | |||
| HLI / Houlihan Lokey, Inc. | 0.01 | -18.22 | 1.70 | -8.88 | 0.0298 | -0.0034 | |||
| WWD / Woodward, Inc. | 0.01 | -83.72 | 1.57 | -78.14 | 0.0274 | -0.0999 | |||
| PGR / The Progressive Corporation | 0.01 | 12.07 | 1.55 | 5.73 | 0.0271 | 0.0011 | |||
| NKE / NIKE, Inc. | 0.02 | -88.68 | 1.51 | -87.33 | 0.0263 | -0.1847 | |||
| CLX / The Clorox Company | 0.01 | -6.38 | 1.50 | -23.67 | 0.0261 | -0.0086 | |||
| BR / Broadridge Financial Solutions, Inc. | 0.01 | 6.11 | 1.48 | 6.34 | 0.0258 | 0.0012 | |||
| MO / Altria Group, Inc. | 0.02 | 0.13 | 1.45 | -2.17 | 0.0252 | -0.0010 | |||
| LPLA / LPL Financial Holdings Inc. | 0.00 | -22.26 | 1.44 | -10.87 | 0.0252 | -0.0035 | |||
| KMB / Kimberly-Clark Corporation | 0.01 | -0.62 | 1.42 | -9.94 | 0.0249 | -0.0032 | |||
| AZO / AutoZone, Inc. | 0.00 | -0.27 | 1.39 | -2.87 | 0.0243 | -0.0011 | |||
| GE / General Electric Company | 0.01 | 5.00 | 1.35 | 34.97 | 0.0236 | 0.0059 | |||
| NEE / NextEra Energy, Inc. | 0.02 | -1.35 | 1.33 | -3.34 | 0.0232 | -0.0012 | |||
| LMT / Lockheed Martin Corporation | 0.00 | 0.39 | 1.32 | 4.09 | 0.0231 | 0.0006 | |||
| ABCB / Ameris Bancorp | 0.02 | 0.00 | 1.29 | 12.40 | 0.0225 | 0.0022 | |||
| SCI / Service Corporation International | 0.01 | -22.47 | 1.15 | -21.31 | 0.0201 | -0.0059 | |||
| AOS / A. O. Smith Corporation | 0.02 | -16.25 | 1.15 | -15.99 | 0.0200 | -0.0042 | |||
| PPG / PPG Industries, Inc. | 0.01 | -21.67 | 1.12 | -18.53 | 0.0196 | -0.0048 | |||
| XYL / Xylem Inc. | 0.01 | -22.40 | 1.12 | -15.98 | 0.0195 | -0.0041 | |||
| ZBH / Zimmer Biomet Holdings, Inc. | 0.01 | -4.69 | 1.08 | -23.19 | 0.0189 | -0.0061 | |||
| WFC / Wells Fargo & Company | 0.01 | 14.10 | 1.03 | 27.32 | 0.0180 | 0.0036 | |||
| MA / Mastercard Incorporated | 0.00 | -8.32 | 1.00 | -6.00 | 0.0175 | -0.0014 | |||
| WSO / Watsco, Inc. | 0.00 | 0.31 | 1.00 | -12.78 | 0.0175 | -0.0029 | |||
| RVTY / Revvity, Inc. | 0.01 | -1.84 | 0.95 | -10.27 | 0.0166 | -0.0022 | |||
| MCRI / Monarch Casino & Resort, Inc. | 0.01 | -25.78 | 0.93 | -17.51 | 0.0163 | -0.0038 | |||
| CASY / Casey's General Stores, Inc. | 0.00 | 0.00 | 0.87 | 17.52 | 0.0152 | 0.0021 | |||
| APH / Amphenol Corporation | 0.01 | 7.75 | 0.87 | 62.29 | 0.0151 | 0.0057 | |||
| MET / MetLife, Inc. | 0.01 | 291.48 | 0.86 | 293.12 | 0.0150 | 0.0111 | |||
| T / AT&T Inc. | 0.03 | 33.47 | 0.84 | 36.75 | 0.0147 | 0.0038 | |||
| RMD / ResMed Inc. | 0.00 | -57.43 | 0.84 | -50.94 | 0.0146 | -0.0157 | |||
| EPD / Enterprise Products Partners L.P. - Limited Partnership | 0.03 | -1.47 | 0.83 | -10.54 | 0.0145 | -0.0020 | |||
| UNP / Union Pacific Corporation | 0.00 | -1.64 | 0.83 | -4.18 | 0.0144 | -0.0009 | |||
| BK / The Bank of New York Mellon Corporation | 0.01 | 0.40 | 0.79 | 9.03 | 0.0137 | 0.0009 | |||
| DIS / The Walt Disney Company | 0.01 | 0.67 | 0.78 | 26.34 | 0.0136 | 0.0027 | |||
| GWW / W.W. Grainger, Inc. | 0.00 | 0.41 | 0.76 | 5.69 | 0.0133 | 0.0005 | |||
| COP / ConocoPhillips | 0.01 | 10.58 | 0.76 | -5.49 | 0.0132 | -0.0010 | |||
| GEV / GE Vernova Inc. | 0.00 | 2.15 | 0.76 | 77.23 | 0.0132 | 0.0056 | |||
| NUE / Nucor Corporation | 0.01 | 0.87 | 0.71 | 8.62 | 0.0123 | 0.0008 | |||
| SLP / Simulations Plus, Inc. | 0.04 | -0.96 | 0.71 | -29.47 | 0.0123 | -0.0054 | |||
| KHC / The Kraft Heinz Company | 0.03 | -95.16 | 0.68 | -95.89 | 0.0119 | -0.2818 | |||
| MNRO / Monro, Inc. | 0.04 | -34.04 | 0.65 | -32.08 | 0.0114 | -0.0056 | |||
| CBSH / Commerce Bancshares, Inc. | 0.01 | 0.00 | 0.65 | -0.15 | 0.0114 | -0.0002 | |||
| ECL / Ecolab Inc. | 0.00 | -0.54 | 0.64 | 5.78 | 0.0112 | 0.0004 | |||
| AJG / Arthur J. Gallagher & Co. | 0.00 | -22.98 | 0.64 | -28.54 | 0.0111 | -0.0047 | |||
| BAC / Bank of America Corporation | 0.01 | -0.97 | 0.62 | 12.20 | 0.0108 | 0.0010 | |||
| NOC / Northrop Grumman Corporation | 0.00 | 5.48 | 0.61 | 3.06 | 0.0106 | 0.0001 | |||
| QCOM / QUALCOMM Incorporated | 0.00 | -0.50 | 0.57 | 3.06 | 0.0100 | 0.0002 | |||
| TPR / Tapestry, Inc. | 0.01 | 1.22 | 0.57 | 26.39 | 0.0100 | 0.0019 | |||
| ITW / Illinois Tool Works Inc. | 0.00 | -2.57 | 0.54 | -2.86 | 0.0095 | -0.0004 | |||
| MFC / Manulife Financial Corporation | 0.02 | 0.00 | 0.54 | 2.66 | 0.0095 | 0.0001 | |||
| MCHP / Microchip Technology Incorporated | 0.01 | -1.89 | 0.54 | 42.55 | 0.0094 | 0.0027 | |||
| CHDN / Churchill Downs Incorporated | 0.01 | 0.53 | 0.0093 | 0.0093 | |||||
| INFY / Infosys Limited - Depositary Receipt (Common Stock) | 0.03 | 0.00 | 0.52 | 1.37 | 0.0091 | -0.0000 | |||
| MMM / 3M Company | 0.00 | 10.18 | 0.50 | 14.45 | 0.0087 | 0.0010 | |||
| CINF / Cincinnati Financial Corporation | 0.00 | 0.00 | 0.50 | 0.81 | 0.0087 | -0.0001 | |||
| WRB / W. R. Berkley Corporation | 0.01 | 0.00 | 0.50 | 3.13 | 0.0087 | 0.0001 | |||
| JOUT / Johnson Outdoors Inc. | 0.02 | -23.21 | 0.47 | -6.61 | 0.0082 | -0.0007 | |||
| UNH / UnitedHealth Group Incorporated | 0.00 | -13.19 | 0.47 | -48.28 | 0.0081 | -0.0079 | |||
| NSC / Norfolk Southern Corporation | 0.00 | 0.73 | 0.46 | 8.73 | 0.0081 | 0.0005 | |||
| WM / Waste Management, Inc. | 0.00 | 0.00 | 0.46 | -1.30 | 0.0080 | -0.0002 | |||
| FLO / Flowers Foods, Inc. | 0.03 | -97.31 | 0.43 | -97.74 | 0.0076 | -0.3332 | |||
| PSX / Phillips 66 | 0.00 | 5.64 | 0.43 | 1.91 | 0.0075 | 0.0000 | |||
| MS / Morgan Stanley | 0.00 | -12.43 | 0.41 | 5.64 | 0.0072 | 0.0003 | |||
| BX / Blackstone Inc. | 0.00 | -6.20 | 0.41 | 0.25 | 0.0071 | -0.0001 | |||
| BMY / Bristol-Myers Squibb Company | 0.01 | -6.89 | 0.40 | -29.37 | 0.0071 | -0.0031 | |||
| AMAT / Applied Materials, Inc. | 0.00 | 1.10 | 0.39 | 27.72 | 0.0068 | 0.0014 | |||
| TFC / Truist Financial Corporation | 0.01 | -12.18 | 0.38 | -8.37 | 0.0067 | -0.0007 | |||
| PEG / Public Service Enterprise Group Incorporated | 0.00 | 0.00 | 0.38 | 2.45 | 0.0066 | 0.0000 | |||
| SUI / Sun Communities, Inc. | 0.00 | 1.69 | 0.37 | 0.00 | 0.0065 | -0.0001 | |||
| LIN / Linde plc | 0.00 | 27.24 | 0.37 | 28.07 | 0.0064 | 0.0013 | |||
| RF / Regions Financial Corporation | 0.02 | 2.15 | 0.35 | 10.34 | 0.0062 | 0.0005 | |||
| TRMK / Trustmark Corporation | 0.01 | 0.00 | 0.35 | 5.76 | 0.0061 | 0.0002 | |||
| CEG / Constellation Energy Corporation | 0.00 | 6.19 | 0.35 | 69.76 | 0.0061 | 0.0025 | |||
| CARR / Carrier Global Corporation | 0.00 | 5.33 | 0.35 | 21.75 | 0.0061 | 0.0010 | |||
| INTC / Intel Corporation | 0.02 | 5.73 | 0.35 | 4.23 | 0.0060 | 0.0002 | |||
| GIS / General Mills, Inc. | 0.01 | -21.86 | 0.34 | -32.28 | 0.0060 | -0.0030 | |||
| HPE / Hewlett Packard Enterprise Company | 0.02 | -62.58 | 0.34 | -50.36 | 0.0060 | -0.0063 | |||
| MKC / McCormick & Company, Incorporated | 0.00 | 40.53 | 0.34 | 29.28 | 0.0060 | 0.0013 | |||
| ALK / Alaska Air Group, Inc. | 0.01 | 0.00 | 0.34 | 0.30 | 0.0059 | -0.0001 | |||
| AZTA / Azenta, Inc. | 0.01 | 0.00 | 0.34 | -11.11 | 0.0059 | -0.0008 | |||
| EQIX / Equinix, Inc. | 0.00 | 0.00 | 0.33 | -2.34 | 0.0058 | -0.0002 | |||
| CHD / Church & Dwight Co., Inc. | 0.00 | 0.00 | 0.32 | -12.57 | 0.0056 | -0.0009 | |||
| ESS / Essex Property Trust, Inc. | 0.00 | -73.84 | 0.30 | -75.86 | 0.0053 | -0.0170 | |||
| TSCO / Tractor Supply Company | 0.01 | 0.00 | 0.30 | -4.43 | 0.0053 | -0.0003 | |||
| FIS / Fidelity National Information Services, Inc. | 0.00 | 0.00 | 0.28 | 8.81 | 0.0050 | 0.0003 | |||
| ELV / Elevance Health, Inc. | 0.00 | 0.28 | 0.0050 | 0.0050 | |||||
| INTU / Intuit Inc. | 0.00 | 0.28 | 0.0050 | 0.0050 | |||||
| VLO / Valero Energy Corporation | 0.00 | -14.96 | 0.28 | -13.50 | 0.0049 | -0.0009 | |||
| USB / U.S. Bancorp | 0.01 | 2.84 | 0.28 | 10.20 | 0.0049 | 0.0004 | |||
| CRI / Carter's, Inc. | 0.01 | -32.30 | 0.28 | -50.18 | 0.0049 | -0.0050 | |||
| WELL / Welltower Inc. | 0.00 | 0.27 | 0.0046 | 0.0046 | |||||
| LHX / L3Harris Technologies, Inc. | 0.00 | 2.78 | 0.26 | 23.22 | 0.0045 | 0.0008 | |||
| AMT / American Tower Corporation | 0.00 | -7.09 | 0.25 | -5.32 | 0.0044 | -0.0003 | |||
| MAR / Marriott International, Inc. | 0.00 | 0.25 | 0.0043 | 0.0043 | |||||
| DOV / Dover Corporation | 0.00 | 0.00 | 0.23 | 4.57 | 0.0040 | 0.0001 | |||
| ISRG / Intuitive Surgical, Inc. | 0.00 | 0.22 | 0.0039 | 0.0039 | |||||
| SFL / SFL Corporation Ltd. | 0.03 | 25.60 | 0.22 | 27.81 | 0.0038 | 0.0008 | |||
| HCA / HCA Healthcare, Inc. | 0.00 | 0.21 | 0.0038 | 0.0038 | |||||
| TSM / Taiwan Semiconductor Manufacturing Company Limited - Depositary Receipt (Common Stock) | 0.00 | 0.21 | 0.0037 | 0.0037 | |||||
| AMP / Ameriprise Financial, Inc. | 0.00 | 0.21 | 0.0037 | 0.0037 | |||||
| ROK / Rockwell Automation, Inc. | 0.00 | 0.21 | 0.0036 | 0.0036 | |||||
| CHKP / Check Point Software Technologies Ltd. | 0.00 | 0.00 | 0.20 | -2.86 | 0.0036 | -0.0002 | |||
| SNV / Synovus Financial Corp. | 0.00 | 0.20 | 0.0036 | 0.0036 | |||||
| TSLA / Tesla, Inc. | 0.00 | 0.20 | 0.0035 | 0.0035 | |||||
| TK / Teekay Corporation Ltd. | 0.02 | 0.00 | 0.19 | 25.17 | 0.0033 | 0.0006 | |||
| DHR / Danaher Corporation | 0.00 | -100.00 | 0.00 | 0.0000 | |||||
| SYY / Sysco Corporation | 0.00 | -100.00 | 0.00 | 0.0000 | |||||
| ESPR / Esperion Therapeutics, Inc. | 0.00 | -100.00 | 0.00 | 0.0000 | |||||
| TNC / Tennant Company | 0.00 | -100.00 | 0.00 | 0.0000 | |||||
| BSX / Boston Scientific Corporation | 0.00 | -100.00 | 0.00 | 0.0000 | |||||
| NFLX / Netflix, Inc. | 0.00 | -100.00 | 0.00 | 0.0000 | |||||
| LGTY / Logility Supply Chain Solutions, Inc. | 0.00 | -100.00 | 0.00 | 0.0000 | |||||
| BDX / Becton, Dickinson and Company | 0.00 | -100.00 | 0.00 | 0.0000 | |||||
| CMCSA / Comcast Corporation | 0.00 | -100.00 | 0.00 | 0.0000 | |||||
| GL / Globe Life Inc. | 0.00 | -100.00 | 0.00 | 0.0000 | |||||
| BFB / Brown-Forman Corp. - Class B | 0.00 | -100.00 | 0.00 | 0.0000 | |||||
| TJX / The TJX Companies, Inc. | 0.00 | -100.00 | 0.00 | 0.0000 |