Statistik Asas
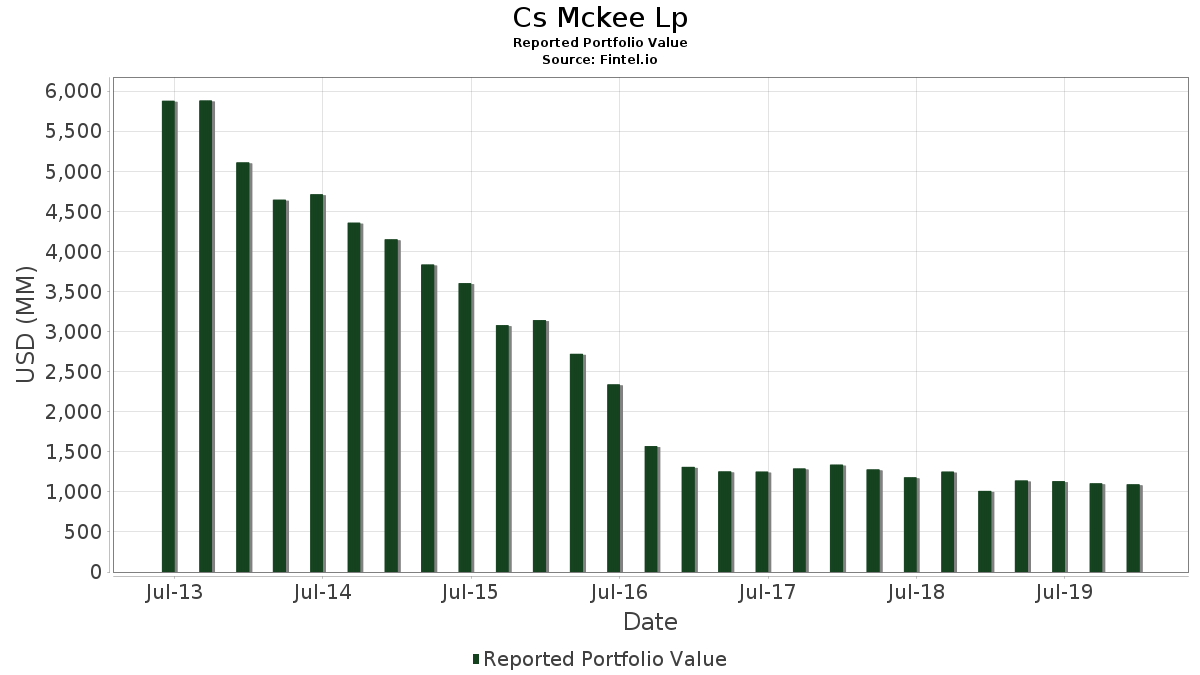
| Nilai Portfolio | $ 1,093,165,000 |
| Kedudukan Semasa | 100 |
Pegangan Terkini, Prestasi, AUM (dari 13F, 13D)
Cs Mckee Lp telah mendedahkan 100 jumlah pegangan dalam pemfailan SEC terkini mereka. Nilai portfolio terkini dikira sebagai $ 1,093,165,000 USD. Aset Sebenar Di Bawah Pengurusan (AUM) ialah nilai ini ditambah dengan tunai (yang tidak didedahkan). Pegangan teratas Cs Mckee Lp ialah Apple Inc. (US:AAPL) , Microsoft Corporation (US:MSFT) , Intel Corporation (US:INTC) , JPMorgan Chase & Co. (US:JPM) , and AT&T Inc. (US:T) . Kedudukan baharu Cs Mckee Lp termasuk Bristol-Myers Squibb Company (US:BMY) , ViacomCBS Inc (US:) , Bristol Meyers Squibb CVR Exp. 12/31/2020 (US:110122157) , .
Kenaikan Teratas Suku Tahun Ini
Kami menggunakan perubahan dalam peruntukan portfolio kerana ini adalah metrik yang paling bermakna. Perubahan boleh disebabkan oleh perdagangan atau perubahan dalam harga saham.
| Sekuriti | Saham (MM) |
Nilai (MM$) |
Portfolio % | ΔPortfolio % |
|---|---|---|---|---|
| 0.11 | 16.69 | 1.5269 | 0.9643 | |
| 0.15 | 9.63 | 0.8814 | 0.8814 | |
| 0.21 | 62.15 | 5.6852 | 0.8087 | |
| 0.05 | 18.68 | 1.7088 | 0.3924 | |
| 0.29 | 18.26 | 1.6703 | 0.3717 | |
| 0.09 | 3.92 | 0.3584 | 0.3584 | |
| 0.07 | 21.97 | 2.0094 | 0.3092 | |
| 0.46 | 5.99 | 0.5481 | 0.2464 | |
| 0.10 | 21.94 | 2.0074 | 0.1742 | |
| 0.17 | 10.94 | 1.0007 | 0.1579 |
Penurunan Teratas Suku Tahun Ini
Kami menggunakan perubahan dalam peruntukan portfolio kerana ini adalah metrik yang paling bermakna. Perubahan boleh disebabkan oleh perdagangan atau perubahan dalam harga saham.
| Sekuriti | Saham (MM) |
Nilai (MM$) |
Portfolio % | ΔPortfolio % |
|---|---|---|---|---|
| 0.02 | 0.59 | 0.0536 | -24,062.4800 | |
| 0.00 | 0.00 | -1.4436 | ||
| 0.00 | 0.00 | -0.7917 | ||
| 0.15 | 16.05 | 1.4686 | -0.4884 | |
| 0.00 | 0.00 | -0.3763 | ||
| 0.18 | 31.83 | 2.9121 | -0.3193 | |
| 0.84 | 32.66 | 2.9878 | -0.2770 | |
| 0.48 | 23.20 | 2.1218 | -0.2445 | |
| 0.19 | 16.40 | 1.5006 | -0.2441 | |
| 0.25 | 14.77 | 1.3508 | -0.2227 |
13F dan Pemfailan Dana
Borang ini telah difailkan pada 2020-02-14 untuk tempoh pelaporan 2019-12-31. Klik ikon pautan untuk melihat sejarah transaksi penuh.
Tingkatkan untuk membuka data premium dan eksport ke Excel ![]() .
.
| Sekuriti | Jenis | Purata Harga Saham | Saham (MM) |
ΔSaham (%) |
ΔSaham (%) |
Nilai ($MM) |
Portfolio (%) |
ΔPortfolio (%) |
|
|---|---|---|---|---|---|---|---|---|---|
| AAPL / Apple Inc. | 0.21 | -12.07 | 62.15 | 15.29 | 5.6852 | 0.8087 | |||
| MSFT / Microsoft Corporation | 0.32 | -10.87 | 50.49 | 1.10 | 4.6185 | 0.1009 | |||
| INTC / Intel Corporation | 0.63 | -12.13 | 37.97 | 2.05 | 3.4730 | 0.1076 | |||
| JPM / JPMorgan Chase & Co. | 0.27 | -13.98 | 37.30 | 1.88 | 3.4124 | 0.1003 | |||
| T / AT&T Inc. | 0.84 | -12.37 | 32.66 | -9.50 | 2.9878 | -0.2770 | |||
| HON / Honeywell International Inc. | 0.18 | -14.81 | 31.83 | -10.88 | 2.9121 | -0.3193 | |||
| DIS / The Walt Disney Company | 0.21 | -9.18 | 30.73 | 0.79 | 2.8112 | 0.0530 | |||
| GOOG / Alphabet Inc. | 0.02 | -10.89 | 27.96 | -2.26 | 2.5579 | -0.0301 | |||
| WMT / Walmart Inc. | 0.21 | -9.61 | 24.43 | -9.48 | 2.2351 | -0.2067 | |||
| ABT / Abbott Laboratories | 0.27 | -7.66 | 23.88 | -4.13 | 2.1848 | -0.0689 | |||
| META / Meta Platforms, Inc. | 0.11 | -10.66 | 23.39 | 2.97 | 2.1395 | 0.0848 | |||
| CSCO / Cisco Systems, Inc. | 0.48 | -8.65 | 23.20 | -11.33 | 2.1218 | -0.2445 | |||
| DE / Deere & Company | 0.13 | -9.43 | 22.39 | -6.97 | 2.0479 | -0.1289 | |||
| BIIB / Biogen Inc. | 0.07 | -8.30 | 21.97 | 16.87 | 2.0094 | 0.3092 | |||
| GS / The Goldman Sachs Group, Inc. | 0.10 | -2.40 | 21.94 | 8.29 | 2.0074 | 0.1742 | |||
| DFS / Discover Financial Services | 0.25 | -11.58 | 21.11 | -7.52 | 1.9306 | -0.1337 | |||
| DAL / Delta Air Lines, Inc. | 0.36 | -7.67 | 20.97 | -6.26 | 1.9180 | -0.1054 | |||
| WFC / Wells Fargo & Company | 0.38 | 0.86 | 20.27 | 7.58 | 1.8540 | 0.1498 | |||
| TROW / T. Rowe Price Group, Inc. | 0.17 | -8.16 | 20.16 | -2.06 | 1.8437 | -0.0179 | |||
| EOG / EOG Resources, Inc. | 0.23 | -8.30 | 18.91 | 3.48 | 1.7301 | 0.0768 | |||
| HUM / Humana Inc. | 0.05 | -10.45 | 18.68 | 28.37 | 1.7088 | 0.3924 | |||
| NCLH / Norwegian Cruise Line Holdings Ltd. | 0.31 | -7.97 | 18.31 | 3.83 | 1.6746 | 0.0797 | |||
| DELL / Dell Technologies Inc. | 0.36 | -7.65 | 18.29 | -8.49 | 1.6728 | -0.1348 | |||
| CNC / Centene Corporation | 0.29 | -12.48 | 18.26 | 27.20 | 1.6703 | 0.3717 | |||
| DOV / Dover Corporation | 0.15 | -11.44 | 17.66 | 2.52 | 1.6153 | 0.0572 | |||
| DKS / DICK'S Sporting Goods, Inc. | 0.34 | -14.69 | 17.01 | 3.45 | 1.5560 | 0.0687 | |||
| RTX / RTX Corporation | 0.11 | 144.64 | 16.69 | 168.36 | 1.5269 | 0.9643 | |||
| SBUX / Starbucks Corporation | 0.19 | -14.46 | 16.40 | -14.95 | 1.5006 | -0.2441 | |||
| EXPE / Expedia Group, Inc. | 0.15 | -7.77 | 16.05 | -25.79 | 1.4686 | -0.4884 | |||
| CVX / Chevron Corporation | 0.13 | 6.35 | 16.05 | 8.06 | 1.4682 | 0.1246 | |||
| BK / The Bank of New York Mellon Corporation | 0.31 | -9.45 | 15.77 | 0.81 | 1.4424 | 0.0274 | |||
| BWA / BorgWarner Inc. | 0.36 | -7.82 | 15.51 | 9.01 | 1.4189 | 0.1317 | |||
| ORCL / Oracle Corporation | 0.29 | -9.31 | 15.34 | -12.68 | 1.4029 | -0.1859 | |||
| NSC / Norfolk Southern Corporation | 0.08 | -7.68 | 15.17 | -0.24 | 1.3878 | 0.0121 | |||
| GOOGL / Alphabet Inc. | 0.01 | -9.37 | 14.89 | -0.59 | 1.3625 | 0.0071 | |||
| MPC / Marathon Petroleum Corporation | 0.25 | -14.41 | 14.77 | -15.11 | 1.3508 | -0.2227 | |||
| PEG / Public Service Enterprise Group Incorporated | 0.25 | -9.00 | 14.51 | -13.44 | 1.3272 | -0.1891 | |||
| CE / Celanese Corporation | 0.12 | -13.73 | 14.39 | -13.14 | 1.3166 | -0.1823 | |||
| MAR / Marriott International, Inc. | 0.10 | -14.41 | 14.39 | 4.21 | 1.3160 | 0.0672 | |||
| OXY / Occidental Petroleum Corporation | 0.34 | 17.40 | 14.20 | 8.79 | 1.2988 | 0.1182 | |||
| AIG / American International Group, Inc. | 0.27 | -8.32 | 13.69 | -15.51 | 1.2524 | -0.2134 | |||
| WBA / Walgreens Boots Alliance, Inc. | 0.23 | -7.43 | 13.66 | -1.32 | 1.2494 | -0.0027 | |||
| FFIV / F5, Inc. | 0.08 | -15.33 | 11.61 | -15.80 | 1.0616 | -0.1851 | |||
| NEE / NextEra Energy, Inc. | 0.05 | -10.61 | 11.12 | -7.08 | 1.0176 | -0.0654 | |||
| GILD / Gilead Sciences, Inc. | 0.17 | 14.52 | 10.94 | 17.41 | 1.0007 | 0.1579 | |||
| BKR / Baker Hughes Company | 0.39 | -6.69 | 9.91 | 3.09 | 0.9062 | 0.0369 | |||
| BMY / Bristol-Myers Squibb Company | 0.15 | 9.63 | 0.8814 | 0.8814 | |||||
| MMM / 3M Company | 0.05 | -14.59 | 8.94 | -8.34 | 0.8174 | -0.0645 | |||
| AXP / American Express Company | 0.05 | -12.13 | 6.67 | -7.51 | 0.6102 | -0.0422 | |||
| ALL / The Allstate Corporation | 0.06 | -11.09 | 6.40 | -8.01 | 0.5854 | -0.0439 | |||
| ABC / Amerisource Bergen Corp. | 0.07 | -10.61 | 6.16 | -7.68 | 0.5638 | -0.0401 | |||
| FCX / Freeport-McMoRan Inc. | 0.46 | 31.01 | 5.99 | 79.62 | 0.5481 | 0.2464 | |||
| 018490100 / Allergan plc | 0.03 | -7.34 | 5.84 | 5.27 | 0.5340 | 0.0323 | |||
| FHI / Federated Hermes, Inc. | 0.18 | -7.82 | 5.74 | -7.30 | 0.5247 | -0.0351 | |||
| A / Agilent Technologies, Inc. | 0.05 | -13.31 | 4.67 | -3.50 | 0.4268 | -0.0105 | |||
| USB / U.S. Bancorp | 0.07 | -10.99 | 4.37 | -4.65 | 0.3996 | -0.0148 | |||
| / ViacomCBS Inc | 0.09 | 3.92 | 0.3584 | 0.3584 | |||||
| EFA / iShares Trust - iShares MSCI EAFE ETF | 0.05 | 0.00 | 3.77 | 6.50 | 0.3450 | 0.0246 | |||
| PAGP / Plains GP Holdings, L.P. - Limited Partnership | 0.16 | -9.90 | 3.09 | -19.56 | 0.2825 | -0.0648 | |||
| IWM / iShares Trust - iShares Russell 2000 ETF | 0.02 | 0.00 | 2.86 | 9.44 | 0.2620 | 0.0253 | |||
| PM / Philip Morris International Inc. | 0.03 | -9.92 | 2.86 | 0.95 | 0.2614 | 0.0053 | |||
| TTC / The Toro Company | 0.03 | -1.50 | 2.61 | 7.05 | 0.2390 | 0.0182 | |||
| TGT / Target Corporation | 0.02 | -45.22 | 2.42 | -34.30 | 0.2216 | -0.1120 | |||
| SRE / Sempra | 0.02 | 0.00 | 2.04 | 1.54 | 0.1866 | 0.0049 | |||
| GTLS / Chart Industries, Inc. | 0.03 | -1.33 | 2.00 | 6.79 | 0.1828 | 0.0135 | |||
| D / Dominion Energy, Inc. | 0.02 | 0.00 | 1.95 | 2.21 | 0.1779 | 0.0058 | |||
| SMTC / Semtech Corporation | 0.04 | -1.55 | 1.85 | 7.18 | 0.1694 | 0.0131 | |||
| FWRD / Forward Air Corporation | 0.03 | 0.80 | 1.84 | 10.68 | 0.1687 | 0.0180 | |||
| SYNA / Synaptics Incorporated | 0.03 | 9.70 | 1.68 | 80.56 | 0.1538 | 0.0696 | |||
| SHOO / Steven Madden, Ltd. | 0.04 | -1.51 | 1.68 | 18.38 | 0.1538 | 0.0253 | |||
| ACLS / Axcelis Technologies, Inc. | 0.06 | -1.39 | 1.54 | 39.11 | 0.1409 | 0.0407 | |||
| LKFN / Lakeland Financial Corporation | 0.03 | 2.71 | 1.43 | 14.32 | 0.1307 | 0.0176 | |||
| LNN / Lindsay Corporation | 0.01 | 3.14 | 1.42 | 6.68 | 0.1300 | 0.0095 | |||
| SCE.PRH / SCE Trust III - Preferred Security | 0.06 | 0.00 | 1.38 | -1.15 | 0.1260 | -0.0000 | |||
| VRNT / Verint Systems Inc. | 0.02 | 3.57 | 1.35 | 34.06 | 0.1235 | 0.0324 | |||
| MTDR / Matador Resources Company | 0.07 | -1.53 | 1.33 | 7.07 | 0.1218 | 0.0093 | |||
| PBH / Prestige Consumer Healthcare Inc. | 0.03 | 7.95 | 1.31 | 26.10 | 0.1202 | 0.0259 | |||
| BANF / BancFirst Corporation | 0.02 | 2.33 | 1.24 | 15.30 | 0.1131 | 0.0161 | |||
| HWC / Hancock Whitney Corporation | 0.03 | 0.91 | 1.20 | 15.62 | 0.1097 | 0.0159 | |||
| FIBK / First Interstate BancSystem, Inc. | 0.03 | 1.14 | 1.19 | 5.31 | 0.1088 | 0.0066 | |||
| BHE / Benchmark Electronics, Inc. | 0.03 | 4.05 | 1.15 | 23.04 | 0.1050 | 0.0206 | |||
| HLIO / Helios Technologies, Inc. | 0.02 | 4.96 | 1.11 | 19.57 | 0.1012 | 0.0175 | |||
| TTMI / TTM Technologies, Inc. | 0.07 | 4.58 | 0.98 | 29.12 | 0.0896 | 0.0210 | |||
| PRAA / PRA Group, Inc. | 0.03 | 6.90 | 0.98 | 14.79 | 0.0895 | 0.0124 | |||
| ANIK / Anika Therapeutics, Inc. | 0.02 | 10.97 | 0.97 | 4.84 | 0.0892 | 0.0051 | |||
| MYGN / Myriad Genetics, Inc. | 0.03 | -1.59 | 0.93 | -6.37 | 0.0847 | -0.0048 | |||
| CAKE / The Cheesecake Factory Incorporated | 0.02 | 0.32 | 0.84 | -6.44 | 0.0770 | -0.0044 | |||
| CISN / Cision Ltd. | 0.08 | -1.57 | 0.81 | 27.74 | 0.0746 | 0.0168 | |||
| SUPN / Supernus Pharmaceuticals, Inc. | 0.03 | -1.46 | 0.80 | -14.93 | 0.0730 | -0.0119 | |||
| NP / Neenah Inc | 0.01 | -1.75 | 0.79 | 6.33 | 0.0722 | 0.0051 | |||
| FOE / Ferro Corp. | 0.04 | 18.40 | 0.65 | 47.95 | 0.0593 | 0.0197 | |||
| ALL.PRE / Allstate Corp. (The) | 0.02 | 120.00 | 0.59 | 120.30 | 0.0536 | -24,062.4800 | |||
| STT / State Street Corporation | 0.02 | 99.01 | 0.56 | 107.41 | 0.0512 | 0.0512 | |||
| NTCT / NetScout Systems, Inc. | 0.02 | 0.93 | 0.52 | 5.24 | 0.0478 | 0.0029 | |||
| CPS / Cooper-Standard Holdings Inc. | 0.01 | 26.73 | 0.47 | 2.85 | 0.0429 | 0.0017 | |||
| 110122157 / Bristol Meyers Squibb CVR Exp. 12/31/2020 | 0.15 | 0.45 | 0.0413 | 0.0413 | |||||
| UNFI / United Natural Foods, Inc. | 0.05 | -1.54 | 0.45 | -25.17 | 0.0411 | -0.0132 | |||
| US0605052861 / Bank of America Corp. 6.20% Preferred Perpetual Series CC | 0.01 | 0.00 | 0.29 | 1.41 | 0.0263 | 0.0007 | |||
| PNC.PRP / PNC Financial Services Group, Inc., 6.125% Dep Shares Fixed/Float Non-cum Preferred Stock P | 0.01 | 0.00 | 0.27 | 0.00 | 0.0251 | 0.0003 | |||
| US5538291023 / MVC Capital, Inc. | 0.03 | -2.40 | 0.24 | 0.41 | 0.0221 | 0.0003 | |||
| 19041P105 / CBS Corp. | 0.00 | -100.00 | 0.00 | -100.00 | -0.3763 | ||||
| KMT / Kennametal Inc. | 0.00 | -100.00 | 0.00 | -100.00 | -0.7917 | ||||
| CELG / Celgene Corp. | 0.00 | -100.00 | 0.00 | -100.00 | -1.4436 |