Statistik Asas
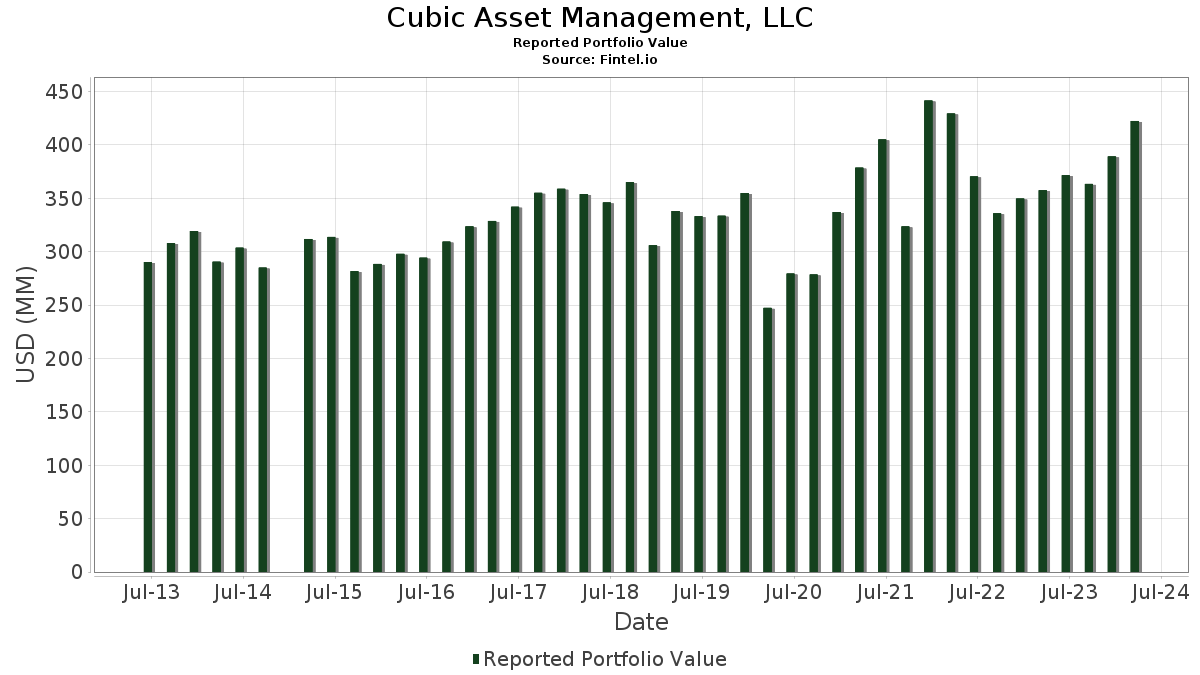
| Nilai Portfolio | $ 422,443,842 |
| Kedudukan Semasa | 202 |
Pegangan Terkini, Prestasi, AUM (dari 13F, 13D)
Cubic Asset Management, LLC telah mendedahkan 202 jumlah pegangan dalam pemfailan SEC terkini mereka. Nilai portfolio terkini dikira sebagai $ 422,443,842 USD. Aset Sebenar Di Bawah Pengurusan (AUM) ialah nilai ini ditambah dengan tunai (yang tidak didedahkan). Pegangan teratas Cubic Asset Management, LLC ialah Microsoft Corporation (US:MSFT) , Meta Platforms, Inc. (US:META) , Alphabet Inc. (US:GOOG) , The PNC Financial Services Group, Inc. (US:PNC) , and Berkshire Hathaway Inc. (US:BRK.B) . Kedudukan baharu Cubic Asset Management, LLC termasuk Lincoln National Corporation (US:LNC) , LSI Industries Inc. (US:LYTS) , Canadian Pacific Kansas City Limited (US:CP) , .
Kenaikan Teratas Suku Tahun Ini
Kami menggunakan perubahan dalam peruntukan portfolio kerana ini adalah metrik yang paling bermakna. Perubahan boleh disebabkan oleh perdagangan atau perubahan dalam harga saham.
| Sekuriti | Saham (MM) |
Nilai (MM$) |
Portfolio % | ΔPortfolio % |
|---|---|---|---|---|
| 0.04 | 17.29 | 4.0921 | 0.8479 | |
| 0.10 | 3.31 | 0.7841 | 0.7841 | |
| 0.00 | 3.81 | 0.9026 | 0.3657 | |
| 0.06 | 10.19 | 2.4112 | 0.2954 | |
| 0.04 | 5.30 | 1.2534 | 0.2452 | |
| 0.03 | 10.89 | 2.5770 | 0.2027 | |
| 0.03 | 5.58 | 1.3201 | 0.1941 | |
| 0.11 | 6.64 | 1.5720 | 0.1782 | |
| 0.04 | 8.07 | 1.9098 | 0.1720 | |
| 0.06 | 25.37 | 6.0052 | 0.1701 |
Penurunan Teratas Suku Tahun Ini
Kami menggunakan perubahan dalam peruntukan portfolio kerana ini adalah metrik yang paling bermakna. Perubahan boleh disebabkan oleh perdagangan atau perubahan dalam harga saham.
| Sekuriti | Saham (MM) |
Nilai (MM$) |
Portfolio % | ΔPortfolio % |
|---|---|---|---|---|
| 0.12 | 5.26 | 1.2447 | -0.3230 | |
| 0.01 | 5.88 | 1.3916 | -0.2593 | |
| 0.07 | 1.40 | 0.3315 | -0.1671 | |
| 0.02 | 4.96 | 1.1729 | -0.1546 | |
| 0.09 | 7.93 | 1.8778 | -0.1271 | |
| 0.01 | 2.24 | 0.5300 | -0.1159 | |
| 0.08 | 12.78 | 3.0242 | -0.1077 | |
| 0.04 | 5.70 | 1.3501 | -0.1020 | |
| 0.16 | 4.40 | 1.0406 | -0.0968 | |
| 0.04 | 3.50 | 0.8278 | -0.0967 |
13F dan Pemfailan Dana
Borang ini telah difailkan pada 2024-04-24 untuk tempoh pelaporan 2024-03-31. Klik ikon pautan untuk melihat sejarah transaksi penuh.
Tingkatkan untuk membuka data premium dan eksport ke Excel ![]() .
.
| Sekuriti | Jenis | Purata Harga Saham | Saham (MM) |
ΔSaham (%) |
ΔSaham (%) |
Nilai ($MM) |
Portfolio (%) |
ΔPortfolio (%) |
|
|---|---|---|---|---|---|---|---|---|---|
| MSFT / Microsoft Corporation | 0.06 | -0.16 | 25.37 | 11.70 | 6.0052 | 0.1701 | |||
| META / Meta Platforms, Inc. | 0.04 | -0.21 | 17.29 | 36.90 | 4.0921 | 0.8479 | |||
| GOOG / Alphabet Inc. | 0.09 | -0.57 | 13.94 | 7.42 | 3.2996 | -0.0340 | |||
| PNC / The PNC Financial Services Group, Inc. | 0.08 | 0.43 | 12.78 | 4.80 | 3.0242 | -0.1077 | |||
| BRK.B / Berkshire Hathaway Inc. | 0.03 | -0.09 | 10.89 | 17.80 | 2.5770 | 0.2027 | |||
| ALL / The Allstate Corporation | 0.06 | 0.07 | 10.19 | 23.68 | 2.4112 | 0.2954 | |||
| AXP / American Express Company | 0.04 | -1.86 | 8.07 | 19.28 | 1.9098 | 0.1720 | |||
| AFL / Aflac Incorporated | 0.09 | -2.33 | 7.93 | 1.65 | 1.8778 | -0.1271 | |||
| FDX / FedEx Corporation | 0.03 | 0.39 | 7.81 | 14.98 | 1.8496 | 0.1037 | |||
| LOW / Lowe's Companies, Inc. | 0.03 | 0.00 | 7.57 | 14.47 | 1.7922 | 0.0928 | |||
| LKQ / LKQ Corporation | 0.14 | 3.47 | 7.56 | 15.62 | 1.7888 | 0.1098 | |||
| ABBV / AbbVie Inc. | 0.04 | -0.18 | 7.23 | 17.30 | 1.7108 | 0.1278 | |||
| GS / The Goldman Sachs Group, Inc. | 0.02 | 0.00 | 7.13 | 8.27 | 1.6887 | -0.0041 | |||
| AMZN / Amazon.com, Inc. | 0.04 | 0.01 | 7.09 | 18.73 | 1.6795 | 0.1442 | |||
| OMC / Omnicom Group Inc. | 0.07 | 0.76 | 7.01 | 12.71 | 1.6603 | 0.0613 | |||
| MA / Mastercard Incorporated | 0.01 | 0.00 | 6.71 | 12.91 | 1.5883 | 0.0615 | |||
| C / Citigroup Inc. | 0.11 | -0.43 | 6.64 | 22.42 | 1.5720 | 0.1782 | |||
| CVS / CVS Health Corporation | 0.08 | 1.08 | 6.22 | 2.12 | 1.4734 | -0.0928 | |||
| UNH / UnitedHealth Group Incorporated | 0.01 | -2.64 | 5.88 | -8.51 | 1.3916 | -0.2593 | |||
| JNJ / Johnson & Johnson | 0.04 | -0.01 | 5.70 | 0.90 | 1.3501 | -0.1020 | |||
| DAL / Delta Air Lines, Inc. | 0.12 | 0.36 | 5.66 | 19.43 | 1.3401 | 0.1221 | |||
| AMAT / Applied Materials, Inc. | 0.03 | 0.00 | 5.58 | 27.25 | 1.3201 | 0.1941 | |||
| GPC / Genuine Parts Company | 0.04 | -0.36 | 5.55 | 11.47 | 1.3133 | 0.0344 | |||
| DIS / The Walt Disney Company | 0.04 | -0.44 | 5.30 | 34.94 | 1.2534 | 0.2452 | |||
| INTC / Intel Corporation | 0.12 | -1.97 | 5.26 | -13.82 | 1.2447 | -0.3230 | |||
| GPI / Group 1 Automotive, Inc. | 0.02 | 0.00 | 4.96 | -4.10 | 1.1729 | -0.1546 | |||
| CI / The Cigna Group | 0.01 | 2.58 | 4.67 | 24.41 | 1.1066 | 0.1413 | |||
| PFE / Pfizer Inc. | 0.16 | 3.02 | 4.40 | -0.72 | 1.0406 | -0.0968 | |||
| ADI / Analog Devices, Inc. | 0.02 | -0.35 | 4.22 | -0.73 | 0.9980 | -0.0932 | |||
| CSCO / Cisco Systems, Inc. | 0.08 | 4.04 | 3.86 | 2.79 | 0.9148 | -0.0512 | |||
| NVDA / NVIDIA Corporation | 0.00 | 0.00 | 3.81 | 82.53 | 0.9026 | 0.3657 | |||
| KMB / Kimberly-Clark Corporation | 0.03 | 2.53 | 3.70 | 9.14 | 0.8759 | 0.0049 | |||
| GNRC / Generac Holdings Inc. | 0.03 | 4.39 | 3.59 | 1.87 | 0.8495 | -0.0555 | |||
| V / Visa Inc. | 0.01 | 0.17 | 3.57 | 7.39 | 0.8458 | -0.0091 | |||
| SPY / SPDR S&P 500 ETF | 0.01 | 0.15 | 3.56 | 10.22 | 0.8428 | 0.0128 | |||
| TTD / The Trade Desk, Inc. | 0.04 | -20.00 | 3.50 | -2.83 | 0.8278 | -0.0967 | |||
| LNC / Lincoln National Corporation | 0.10 | 3.31 | 0.7841 | 0.7841 | |||||
| MRK / Merck & Co., Inc. | 0.03 | -0.20 | 3.31 | 20.80 | 0.7838 | 0.0795 | |||
| RTX / RTX Corporation | 0.03 | 2.10 | 3.21 | 18.32 | 0.7601 | 0.0630 | |||
| TEL / TE Connectivity plc | 0.02 | -0.47 | 3.20 | 2.89 | 0.7576 | -0.0416 | |||
| CMCSA / Comcast Corporation | 0.07 | -0.12 | 3.11 | -1.27 | 0.7363 | -0.0730 | |||
| ARCC / Ares Capital Corporation | 0.15 | 0.03 | 3.10 | 3.99 | 0.7349 | -0.0322 | |||
| DOW / Dow Inc. | 0.05 | 0.22 | 3.01 | 5.87 | 0.7126 | -0.0179 | |||
| MHO / M/I Homes, Inc. | 0.02 | 0.00 | 3.00 | -1.02 | 0.7099 | -0.0688 | |||
| SU / Suncor Energy Inc. | 0.07 | -0.62 | 2.65 | 14.52 | 0.6274 | 0.0326 | |||
| NEE.PRN / NextEra Energy Capital Holdings, Inc. - Corporate Bond/Note | 0.04 | 5.53 | 2.63 | 11.01 | 0.6232 | 0.0141 | |||
| VZ / Verizon Communications Inc. | 0.06 | -0.65 | 2.63 | 10.57 | 0.6216 | 0.0115 | |||
| BK / The Bank of New York Mellon Corporation | 0.04 | -0.06 | 2.55 | 10.65 | 0.6025 | 0.0115 | |||
| SNA / Snap-on Incorporated | 0.01 | -0.02 | 2.50 | 2.54 | 0.5928 | -0.0347 | |||
| BMY / Bristol-Myers Squibb Company | 0.05 | 2.36 | 2.48 | 8.16 | 0.5868 | -0.0019 | |||
| IP / International Paper Company | 0.06 | 0.00 | 2.42 | 7.94 | 0.5731 | -0.0032 | |||
| ABT / Abbott Laboratories | 0.02 | -0.16 | 2.41 | 3.07 | 0.5716 | -0.0301 | |||
| DVN / Devon Energy Corporation | 0.05 | 16.46 | 2.40 | 29.02 | 0.5686 | 0.0902 | |||
| NVS / Novartis AG - Depositary Receipt (Common Stock) | 0.02 | -0.84 | 2.27 | -5.02 | 0.5379 | -0.0767 | |||
| AAPL / Apple Inc. | 0.01 | 0.00 | 2.24 | -10.90 | 0.5300 | -0.1159 | |||
| IRM / Iron Mountain Incorporated | 0.03 | 0.00 | 2.21 | 14.59 | 0.5226 | 0.0277 | |||
| USB / U.S. Bancorp | 0.05 | 1.05 | 2.17 | 4.39 | 0.5128 | -0.0205 | |||
| COHR / Coherent Corp. | 0.04 | -1.07 | 2.12 | 37.79 | 0.5024 | 0.1066 | |||
| ITT / ITT Inc. | 0.02 | -3.60 | 2.11 | 9.88 | 0.5004 | 0.0062 | |||
| MDT / Medtronic plc | 0.02 | -1.15 | 2.01 | 4.59 | 0.4747 | -0.0180 | |||
| EFA / iShares Trust - iShares MSCI EAFE ETF | 0.02 | 0.06 | 1.95 | 6.05 | 0.4607 | -0.0108 | |||
| XOM / Exxon Mobil Corporation | 0.02 | -0.06 | 1.90 | 16.20 | 0.4501 | 0.0297 | |||
| AVT / Avnet, Inc. | 0.04 | 0.00 | 1.88 | -1.62 | 0.4449 | -0.0460 | |||
| TJX / The TJX Companies, Inc. | 0.02 | 0.00 | 1.85 | 8.08 | 0.4371 | -0.0017 | |||
| AME / AMETEK, Inc. | 0.01 | 0.00 | 1.81 | 10.91 | 0.4286 | 0.0092 | |||
| T / AT&T Inc. | 0.10 | -2.34 | 1.77 | 2.44 | 0.4182 | -0.0249 | |||
| DY / Dycom Industries, Inc. | 0.01 | -0.17 | 1.70 | 24.51 | 0.4030 | 0.0517 | |||
| DHI / D.R. Horton, Inc. | 0.01 | 0.00 | 1.65 | 8.29 | 0.3895 | -0.0010 | |||
| PGR / The Progressive Corporation | 0.01 | 0.00 | 1.62 | 29.93 | 0.3823 | 0.0627 | |||
| LCII / LCI Industries | 0.01 | 0.00 | 1.59 | -2.10 | 0.3753 | -0.0408 | |||
| GILD / Gilead Sciences, Inc. | 0.02 | 1.78 | 1.53 | -7.95 | 0.3618 | -0.0649 | |||
| CR / Crane Company | 0.01 | -0.69 | 1.46 | 13.56 | 0.3451 | 0.0154 | |||
| GJR / Strats Trust For Procter & Gambel Security - Preferred Security | 0.01 | 0.00 | 1.44 | 10.74 | 0.3417 | 0.0067 | |||
| TRV / The Travelers Companies, Inc. | 0.01 | 0.00 | 1.44 | 20.77 | 0.3402 | 0.0346 | |||
| LLY / Eli Lilly and Company | 0.00 | 0.00 | 1.42 | 33.49 | 0.3370 | 0.0629 | |||
| MSI / Motorola Solutions, Inc. | 0.00 | -3.97 | 1.42 | 8.85 | 0.3351 | 0.0010 | |||
| LEG / Leggett & Platt, Incorporated | 0.07 | -1.38 | 1.40 | -27.84 | 0.3315 | -0.1671 | |||
| UFPI / UFP Industries, Inc. | 0.01 | -7.37 | 1.39 | -9.26 | 0.3295 | -0.0645 | |||
| ORCL / Oracle Corporation | 0.01 | 0.00 | 1.38 | 19.10 | 0.3278 | 0.0292 | |||
| VRTX / Vertex Pharmaceuticals Incorporated | 0.00 | 0.00 | 1.34 | 2.69 | 0.3166 | -0.0179 | |||
| JPM / JPMorgan Chase & Co. | 0.01 | 0.47 | 1.32 | 18.26 | 0.3115 | 0.0257 | |||
| MET / MetLife, Inc. | 0.02 | 0.00 | 1.27 | 12.11 | 0.3002 | 0.0095 | |||
| COP / ConocoPhillips | 0.01 | 0.00 | 1.22 | 9.69 | 0.2896 | 0.0030 | |||
| CAH / Cardinal Health, Inc. | 0.01 | 0.00 | 1.22 | 10.96 | 0.2878 | 0.0064 | |||
| LSTR / Landstar System, Inc. | 0.01 | 0.00 | 1.21 | -0.49 | 0.2870 | -0.0259 | |||
| SPB / Spectrum Brands Holdings, Inc. | 0.01 | 0.00 | 1.20 | 11.56 | 0.2836 | 0.0077 | |||
| AON / Aon plc | 0.00 | -3.19 | 1.17 | 11.06 | 0.2759 | 0.0062 | |||
| BAC / Bank of America Corporation | 0.03 | 4.07 | 1.10 | 17.20 | 0.2615 | 0.0194 | |||
| TMHC / Taylor Morrison Home Corporation | 0.02 | -3.29 | 1.08 | 12.66 | 0.2551 | 0.0094 | |||
| GNTX / Gentex Corporation | 0.03 | 0.00 | 1.07 | 10.58 | 0.2526 | 0.0047 | |||
| MOD / Modine Manufacturing Company | 0.01 | -21.28 | 1.06 | 25.56 | 0.2501 | 0.0338 | |||
| LEN / Lennar Corporation | 0.01 | 0.00 | 1.05 | 15.40 | 0.2483 | 0.0148 | |||
| WHR / Whirlpool Corporation | 0.01 | 0.00 | 1.04 | -1.79 | 0.2464 | -0.0258 | |||
| MCD / McDonald's Corporation | 0.00 | 0.00 | 0.99 | -4.89 | 0.2349 | -0.0332 | |||
| GIS / General Mills, Inc. | 0.01 | 0.00 | 0.99 | 7.49 | 0.2344 | -0.0024 | |||
| SLB / Schlumberger Limited | 0.02 | 0.60 | 0.96 | 5.95 | 0.2276 | -0.0055 | |||
| AIZ / Assurant, Inc. | 0.01 | 0.00 | 0.96 | 11.76 | 0.2273 | 0.0065 | |||
| JCI / Johnson Controls International plc | 0.01 | 0.00 | 0.95 | 13.33 | 0.2254 | 0.0095 | |||
| BAX / Baxter International Inc. | 0.02 | -2.44 | 0.94 | 7.92 | 0.2226 | -0.0014 | |||
| PXD / Pioneer Natural Resources Company | 0.00 | 0.00 | 0.93 | 16.79 | 0.2190 | 0.0154 | |||
| MLR / Miller Industries, Inc. | 0.02 | 0.00 | 0.90 | 18.52 | 0.2121 | 0.0178 | |||
| JEF / Jefferies Financial Group Inc. | 0.02 | -0.37 | 0.89 | 8.71 | 0.2100 | 0.0004 | |||
| MAN / ManpowerGroup Inc. | 0.01 | 0.00 | 0.86 | -2.29 | 0.2025 | -0.0225 | |||
| AGX / Argan, Inc. | 0.02 | 0.00 | 0.85 | 7.98 | 0.2018 | -0.0010 | |||
| EOG / EOG Resources, Inc. | 0.01 | 0.00 | 0.84 | 5.66 | 0.1990 | -0.0053 | |||
| BFH / Bread Financial Holdings, Inc. | 0.02 | 0.00 | 0.83 | 13.13 | 0.1958 | 0.0078 | |||
| IWN / iShares Trust - iShares Russell 2000 Value ETF | 0.01 | 0.10 | 0.82 | 2.38 | 0.1934 | -0.0117 | |||
| THC / Tenet Healthcare Corporation | 0.01 | 0.00 | 0.79 | 39.19 | 0.1875 | 0.0412 | |||
| MFIC / MidCap Financial Investment Corporation | 0.05 | 0.00 | 0.78 | 9.90 | 0.1840 | 0.0024 | |||
| SXT / Sensient Technologies Corporation | 0.01 | 0.00 | 0.74 | 4.84 | 0.1743 | -0.0062 | |||
| SYK / Stryker Corporation | 0.00 | 0.00 | 0.72 | 19.57 | 0.1708 | 0.0157 | |||
| IWS / iShares Trust - iShares Russell Mid-Cap Value ETF | 0.01 | 0.00 | 0.71 | 7.87 | 0.1688 | -0.0012 | |||
| LH / Labcorp Holdings Inc. | 0.00 | 5.91 | 0.71 | 1.71 | 0.1687 | -0.0112 | |||
| RSP / Invesco Exchange-Traded Fund Trust - Invesco S&P 500 Equal Weight ETF | 0.00 | 9.42 | 0.71 | 17.41 | 0.1677 | 0.0127 | |||
| GOOGL / Alphabet Inc. | 0.00 | 0.00 | 0.71 | 8.12 | 0.1672 | -0.0008 | |||
| ZBH / Zimmer Biomet Holdings, Inc. | 0.01 | 0.00 | 0.70 | 8.47 | 0.1668 | -0.0001 | |||
| LYTS / LSI Industries Inc. | 0.05 | 0.70 | 0.1660 | 0.1660 | |||||
| MKSI / MKS Inc. | 0.01 | 0.00 | 0.67 | 29.23 | 0.1593 | 0.0256 | |||
| CXT / Crane NXT, Co. | 0.01 | -1.36 | 0.67 | 7.35 | 0.1593 | -0.0017 | |||
| STAG / STAG Industrial, Inc. | 0.02 | 13.91 | 0.67 | 11.52 | 0.1583 | 0.0043 | |||
| CVX / Chevron Corporation | 0.00 | 0.91 | 0.65 | 6.79 | 0.1528 | -0.0026 | |||
| ED / Consolidated Edison, Inc. | 0.01 | 0.00 | 0.64 | -0.16 | 0.1504 | -0.0131 | |||
| PEP / PepsiCo, Inc. | 0.00 | 0.00 | 0.63 | 2.94 | 0.1496 | -0.0080 | |||
| BRK.A / Berkshire Hathaway Inc. | 0.00 | 0.00 | 0.63 | 16.05 | 0.1490 | 0.0096 | |||
| CAG / Conagra Brands, Inc. | 0.02 | 0.00 | 0.63 | 3.48 | 0.1480 | -0.0073 | |||
| HON / Honeywell International Inc. | 0.00 | 1.00 | 0.62 | -1.11 | 0.1474 | -0.0144 | |||
| KO / The Coca-Cola Company | 0.01 | -0.59 | 0.62 | 3.17 | 0.1466 | -0.0076 | |||
| TIP / iShares Trust - iShares TIPS Bond ETF | 0.01 | 1.86 | 0.61 | 1.66 | 0.1448 | -0.0096 | |||
| MS / Morgan Stanley | 0.01 | 0.00 | 0.59 | 0.85 | 0.1403 | -0.0105 | |||
| UFPT / UFP Technologies, Inc. | 0.00 | -43.85 | 0.58 | -17.71 | 0.1376 | -0.0438 | |||
| OMF / OneMain Holdings, Inc. | 0.01 | 0.00 | 0.58 | 3.95 | 0.1371 | -0.0062 | |||
| PINC / Premier, Inc. | 0.03 | 29.12 | 0.57 | 27.52 | 0.1351 | 0.0202 | |||
| SAFT / Safety Insurance Group, Inc. | 0.01 | 0.00 | 0.57 | 8.21 | 0.1343 | -0.0005 | |||
| CRM / Salesforce, Inc. | 0.00 | -5.21 | 0.55 | 8.51 | 0.1298 | -0.0000 | |||
| BP / BP p.l.c. - Depositary Receipt (Common Stock) | 0.01 | 0.00 | 0.55 | 6.45 | 0.1292 | -0.0025 | |||
| ASB / Associated Banc-Corp | 0.03 | 0.00 | 0.54 | 0.56 | 0.1284 | -0.0102 | |||
| GM / General Motors Company | 0.01 | 0.00 | 0.54 | 26.23 | 0.1277 | 0.0179 | |||
| AGG / iShares Trust - iShares Core U.S. Aggregate Bond ETF | 0.01 | 26.89 | 0.53 | 25.35 | 0.1266 | 0.0169 | |||
| ASIX / AdvanSix Inc. | 0.02 | 0.00 | 0.50 | -4.57 | 0.1188 | -0.0163 | |||
| LANC / Lancaster Colony Corporation | 0.00 | 0.00 | 0.49 | 24.81 | 0.1156 | 0.0151 | |||
| CRMT / America's Car-Mart, Inc. | 0.01 | 0.00 | 0.49 | -15.77 | 0.1152 | -0.0331 | |||
| FHI / Federated Hermes, Inc. | 0.01 | 0.00 | 0.48 | 6.65 | 0.1140 | -0.0020 | |||
| SCHP / Schwab Strategic Trust - Schwab U.S. TIPS ETF | 0.01 | -0.40 | 0.47 | -0.42 | 0.1111 | -0.0101 | |||
| CLF / Cleveland-Cliffs Inc. | 0.02 | 0.00 | 0.46 | 11.35 | 0.1093 | 0.0028 | |||
| SMP / Standard Motor Products, Inc. | 0.01 | 0.00 | 0.44 | -15.65 | 0.1047 | -0.0301 | |||
| NOMD / Nomad Foods Limited | 0.02 | 0.00 | 0.43 | 15.47 | 0.1025 | 0.0061 | |||
| VXUS / Vanguard STAR Funds - Vanguard Total International Stock ETF | 0.01 | 0.00 | 0.43 | 3.87 | 0.1018 | -0.0044 | |||
| EUSA / iShares, Inc. - iShares MSCI USA Equal Weighted ETF | 0.00 | 96.67 | 0.43 | 112.38 | 0.1017 | 0.0496 | |||
| AQN / Algonquin Power & Utilities Corp. | 0.07 | -3.61 | 0.42 | -3.70 | 0.0988 | -0.0125 | |||
| SHEL / Shell plc - Depositary Receipt (Common Stock) | 0.01 | 0.00 | 0.41 | 1.97 | 0.0981 | -0.0064 | |||
| BC / Brunswick Corporation | 0.00 | 0.00 | 0.40 | -0.25 | 0.0956 | -0.0084 | |||
| BDX / Becton, Dickinson and Company | 0.00 | 0.00 | 0.40 | 1.51 | 0.0955 | -0.0066 | |||
| MRNA / Moderna, Inc. | 0.00 | -5.10 | 0.40 | 1.54 | 0.0940 | -0.0063 | |||
| NGVT / Ingevity Corporation | 0.01 | 0.00 | 0.39 | 1.03 | 0.0930 | -0.0069 | |||
| FITB / Fifth Third Bancorp | 0.01 | 0.00 | 0.39 | 7.69 | 0.0930 | -0.0006 | |||
| KN / Knowles Corporation | 0.02 | 0.00 | 0.39 | -10.14 | 0.0924 | -0.0192 | |||
| AMG / Affiliated Managers Group, Inc. | 0.00 | 0.00 | 0.39 | 10.80 | 0.0923 | 0.0017 | |||
| CNI / Canadian National Railway Company | 0.00 | 0.00 | 0.38 | 4.99 | 0.0898 | -0.0032 | |||
| CP / Canadian Pacific Kansas City Limited | 0.00 | 0.37 | 0.0000 | ||||||
| CAT / Caterpillar Inc. | 0.00 | 0.00 | 0.37 | 24.07 | 0.0867 | 0.0108 | |||
| SCHB / Schwab Strategic Trust - Schwab U.S. Broad Market ETF | 0.01 | 0.37 | 0.37 | 10.24 | 0.0867 | 0.0012 | |||
| FNF / Fidelity National Financial, Inc. | 0.01 | 17.49 | 0.36 | 22.45 | 0.0853 | 0.0096 | |||
| ADP / Automatic Data Processing, Inc. | 0.00 | 0.00 | 0.36 | 7.23 | 0.0845 | -0.0011 | |||
| AVGO / Broadcom Inc. | 0.00 | 0.00 | 0.36 | 18.67 | 0.0844 | 0.0073 | |||
| VMI / Valmont Industries, Inc. | 0.00 | 79.86 | 0.35 | 76.12 | 0.0840 | 0.0321 | |||
| MHK / Mohawk Industries, Inc. | 0.00 | 0.00 | 0.35 | 26.64 | 0.0823 | 0.0117 | |||
| APOG / Apogee Enterprises, Inc. | 0.01 | 0.00 | 0.34 | 10.61 | 0.0816 | 0.0017 | |||
| IWV / iShares Trust - iShares Russell 3000 ETF | 0.00 | 0.00 | 0.34 | 9.58 | 0.0813 | 0.0008 | |||
| CLX / The Clorox Company | 0.00 | 0.00 | 0.34 | 7.37 | 0.0794 | -0.0009 | |||
| HUN / Huntsman Corporation | 0.01 | 0.00 | 0.33 | 3.44 | 0.0786 | -0.0038 | |||
| DLX / Deluxe Corporation | 0.02 | 0.00 | 0.33 | -4.09 | 0.0778 | -0.0102 | |||
| SFM / Sprouts Farmers Market, Inc. | 0.01 | -14.26 | 0.32 | 14.95 | 0.0766 | 0.0043 | |||
| HI / Hillenbrand, Inc. | 0.01 | 0.00 | 0.32 | 5.30 | 0.0754 | -0.0025 | |||
| DOV / Dover Corporation | 0.00 | 0.00 | 0.31 | 15.30 | 0.0732 | 0.0042 | |||
| BHLB / Berkshire Hills Bancorp, Inc. | 0.01 | 0.00 | 0.31 | -7.78 | 0.0731 | -0.0128 | |||
| HELE / Helen of Troy Limited | 0.00 | 0.00 | 0.30 | -4.76 | 0.0712 | -0.0098 | |||
| ACU / Acme United Corporation | 0.01 | -40.70 | 0.28 | -35.05 | 0.0660 | -0.0442 | |||
| OTTR / Otter Tail Corporation | 0.00 | 0.00 | 0.28 | 1.46 | 0.0660 | -0.0044 | |||
| AMGN / Amgen Inc. | 0.00 | 0.00 | 0.28 | -1.07 | 0.0656 | -0.0065 | |||
| CRI / Carter's, Inc. | 0.00 | 0.00 | 0.26 | 13.30 | 0.0625 | 0.0025 | |||
| FBIN / Fortune Brands Innovations, Inc. | 0.00 | 0.00 | 0.26 | 11.35 | 0.0604 | 0.0014 | |||
| PK / Park Hotels & Resorts Inc. | 0.01 | 0.00 | 0.25 | 14.61 | 0.0595 | 0.0030 | |||
| VYX / NCR Voyix Corporation | 0.02 | 0.00 | 0.25 | -25.37 | 0.0593 | -0.0269 | |||
| PAYX / Paychex, Inc. | 0.00 | 0.00 | 0.25 | 2.94 | 0.0581 | -0.0031 | |||
| MO / Altria Group, Inc. | 0.01 | 0.00 | 0.23 | 8.33 | 0.0554 | -0.0002 | |||
| PKG / Packaging Corporation of America | 0.00 | 0.23 | 0.0539 | 0.0539 | |||||
| BKFOF / Brookfield Corporation - Preferred Stock | 0.01 | 0.00 | 0.23 | 4.63 | 0.0535 | -0.0021 | |||
| NDAQ / Nasdaq, Inc. | 0.00 | 0.00 | 0.22 | 8.82 | 0.0527 | -0.0000 | |||
| DUK / Duke Energy Corporation | 0.00 | 0.00 | 0.22 | -0.46 | 0.0518 | -0.0046 | |||
| DAR / Darling Ingredients Inc. | 0.00 | 0.00 | 0.22 | -6.84 | 0.0517 | -0.0084 | |||
| HSII / Heidrick & Struggles International, Inc. | 0.01 | 0.21 | 0.0506 | 0.0506 | |||||
| KMI / Kinder Morgan, Inc. | 0.01 | -6.18 | 0.21 | -2.31 | 0.0501 | -0.0056 | |||
| PDCO / Patterson Companies, Inc. | 0.01 | 0.00 | 0.20 | -2.91 | 0.0475 | -0.0055 | |||
| TBNK / Territorial Bancorp Inc. | 0.02 | 0.00 | 0.18 | -27.94 | 0.0423 | -0.0212 | |||
| PARA / Paramount Global | 0.01 | -0.24 | 0.17 | -20.37 | 0.0408 | -0.0150 | |||
| SBRA / Sabra Health Care REIT, Inc. | 0.01 | 0.00 | 0.16 | 3.92 | 0.0377 | -0.0018 | |||
| WBD / Warner Bros. Discovery, Inc. | 0.02 | -9.73 | 0.13 | -31.05 | 0.0312 | -0.0177 | |||
| RQI / Cohen & Steers Quality Income Realty Fund, Inc. | 0.01 | 0.00 | 0.13 | -0.78 | 0.0303 | -0.0030 | |||
| PNNT / PennantPark Investment Corporation | 0.01 | 0.00 | 0.08 | 0.00 | 0.0179 | -0.0016 | |||
| NBIO / Nascent Biotech, Inc. | 0.10 | 0.00 | 0.02 | -16.67 | 0.0037 | -0.0009 | |||
| NYMXF / Nymox Pharmaceutical Corporation | 0.01 | 0.00 | 0.00 | -20.00 | 0.0009 | -0.0006 | |||
| ZEV / Lightning eMotors Inc | 0.01 | 0.00 | 0.00 | -100.00 | 0.0001 | -0.0007 | |||
| QCOM / QUALCOMM Incorporated | 0.00 | -100.00 | 0.00 | 0.0000 | |||||
| NYCB / Flagstar Financial, Inc. | 0.00 | -100.00 | 0.00 | 0.0000 | |||||
| NATL / NCR Atleos Corporation | 0.00 | -100.00 | 0.00 | 0.0000 | |||||
| IBM / International Business Machines Corporation | 0.00 | -100.00 | 0.00 | 0.0000 | |||||
| BA / The Boeing Company | 0.00 | -100.00 | 0.00 | 0.0000 | |||||
| HAYN / Haynes International, Inc. | 0.00 | -100.00 | 0.00 | 0.0000 |