Statistik Asas
| Nilai Portfolio | $ 708,315,948 |
| Kedudukan Semasa | 177 |
Pegangan Terkini, Prestasi, AUM (dari 13F, 13D)
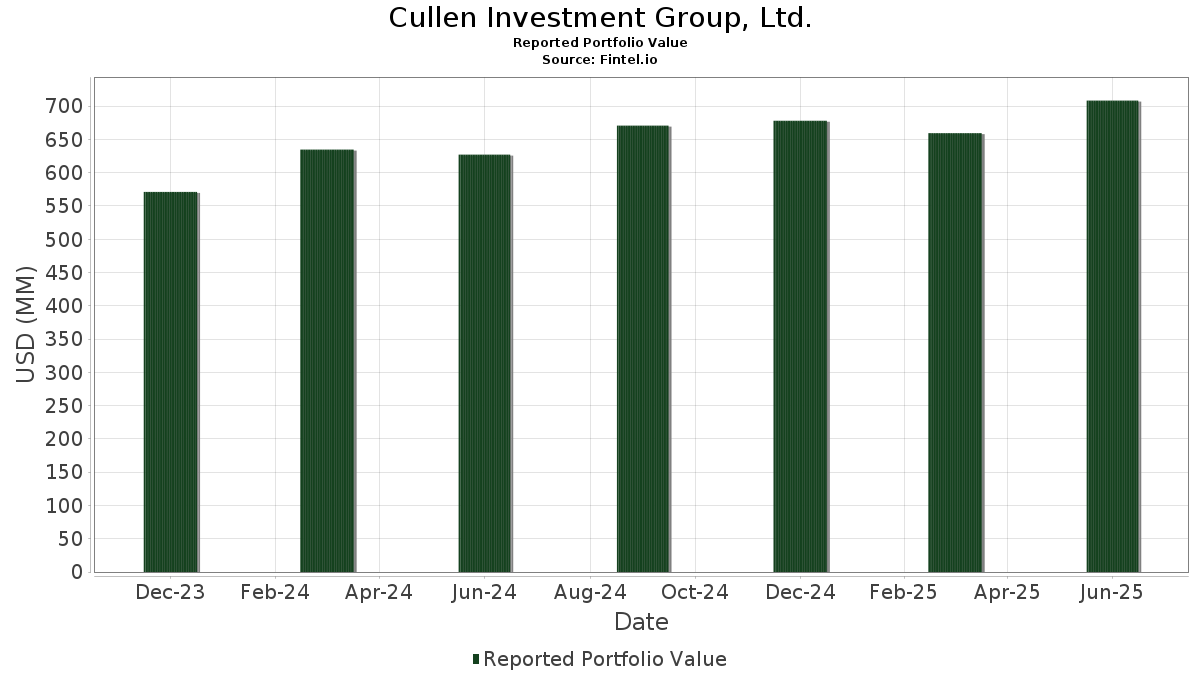
Cullen Investment Group, Ltd. telah mendedahkan 177 jumlah pegangan dalam pemfailan SEC terkini mereka. Nilai portfolio terkini dikira sebagai $ 708,315,948 USD. Aset Sebenar Di Bawah Pengurusan (AUM) ialah nilai ini ditambah dengan tunai (yang tidak didedahkan). Pegangan teratas Cullen Investment Group, Ltd. ialah Berkshire Hathaway Inc. (US:BRK.B) , Microsoft Corporation (US:MSFT) , Apple Inc. (US:AAPL) , Walmart Inc. (US:WMT) , and JPMorgan Chase & Co. (US:JPM) . Kedudukan baharu Cullen Investment Group, Ltd. termasuk Credo Technology Group Holding Ltd (US:CRDO) , Tractor Supply Company (US:TSCO) , Invesco QQQ Trust, Series 1 (US:QQQ) , Vicor Corporation (US:VICR) , and The Travelers Companies, Inc. (US:TRV) .
Kenaikan Teratas Suku Tahun Ini
Kami menggunakan perubahan dalam peruntukan portfolio kerana ini adalah metrik yang paling bermakna. Perubahan boleh disebabkan oleh perdagangan atau perubahan dalam harga saham.
| Sekuriti | Saham (MM) |
Nilai (MM$) |
Portfolio % | ΔPortfolio % |
|---|---|---|---|---|
| 0.09 | 44.08 | 6.2227 | 1.2170 | |
| 0.08 | 23.20 | 3.2756 | 1.2095 | |
| 0.07 | 26.15 | 3.6923 | 0.7326 | |
| 0.08 | 10.05 | 1.4186 | 0.6856 | |
| 0.11 | 17.76 | 2.5078 | 0.6647 | |
| 0.10 | 30.00 | 4.2350 | 0.4518 | |
| 0.09 | 9.84 | 1.3889 | 0.3219 | |
| 0.03 | 11.71 | 1.6527 | 0.2694 | |
| 0.33 | 32.02 | 4.5206 | 0.1913 | |
| 0.02 | 3.29 | 0.4646 | 0.1599 |
Penurunan Teratas Suku Tahun Ini
Kami menggunakan perubahan dalam peruntukan portfolio kerana ini adalah metrik yang paling bermakna. Perubahan boleh disebabkan oleh perdagangan atau perubahan dalam harga saham.
| Sekuriti | Saham (MM) |
Nilai (MM$) |
Portfolio % | ΔPortfolio % |
|---|---|---|---|---|
| 0.10 | 47.32 | 6.6804 | -1.1900 | |
| 0.21 | 43.41 | 6.1289 | -0.9778 | |
| 0.03 | 4.31 | 0.6088 | -0.2450 | |
| 0.08 | 7.61 | 1.0740 | -0.2409 | |
| 0.01 | 1.76 | 0.2478 | -0.2129 | |
| 0.01 | 9.75 | 1.3759 | -0.2115 | |
| 0.26 | 8.13 | 1.1474 | -0.2105 | |
| 0.00 | 0.49 | 0.0689 | -0.1960 | |
| 0.03 | 10.13 | 1.4308 | -0.1660 | |
| 0.00 | 0.21 | 0.0294 | -0.1623 |
13F dan Pemfailan Dana
Borang ini telah difailkan pada 2025-07-01 untuk tempoh pelaporan 2025-06-30. Klik ikon pautan untuk melihat sejarah transaksi penuh.
Tingkatkan untuk membuka data premium dan eksport ke Excel ![]() .
.
| Sekuriti | Jenis | Purata Harga Saham | Saham (MM) |
ΔSaham (%) |
ΔSaham (%) |
Nilai ($MM) |
Portfolio (%) |
ΔPortfolio (%) |
|
|---|---|---|---|---|---|---|---|---|---|
| BRK.B / Berkshire Hathaway Inc. | 0.10 | -0.03 | 47.32 | -8.82 | 6.6804 | -1.1900 | |||
| MSFT / Microsoft Corporation | 0.09 | 0.78 | 44.08 | 33.54 | 6.2227 | 1.2170 | |||
| AAPL / Apple Inc. | 0.21 | 0.30 | 43.41 | -7.36 | 6.1289 | -0.9778 | |||
| WMT / Walmart Inc. | 0.33 | 0.71 | 32.02 | 12.17 | 4.5206 | 0.1913 | |||
| JPM / JPMorgan Chase & Co. | 0.10 | 1.75 | 30.00 | 20.25 | 4.2350 | 0.4518 | |||
| ETN / Eaton Corporation plc | 0.07 | 2.04 | 26.15 | 34.01 | 3.6923 | 0.7326 | |||
| AVGO / Broadcom Inc. | 0.08 | 3.45 | 23.20 | 70.31 | 3.2756 | 1.2095 | |||
| NVDA / NVIDIA Corporation | 0.11 | 0.27 | 17.76 | 46.17 | 2.5078 | 0.6647 | |||
| GOOG / Alphabet Inc. | 0.09 | -0.98 | 16.69 | 12.43 | 2.3568 | 0.1049 | |||
| AMZN / Amazon.com, Inc. | 0.06 | 1.56 | 12.55 | 17.12 | 1.7717 | 0.1466 | |||
| DE / Deere & Company | 0.02 | -3.96 | 12.28 | 4.04 | 1.7339 | -0.0563 | |||
| UNP / Union Pacific Corporation | 0.05 | 3.87 | 11.90 | 1.16 | 1.6803 | -0.1040 | |||
| TT / Trane Technologies plc | 0.03 | -1.14 | 11.71 | 28.36 | 1.6527 | 0.2694 | |||
| XOM / Exxon Mobil Corporation | 0.10 | 9.29 | 11.29 | -0.94 | 1.5946 | -0.1345 | |||
| MSI / Motorola Solutions, Inc. | 0.03 | 7.94 | 10.65 | 3.66 | 1.5031 | -0.0545 | |||
| V / Visa Inc. | 0.03 | -4.99 | 10.13 | -3.74 | 1.4308 | -0.1660 | |||
| PEP / PepsiCo, Inc. | 0.08 | 136.07 | 10.05 | 107.90 | 1.4186 | 0.6856 | |||
| JCI / Johnson Controls International plc | 0.09 | 6.05 | 9.84 | 39.83 | 1.3889 | 0.3219 | |||
| LLY / Eli Lilly and Company | 0.01 | -1.35 | 9.75 | -6.90 | 1.3759 | -0.2115 | |||
| MRK / Merck & Co., Inc. | 0.12 | 9.29 | 9.53 | -3.62 | 1.3459 | -0.1541 | |||
| CMCSA / Comcast Corporation | 0.26 | 0.49 | 9.12 | -2.80 | 1.2876 | -0.1355 | |||
| CME / CME Group Inc. | 0.03 | 9.08 | 8.26 | 13.33 | 1.1665 | 0.0608 | |||
| EPD / Enterprise Products Partners L.P. - Limited Partnership | 0.26 | -0.07 | 8.13 | -9.23 | 1.1474 | -0.2105 | |||
| VZ / Verizon Communications Inc. | 0.18 | 3.08 | 7.67 | -1.67 | 1.0822 | -0.1001 | |||
| SBUX / Starbucks Corporation | 0.08 | -6.07 | 7.61 | -12.25 | 1.0740 | -0.2409 | |||
| DRI / Darden Restaurants, Inc. | 0.03 | 5.86 | 7.54 | 11.05 | 1.0639 | 0.0349 | |||
| MDT / Medtronic plc | 0.09 | 7.24 | 7.49 | 4.03 | 1.0574 | -0.0345 | |||
| SO / The Southern Company | 0.08 | 16.37 | 7.29 | 16.21 | 1.0293 | 0.0779 | |||
| UPS / United Parcel Service, Inc. | 0.07 | 19.06 | 7.24 | 9.26 | 1.0228 | 0.0172 | |||
| HD / The Home Depot, Inc. | 0.02 | 4.66 | 6.57 | 4.70 | 0.9272 | -0.0241 | |||
| GRMN / Garmin Ltd. | 0.03 | -1.01 | 6.47 | -4.84 | 0.9132 | -0.1177 | |||
| ADI / Analog Devices, Inc. | 0.03 | 8.61 | 6.09 | 28.19 | 0.8604 | 0.1394 | |||
| META / Meta Platforms, Inc. | 0.01 | -0.13 | 6.01 | 27.91 | 0.8484 | 0.1358 | |||
| DIS / The Walt Disney Company | 0.04 | 3.12 | 5.49 | 29.58 | 0.7755 | 0.1326 | |||
| O / Realty Income Corporation | 0.09 | 18.08 | 5.42 | 17.28 | 0.7656 | 0.0643 | |||
| PEG / Public Service Enterprise Group Incorporated | 0.06 | 19.42 | 5.41 | 22.16 | 0.7644 | 0.0921 | |||
| LOW / Lowe's Companies, Inc. | 0.02 | -3.48 | 5.41 | -8.19 | 0.7640 | -0.1299 | |||
| BBY / Best Buy Co., Inc. | 0.08 | 6.93 | 5.19 | -2.48 | 0.7326 | -0.0744 | |||
| CMI / Cummins Inc. | 0.02 | -1.59 | 5.14 | 2.82 | 0.7255 | -0.0324 | |||
| UNH / UnitedHealth Group Incorporated | 0.02 | 45.48 | 4.80 | -13.35 | 0.6772 | -0.1622 | |||
| FIS / Fidelity National Information Services, Inc. | 0.06 | 10.43 | 4.76 | 20.39 | 0.6720 | 0.0723 | |||
| SYK / Stryker Corporation | 0.01 | -1.01 | 4.75 | 5.21 | 0.6699 | -0.0141 | |||
| MKC / McCormick & Company, Incorporated | 0.06 | -5.65 | 4.59 | -13.09 | 0.6480 | -0.1529 | |||
| JNJ / Johnson & Johnson | 0.03 | -16.84 | 4.31 | -23.40 | 0.6088 | -0.2450 | |||
| PG / The Procter & Gamble Company | 0.03 | -5.30 | 4.20 | -11.46 | 0.5931 | -0.1265 | |||
| RJF / Raymond James Financial, Inc. | 0.03 | -0.72 | 4.10 | 9.62 | 0.5793 | 0.0116 | |||
| BLK / BlackRock, Inc. | 0.00 | -2.94 | 3.99 | 7.61 | 0.5634 | 0.0010 | |||
| POOL / Pool Corporation | 0.01 | 7.33 | 3.99 | -1.73 | 0.5628 | -0.0524 | |||
| CRM / Salesforce, Inc. | 0.01 | -3.30 | 3.97 | -1.73 | 0.5604 | -0.0523 | |||
| MA / Mastercard Incorporated | 0.01 | -9.25 | 3.86 | -6.97 | 0.5447 | -0.0842 | |||
| GLW / Corning Incorporated | 0.07 | -2.95 | 3.79 | 11.48 | 0.5348 | 0.0195 | |||
| IQV / IQVIA Holdings Inc. | 0.02 | 21.45 | 3.73 | 8.56 | 0.5262 | 0.0055 | |||
| AXP / American Express Company | 0.01 | -2.68 | 3.60 | 15.37 | 0.5077 | 0.0350 | |||
| CAT / Caterpillar Inc. | 0.01 | 0.23 | 3.38 | 17.97 | 0.4774 | 0.0427 | |||
| CVX / Chevron Corporation | 0.02 | -3.11 | 3.35 | -17.06 | 0.4736 | -0.1399 | |||
| AMD / Advanced Micro Devices, Inc. | 0.02 | 18.59 | 3.29 | 63.81 | 0.4646 | 0.1599 | |||
| ALL / The Allstate Corporation | 0.01 | 0.21 | 2.85 | -2.57 | 0.4019 | -0.0413 | |||
| ENB / Enbridge Inc. | 0.06 | -4.43 | 2.78 | -2.25 | 0.3921 | -0.0388 | |||
| NXPI / NXP Semiconductors N.V. | 0.01 | 13.96 | 2.60 | 30.98 | 0.3672 | 0.0661 | |||
| ABBV / AbbVie Inc. | 0.01 | -1.02 | 2.50 | -12.33 | 0.3535 | -0.0796 | |||
| CP / Canadian Pacific Kansas City Limited | 0.03 | -0.79 | 2.49 | 12.06 | 0.3517 | 0.0144 | |||
| NFG / National Fuel Gas Company | 0.03 | -2.73 | 2.36 | 4.06 | 0.3328 | -0.0108 | |||
| FI / Fiserv, Inc. | 0.01 | 1.25 | 2.29 | -20.96 | 0.3239 | -0.1162 | |||
| AMGN / Amgen Inc. | 0.01 | -1.58 | 2.29 | -11.78 | 0.3227 | -0.0703 | |||
| SCHW / The Charles Schwab Corporation | 0.02 | 4.14 | 2.25 | 21.41 | 0.3172 | 0.0365 | |||
| VEEV / Veeva Systems Inc. | 0.01 | 4.73 | 2.25 | 30.22 | 0.3170 | 0.0555 | |||
| PGR / The Progressive Corporation | 0.01 | -6.35 | 2.18 | -11.69 | 0.3071 | -0.0665 | |||
| HWM / Howmet Aerospace Inc. | 0.01 | -0.26 | 2.16 | 43.12 | 0.3056 | 0.0762 | |||
| LHX / L3Harris Technologies, Inc. | 0.01 | 2.56 | 2.05 | 22.88 | 0.2890 | 0.0364 | |||
| T / AT&T Inc. | 0.06 | -1.97 | 1.86 | 0.32 | 0.2626 | -0.0186 | |||
| BAC / Bank of America Corporation | 0.04 | -0.05 | 1.85 | 13.40 | 0.2616 | 0.0137 | |||
| GOOGL / Alphabet Inc. | 0.01 | -2.13 | 1.81 | 11.55 | 0.2550 | 0.0094 | |||
| FANG / Diamondback Energy, Inc. | 0.01 | 20.75 | 1.78 | 3.79 | 0.2516 | -0.0089 | |||
| MPC / Marathon Petroleum Corporation | 0.01 | -49.32 | 1.76 | -42.21 | 0.2478 | -0.2129 | |||
| QCOM / QUALCOMM Incorporated | 0.01 | 7.38 | 1.75 | 11.32 | 0.2473 | 0.0087 | |||
| EW / Edwards Lifesciences Corporation | 0.02 | 3.96 | 1.70 | 12.20 | 0.2402 | 0.0102 | |||
| CMG / Chipotle Mexican Grill, Inc. | 0.03 | 30.98 | 1.70 | 46.55 | 0.2396 | 0.0639 | |||
| RSG / Republic Services, Inc. | 0.01 | 0.13 | 1.69 | 1.99 | 0.2385 | -0.0127 | |||
| SNPS / Synopsys, Inc. | 0.00 | 92.90 | 1.66 | 130.78 | 0.2340 | 0.1250 | |||
| ECL / Ecolab Inc. | 0.01 | 77.45 | 1.56 | 88.61 | 0.2197 | 0.0946 | |||
| GILD / Gilead Sciences, Inc. | 0.01 | -3.99 | 1.55 | -5.02 | 0.2191 | -0.0286 | |||
| KMI / Kinder Morgan, Inc. | 0.05 | -1.66 | 1.53 | 1.39 | 0.2162 | -0.0130 | |||
| ORLY / O'Reilly Automotive, Inc. | 0.02 | 1,350.80 | 1.40 | -8.70 | 0.1970 | -0.0348 | |||
| RTX / RTX Corporation | 0.01 | -0.96 | 1.37 | 9.17 | 0.1934 | 0.0031 | |||
| GD / General Dynamics Corporation | 0.00 | -8.58 | 1.31 | -2.09 | 0.1848 | -0.0181 | |||
| TROW / T. Rowe Price Group, Inc. | 0.01 | -0.89 | 1.30 | 4.10 | 0.1830 | -0.0058 | |||
| SHEL / Shell plc - Depositary Receipt (Common Stock) | 0.02 | 0.66 | 1.29 | -3.23 | 0.1822 | -0.0201 | |||
| HBCP / Home Bancorp, Inc. | 0.02 | -1.34 | 1.25 | 13.96 | 0.1765 | 0.0102 | |||
| DXCM / DexCom, Inc. | 0.01 | 11.18 | 1.24 | 42.11 | 0.1755 | 0.0428 | |||
| VOO / Vanguard Index Funds - Vanguard S&P 500 ETF | 0.00 | 11.85 | 1.24 | 23.68 | 0.1748 | 0.0229 | |||
| IBM / International Business Machines Corporation | 0.00 | 4.30 | 1.23 | 23.64 | 0.1737 | 0.0228 | |||
| SU / Suncor Energy Inc. | 0.03 | 0.80 | 1.18 | -2.48 | 0.1666 | -0.0170 | |||
| GE / General Electric Company | 0.00 | -0.15 | 1.17 | 28.37 | 0.1656 | 0.0271 | |||
| ET / Energy Transfer LP - Limited Partnership | 0.06 | -0.78 | 1.16 | -3.26 | 0.1636 | -0.0180 | |||
| MDLZ / Mondelez International, Inc. | 0.02 | -1.92 | 1.16 | -2.53 | 0.1634 | -0.0166 | |||
| CSX / CSX Corporation | 0.04 | -0.40 | 1.15 | 10.40 | 0.1619 | 0.0044 | |||
| NATH / Nathan's Famous, Inc. | 0.01 | 0.00 | 1.15 | 14.73 | 0.1618 | 0.0103 | |||
| WY / Weyerhaeuser Company | 0.04 | -3.31 | 1.13 | -15.11 | 0.1594 | -0.0424 | |||
| OKE / ONEOK, Inc. | 0.01 | -0.47 | 1.13 | -18.12 | 0.1588 | -0.0495 | |||
| TSLA / Tesla, Inc. | 0.00 | 0.03 | 1.09 | 22.56 | 0.1543 | 0.0191 | |||
| CNH / CNH Industrial N.V. | 0.08 | 0.36 | 1.07 | 5.92 | 0.1515 | -0.0021 | |||
| COR / Cencora, Inc. | 0.00 | -1.07 | 1.00 | 6.73 | 0.1411 | -0.0010 | |||
| WFC / Wells Fargo & Company | 0.01 | 0.43 | 0.97 | 12.14 | 0.1370 | 0.0057 | |||
| KO / The Coca-Cola Company | 0.01 | -2.48 | 0.95 | -3.67 | 0.1337 | -0.0154 | |||
| IVV / iShares Trust - iShares Core S&P 500 ETF | 0.00 | 30.73 | 0.92 | 44.38 | 0.1306 | 0.0335 | |||
| IRDM / Iridium Communications Inc. | 0.03 | -2.37 | 0.92 | 7.83 | 0.1303 | 0.0005 | |||
| GBX / The Greenbrier Companies, Inc. | 0.02 | -0.88 | 0.89 | -10.92 | 0.1256 | -0.0258 | |||
| BX / Blackstone Inc. | 0.01 | -0.31 | 0.88 | 6.70 | 0.1238 | -0.0008 | |||
| PARA / Paramount Global | 0.07 | 0.17 | 0.86 | 8.07 | 0.1210 | 0.0007 | |||
| IIIV / i3 Verticals, Inc. | 0.03 | -11.35 | 0.85 | -1.27 | 0.1205 | -0.0106 | |||
| CVS / CVS Health Corporation | 0.01 | -28.46 | 0.82 | -27.22 | 0.1156 | -0.0549 | |||
| NSRGY / Nestlé S.A. - Depositary Receipt (Common Stock) | 0.01 | 0.97 | 0.75 | -1.97 | 0.1056 | -0.0102 | |||
| PFE / Pfizer Inc. | 0.03 | -14.50 | 0.74 | -18.21 | 0.1047 | -0.0328 | |||
| ITOT / iShares Trust - iShares Core S&P Total U.S. Stock Market ETF | 0.00 | -3.08 | 0.66 | 7.28 | 0.0937 | -0.0001 | |||
| OXY / Occidental Petroleum Corporation | 0.02 | 3.38 | 0.66 | -11.98 | 0.0934 | -0.0206 | |||
| DVN / Devon Energy Corporation | 0.02 | -24.59 | 0.66 | -35.93 | 0.0930 | -0.0628 | |||
| WBD / Warner Bros. Discovery, Inc. | 0.06 | -11.30 | 0.64 | -5.20 | 0.0901 | -0.0121 | |||
| SJM / The J. M. Smucker Company | 0.01 | -1.80 | 0.64 | -18.52 | 0.0901 | -0.0287 | |||
| PEO / Adams Natural Resources Fund, Inc. | 0.03 | -2.38 | 0.61 | -8.51 | 0.0866 | -0.0151 | |||
| FGBI / First Guaranty Bancshares, Inc. | 0.07 | 0.12 | 0.61 | 6.88 | 0.0857 | -0.0004 | |||
| SMG / The Scotts Miracle-Gro Company | 0.01 | -19.05 | 0.60 | -2.75 | 0.0849 | -0.0089 | |||
| NVS / Novartis AG - Depositary Receipt (Common Stock) | 0.00 | -8.61 | 0.60 | -0.83 | 0.0843 | -0.0070 | |||
| KDP / Keurig Dr Pepper Inc. | 0.02 | -0.03 | 0.59 | -3.42 | 0.0838 | -0.0094 | |||
| QSR / Restaurant Brands International Inc. | 0.01 | 0.11 | 0.59 | -0.34 | 0.0837 | -0.0066 | |||
| KMB / Kimberly-Clark Corporation | 0.00 | -0.37 | 0.58 | -9.74 | 0.0825 | -0.0156 | |||
| MCD / McDonald's Corporation | 0.00 | -14.71 | 0.58 | -20.14 | 0.0823 | -0.0285 | |||
| TGT / Target Corporation | 0.01 | -8.76 | 0.57 | -13.68 | 0.0811 | -0.0199 | |||
| GEV / GE Vernova Inc. | 0.00 | -0.19 | 0.57 | 73.31 | 0.0798 | 0.0302 | |||
| EL / The Estée Lauder Companies Inc. | 0.01 | -29.97 | 0.56 | -14.31 | 0.0787 | -0.0199 | |||
| MCK / McKesson Corporation | 0.00 | -1.92 | 0.53 | 6.71 | 0.0741 | -0.0005 | |||
| ABT / Abbott Laboratories | 0.00 | -7.33 | 0.50 | -4.91 | 0.0712 | -0.0093 | |||
| BA / The Boeing Company | 0.00 | -0.25 | 0.50 | 22.72 | 0.0702 | 0.0087 | |||
| TJX / The TJX Companies, Inc. | 0.00 | -72.44 | 0.49 | -72.11 | 0.0689 | -0.1960 | |||
| WDFC / WD-40 Company | 0.00 | -3.16 | 0.47 | -9.54 | 0.0670 | -0.0125 | |||
| APD / Air Products and Chemicals, Inc. | 0.00 | -51.76 | 0.46 | -53.97 | 0.0656 | -0.0872 | |||
| CLF / Cleveland-Cliffs Inc. | 0.06 | 33.28 | 0.46 | 23.24 | 0.0645 | 0.0083 | |||
| CRDO / Credo Technology Group Holding Ltd | 0.00 | 0.44 | 0.0617 | 0.0617 | |||||
| HON / Honeywell International Inc. | 0.00 | -13.82 | 0.43 | -5.24 | 0.0613 | -0.0082 | |||
| PYPL / PayPal Holdings, Inc. | 0.01 | -16.63 | 0.43 | -5.07 | 0.0609 | -0.0080 | |||
| COP / ConocoPhillips | 0.00 | 0.77 | 0.42 | -13.82 | 0.0599 | -0.0148 | |||
| ICLR / ICON Public Limited Company | 0.00 | -30.24 | 0.42 | -42.05 | 0.0593 | -0.0505 | |||
| LMT / Lockheed Martin Corporation | 0.00 | -3.49 | 0.41 | 0.00 | 0.0579 | -0.0043 | |||
| FHN / First Horizon Corporation | 0.02 | 0.58 | 0.41 | 9.76 | 0.0573 | 0.0012 | |||
| WEN / The Wendy's Company | 0.04 | -6.69 | 0.41 | -27.16 | 0.0573 | -0.0272 | |||
| HAL / Halliburton Company | 0.02 | -28.09 | 0.40 | -42.22 | 0.0567 | -0.0487 | |||
| CNRD / Conrad Industries, Inc. | 0.02 | -11.00 | 0.39 | 33.90 | 0.0553 | 0.0110 | |||
| ITW / Illinois Tool Works Inc. | 0.00 | -1.40 | 0.37 | -1.61 | 0.0517 | -0.0048 | |||
| TSCO / Tractor Supply Company | 0.01 | 0.35 | 0.0497 | 0.0497 | |||||
| SEIC / SEI Investments Company | 0.00 | 0.57 | 0.35 | 16.39 | 0.0493 | 0.0038 | |||
| TRN / Trinity Industries, Inc. | 0.01 | -5.61 | 0.34 | -9.02 | 0.0484 | -0.0088 | |||
| XYL / Xylem Inc. | 0.00 | 0.00 | 0.32 | 8.47 | 0.0452 | 0.0004 | |||
| WWD / Woodward, Inc. | 0.00 | 0.08 | 0.32 | 34.45 | 0.0452 | 0.0091 | |||
| EBAY / eBay Inc. | 0.00 | -5.55 | 0.29 | 3.91 | 0.0413 | -0.0014 | |||
| ORCL / Oracle Corporation | 0.00 | 0.29 | 0.0403 | 0.0403 | |||||
| NSC / Norfolk Southern Corporation | 0.00 | -16.49 | 0.28 | -9.65 | 0.0397 | -0.0076 | |||
| SHW / The Sherwin-Williams Company | 0.00 | -0.37 | 0.27 | -2.14 | 0.0387 | -0.0037 | |||
| YUM / Yum! Brands, Inc. | 0.00 | 0.00 | 0.27 | -5.67 | 0.0376 | -0.0053 | |||
| BATRA / Atlanta Braves Holdings, Inc. | 0.01 | 0.00 | 0.26 | 12.07 | 0.0368 | 0.0016 | |||
| COST / Costco Wholesale Corporation | 0.00 | 0.00 | 0.26 | 4.84 | 0.0368 | -0.0010 | |||
| CNI / Canadian National Railway Company | 0.00 | 0.54 | 0.25 | 7.20 | 0.0358 | -0.0000 | |||
| JOE / The St. Joe Company | 0.01 | 0.18 | 0.25 | 1.66 | 0.0347 | -0.0019 | |||
| BWA / BorgWarner Inc. | 0.01 | 0.25 | 0.24 | 17.16 | 0.0337 | 0.0028 | |||
| VLO / Valero Energy Corporation | 0.00 | 0.00 | 0.24 | 2.15 | 0.0336 | -0.0019 | |||
| THO / THOR Industries, Inc. | 0.00 | -2.18 | 0.23 | 14.43 | 0.0326 | 0.0020 | |||
| ATO / Atmos Energy Corporation | 0.00 | 0.54 | 0.23 | 0.44 | 0.0324 | -0.0023 | |||
| EMR / Emerson Electric Co. | 0.00 | -11.84 | 0.23 | 7.08 | 0.0321 | -0.0001 | |||
| ADP / Automatic Data Processing, Inc. | 0.00 | 0.00 | 0.22 | 0.92 | 0.0310 | -0.0020 | |||
| QQQ / Invesco QQQ Trust, Series 1 | 0.00 | 0.21 | 0.0300 | 0.0300 | |||||
| CARR / Carrier Global Corporation | 0.00 | 0.21 | 0.0300 | 0.0300 | |||||
| APA / APA Corporation | 0.01 | 5.87 | 0.21 | -7.89 | 0.0297 | -0.0049 | |||
| ICE / Intercontinental Exchange, Inc. | 0.00 | -84.53 | 0.21 | -83.61 | 0.0294 | -0.1623 | |||
| BSM / Black Stone Minerals, L.P. - Limited Partnership | 0.02 | 2.71 | 0.20 | -12.07 | 0.0289 | -0.0064 | |||
| WSM / Williams-Sonoma, Inc. | 0.00 | 0.20 | 0.0287 | 0.0287 | |||||
| NEE / NextEra Energy, Inc. | 0.00 | -14.75 | 0.20 | -16.60 | 0.0285 | -0.0082 | |||
| VICR / Vicor Corporation | 0.00 | 0.20 | 0.0285 | 0.0285 | |||||
| TRV / The Travelers Companies, Inc. | 0.00 | 0.20 | 0.0282 | 0.0282 | |||||
| LILAK / Liberty Latin America Ltd. | 0.03 | 87.72 | 0.20 | 87.74 | 0.0282 | 0.0121 | |||
| BP / BP p.l.c. - Depositary Receipt (Common Stock) | 0.00 | -100.00 | 0.00 | 0.0000 | |||||
| PSX / Phillips 66 | 0.00 | -100.00 | 0.00 | 0.0000 | |||||
| INTC / Intel Corporation | 0.00 | -100.00 | 0.00 | 0.0000 | |||||
| CB / Chubb Limited | 0.00 | -100.00 | 0.00 | 0.0000 |